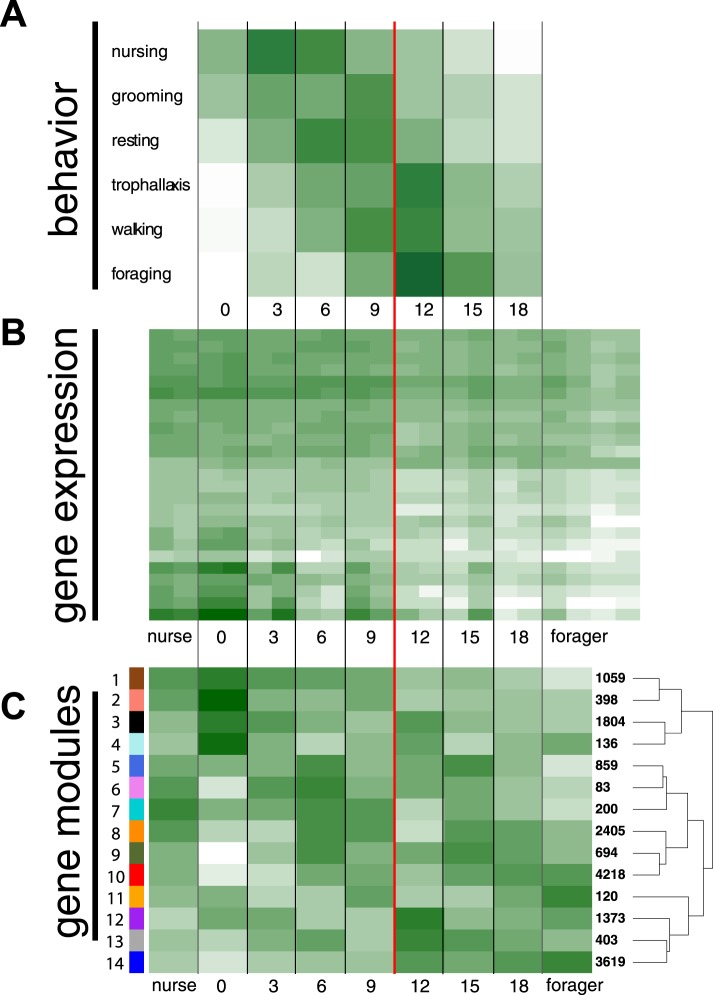
Figure 1. Behavioral and transcriptional changes associated with worker age and behavior.
Numbers along the x-axis represent ages of marked worker cohorts, starting at worker eclosion as an adult (day 0). In all plots dark green represents greater values, while white represents lower values of the measure being plotted. (A) Behavioral results. Workers showed an age-dependent progression of activity, progressing from tasks such as nursing and grooming in the nest to outside tasks such as walking and foraging. (B) Heat map of expression levels over the course of worker aging (higher expression in darker green), for 25 genes most differentially expressed between nurses and foragers. The red line separates the samples classified as ‘nurses’ by K-nearest neighbor classification on the left, from ‘foragers’ on the right, suggesting a distinct transition between the two categories. (C) Correlation between patterns of expression in the 14 identified modules across worker age and behavior. The colors of the boxes are scaled with the value of correlation coefficients, ranging from white to dark green. On the right side of the heat map are the numbers of genes in each module and a dendrogram showing the inferred relationships among modules. The modules show complex patterns of expression, for example with some most highly expressed at age 0, some showing decreasing expression over time, and some increasing expression over time.


