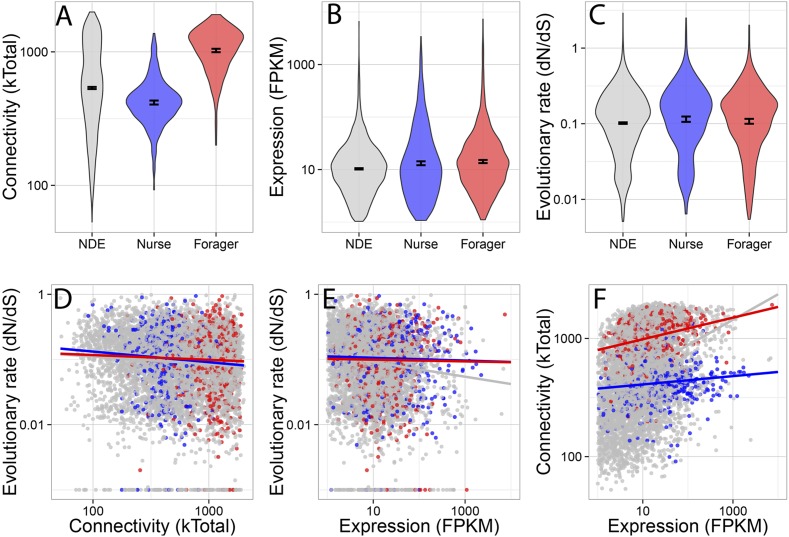
Figure 2. Connectivity, expression, and evolutionary rate for nurse-upregulated (blue), forager-upregulated (red), and non-differentially expressed genes (gray).
Overall, connectivity and expression are positively correlated (F) and negatively associated with evolutionary rate (D and E), as expected. At the same time, forager-upregulated genes are much more strongly connected while nurse-upregulated genes are more loosely connected compared to non-differentially expressed genes (A); Nurse-upregulated genes have a small but significant increase in evolutionary rate (C); and both forager- and nurse-upregulated genes are more highly expressed than non-differentially expressed genes (B). The top panels show results for all data, while the bottom panels show results only for genes with S. invicta orthologs that had estimated evolutionary rates.

