Abstract
Glucocorticoids are commonly used as palliative or chemotherapeutic clinical agents for treatment of a variety of cancers. Although steroid treatment is beneficial, the mechanisms by which steroids improve outcome in cancer patients are not well understood. Na,K-ATPase beta-subunit isoform 1 (NaK-β1) is a cell-cell adhesion molecule, and its expression is down-regulated in cancer cells undergoing epithelial-to mesenchymal-transition (EMT), a key event associated with cancer progression to metastatic disease. In this study, we performed high-throughput screening to identify small molecules that could up-regulate NaK-β1 expression in cancer cells. Compounds related to the glucocorticoids were identified as drug candidates enhancing NaK-β1 expression. Of these compounds, triamcinolone, dexamethasone, and fluorometholone were validated to increase NaK-β1 expression at the cell surface, enhance cell-cell adhesion, attenuate motility and invasiveness and induce mesenchymal to epithelial like transition of renal cell carcinoma (RCC) cells in vitro. Treatment of NaK-β1 knockdown cells with these drug candidates confirmed that these compounds mediate their effects through up-regulating NaK-β1. Furthermore, we demonstrated that these compounds attenuate tumor growth in subcutaneous RCC xenografts and reduce local invasiveness in orthotopically-implanted tumors. Our results strongly indicate that the addition of glucocorticoids in the treatment of RCC may improve outcome for RCC patients by augmenting NaK-β1 cell-cell adhesion function.
Introduction
Kidney cancer is among the most frequent cancers diagnosed [1]. Renal cell carcinoma (RCC) consists of three main histologic types: clear cell, papillary, and chromophobe [2]. Clear cell is the most clinically aggressive and represents the largest group of RCCs [2, 3]. Early stage RCC is resolved by partial or radical nephrectomy if the malignancy is localized, while advanced stages of disease are managed by cytoreductive therapy combined with drugs that target specific oncogenic pathways, such as the mammalian target of rapamycin (mTOR) [4]. The management of advanced RCC remains a significant challenge to clinicians and new therapeutic options are needed for patients with advanced disease.
The Na,K-ATPase is a ubiquitously expressed enzyme that derives energy from ATP to couple the translocation of three Na+ out and two K+ into the cell, generating a transmembrane sodium gradient that drives the uptake and release of diverse solutes by epithelial cells. The functional Na,K-ATPase consists of α- and β-subunits. The Na,K-ATPase α-subunit (NaK-α) is responsible for the catalytic function of the enzyme. The Na,K-ATPase β-subunit (NaK-β) associates with NaK-α in the endoplasmic reticulum to protect it from degradation and ensures the correct assembly and insertion of the mature enzyme into the plasma membrane. An accessory γ–subunit belonging to the FXYD family of proteins exhibits tissue specific expression and modulates Na,K-ATPase enzyme activity [5]. Of the four α- and three β-subunit isoforms known, the α1-subunit (NaK-α1) and β1-subunit (NaK-β1) are prominently expressed in most tissues, particularly in the kidney [6].
Studies from our laboratory and others have demonstrated the loss of NaK-β1 expression at the mRNA and protein level, and in some cases, its mislocalization has been noted in several cancers [7–9]. Furthermore, the marked reduction of NaK-β1 expression is associated with a higher risk for bladder cancer recurrence [8]. These initial studies implicated a potential role for NaK-β1 in attenuating tumor progression and prompted functional studies at the molecular level.
Recently, it has become evident that the NaK-β1 serves additional functions beyond its role in ion transport. NaK-β1 functions as a cell adhesion molecule and plays a critical role in the development of cell-cell contacts [10–16]. Re-expression of NaK-β1 along with the cell-cell adhesion molecule, E-cadherin, in kidney carcinoma cells abrogated cell motility and invasiveness in a synergistic manner and induced mesenchymal-to-epithelial transition (MET) [17]. TGF-β1 induced epithelial-to-mesenchymal transition (EMT) in kidney proximal tubule epithelial cells is associated with the reduced expression of both NaK-β1 and E-cadherin, and over-expression of NaK-β1 alone delayed the progression of EMT [18]. Anchorage independent growth is a hallmark of malignant transformation, and tumor suppressors block this feature [19]. Restoration of NaK-β1 expression in kidney carcinoma cells blocked anchorage- independent growth and reduced tumorigenicity in immuno-compromised mice [12]. More recently we showed that the NaK-β1 promoter is silenced by hyper methylation in RCC [20] like many other tumor suppressors [21]. These studies indicate that NaK-β1 has a tumor suppressor function in renal epithelial cells.
Given its plethora of roles in suppressing the tumor phenotype, enhancement of NaK-β1 expression in renal cancer cells may represent a novel mechanism for RCC treatment. Our approach was to identify compounds that augment NaK-β1 expression and examine their ability to prevent or delay the motility and invasiveness of kidney cancer cells. We focused on kidney cancer, since many of the previous studies exploring the anti-tumor roles of NaK-β1 have been characterized in kidney cells [6, 15, 16, 22]. We performed a high-throughput screen (HTS) using a cell-based gene reporter assay and identified several members of the glucocorticoid class of compounds. Here, we report that triamcinolone (TRIAM), dexamethasone (DEX), and fluorometholone (FLUOR) enhance cell-cell aggregation and reduce both the motility and invasiveness of kidney cancer cells in vitro in a NaK-β1 dependent manner. Additionally, we found that the drugs were effective in reducing tumor growth in a subcutaneous xenograft mouse model and the local invasiveness of orthotopically implanted kidney tumor cells in severe combined immunodeficient (SCID) mice. These studies support the use of glucocorticoids to attenuate progression of renal neoplasms through up-regulation of NaK-β1.
Materials and Methods
Cell lines and reagents
HeLa and Caki-1 cells from ATCC were maintained as described by the supplier (ATCC Rockville, MD). UMRC6 cells were from Dr. Michael I. Lerman (National Cancer Institute, Bethesda, MD) and maintained in RPMI with 10% FBS, 1 mM glutamine, 100 U/mL penicillin, and 100 μg/mL streptomycin [23]. DEX (Tocris Bioscience, Ellisville, MI), TRIAM and FLUOR (Sigma-Aldrich, St Louis, MO) were prepared in dimethyl sulfoxide (DMSO) (EMD Chemicals, Gibbstown, NJ) at 10,000-fold stock solution. Cells were serum starved prior to treatment and routinely treated with 100 nM or 10 μM of compound in serum free medium or medium containing charcoal-stripped FBS (Invitrogen, Carlsbad, CA) for 24 hr. For immunostaining, cells were treated with 10 μM for 3 days before fixation.
shRNA and transfections
The full-length NaK-β1 promoter fused to firefly luciferase described previously [9] was co-transfected with pBABE-puromycin into HeLa cells and single clones were selected after puromycin treatment. Positive clones were confirmed by luciferase assay after addition of DEX. shRNA against human NaK-β1 (shRNA-β) targets the sequence 5’-GTGATGCTGCTCACCATCA-3’ [18], was cloned into pSilencer (Applied Biosystems, Austin, TX), and transfected into Caki-1 as described previously [24]. For transfection of ptd-Tomato-N1 (Clontech, Mountain View, CA), nucleofector technology was used (Lonza, Walkersville, MD). Single cells expressing red fluorescent protein were picked after selection with G418 to establish stable cell lines.
Screening protocol
Cells were seeded in phenol-red free DMEM (Invitrogen, Carlsbad, CA) in white 384-well plates (ThermoFisher, Hudson, NH). Small molecule libraries were obtained from Biomol International LP (Plymouth Meeting, PA), MicroSource Inc. (Ann Arbor, MI), Prestwick Chemical (Washington, DC), Asinex (Moscow, Russia), and ChemBridge (San Diego, CA). Compounds were dissolved in DMSO and transferred into assay plates using a Biomek FX (Beckman Coulter, Brea, CA) equipped with a 384-pin tool (V&P Scientific, San Diego, CA). The final compound concentration was 10 μM except the Biomol library, which was used according to the manufacturer’s recommendation. Luciferase activity was assessed after 24 hr. Steady-lite (Perkin-Elmer, Waltham, MA) was added and luciferase activity was measured with a Victor3 plate reader (Perkin-Elmer). The hit cutoff was selected as 80% or more of the activity induced by DEX.
Antibodies
Na,K-ATPase α1- (M7-PB-E9) and β1-subunit (M17-P5-F11) antibodies have been previously well-characterized [25, 26]. Actin antibody was obtained from Sigma. N-Cadherin was from BD Biosciences (Franklin Lakes, NJ).
Quantitative PCR
RNA isolated with RNAqueous Kit (Ambion, Austin, TX) was reverse transcribed using the High-Capacity cDNA Archive Kit (Applied Biosystems, Foster City, CA). Taqman probes specific for human NaK-α1, NaK-β1, and hypoxanthine phosphoribosyl transferase (HPRT) were from Applied Biosystems. Q-PCR was performed with a 7900HT Fast Real-Time PCR system (Applied Biosystems). Samples were assayed in triplicate and normalized to HPRT. All data represent the mean of three to four independent experiments ± standard deviation.
Immunoblotting
Cells were washed with PBS and lysed in lysis buffer (20 mM Tris-HCl, pH 7.4, 100 mM NaCl, 1% Triton X-100, 1 mM EDTA, 1 mM EGTA, 1 mM sodium glycerolphosphate, 1 mM sodium orthovanadate, 1 mM PMSF, and 5 μg/ml each of antipain, leupeptin, and pepstatin). After sonication and clarification, the supernatants were collected and protein estimated (Bio-Rad, Hercules, CA). Equal amounts of total protein were separated by SDS-PAGE and transferred to nitrocellulose membrane (Schleicher & Schuell, Keene, NH). Blocking occurred in 5% nonfat dry milk in PBS with 0.1% Tween 20 (PBS-T). Primary antibodies were diluted in blocking solution and membranes were incubated overnight at 4°C. Blots were washed with PBS-T and developed with the enhanced chemiluminescence western lightning system (Perkin-Elmer, Waltham, MA).
Cell surface biotinylation assay
Cells were washed in cold PBS containing 1 mM MgCl2 and 0.1 mM CaCl2 (PBS-CM). EZ-Link Sulfo-NHS-LC-Biotin (ThermoFisher) freshly prepared in DMSO was diluted into TEA buffer (150 mM NaCl, 10 mM triethanolamine pH 9, 1 mM CaCl2, and 1 mM MgCl2) at 4 mg/mL and reacted with the cells on ice. After PBS-CM washes, excess biotin was quenched with 50 mM NH4Cl in PBS-CM. Cells were lysed in lysis buffer. Samples were sonicated, protein estimated, pre-cleared with Protein A agarose beads, and equal amounts of protein were incubated with streptavidin beads (ThermoFisher) at 4°C for 12 hrs. Beads were washed three times with cold lysis buffer and processed for immunoblotting as described above.
Cell-cell aggregation assay
Cells pre-treated for 24 hr with 100 nM GCs were washed in PBS and trypsinized. After neutralization, 10 mM MgCl2 and 10 μg/mL of DNase I was added to the cell suspension and incubated at 37°C for 15 min. The single cell suspension was prepared in SMEM (Invitrogen), and cells were seeded onto 12-well dishes coated with 1% (w/v) agarose and incubated on a shaker at 100 rpm. After 1 hr, cells were fixed with 4% paraformaldehyde and single cells were counted with a hemocytometer. Aggregation index was calculated using the formula, (N0 − N1)/N0, where N1 is the single cell number after the incubation time of 1 hr and N0 is the cell number at the initiation of incubation.
Wound healing assay
This was performed as described previously [14]. Cells were pre-treated with GCs for 24 hrs, and a uniform cell-free area was created and inspected regularly. At each time point, nine phase contrast images were acquired with a Leica DMIL microscope (Leica Microsystems). The distance between the two opposing edges was measured. Values represent the mean±SE of three independent experiments with 27 measurements taken for each condition at each time point in each experiment.
Transwell invasion assay
The Transwell invasion assay was performed as described previously [14]. Transwell inserts (8 μm pore) (Becton-Dickinson, Franklin Lakes, NJ) were coated with rat-tail collagen type I (BD Biosciences, Franklin Lakes, NJ). Cells were re-suspended in medium containing DMSO or drugs and seeded onto the insert. After treatment, the insert was washed, and a cotton swab dipped in trypsin was used to remove cells from the top of the insert. Cells attached to the underside were fixed and stained in crystal violet. The insert was thoroughly washed, and cell-associated crystal violet was eluted with 10% acetic acid. The quantity of cells that migrated through correlated to the absorbance of eluted crystal violet measured at 595 nm. Migration of drug-treated samples was expressed as a percent of migration compared to control vehicle-treated cells.
Immunofluorescence staining
Caki-1 cells incubated with control vehicle or GCs were fixed with 4% paraformaldehyde and then permeabilized with 0.3% TritonX-100 in PBS. Non-specific binding was blocked with goat and donkey serum and then incubated overnight at 4°C in a humidified chamber with diluted antibodies. N-Cadherin antibody was used at a dilution of 1:200 and Alexa488-conjugated phalloidin (Invitrogen, Carlsbad, CA) for 1:1,000. After washing with PBS, cells were incubated with FITC or Texas red conjugated secondary antibodies (Jackson Immunoresearch, West Grove, PA) for an hour. Coverslips were mounted with Prolong Gold antifade solution (Invitrogen, Carlsbad, CA) which contains DAPI. Images were obtained by using a confocal microscope (SP8, Leica Microsystems) with a 40x objective lens.
Animal studies
All experiments involving animals were performed in accordance with protocols reviewed and approved by the Nemours Institutional Animal Care and Use Committee. Four-week old male hairless SCID mice were obtained to conduct in vivo studies (Charles River Laboratory, Malvern, PA). Mice were housed in pathogen-free conditions with a 12 hr light/12 hr dark schedule and fed with autoclaved standard chow and water ad libitum. Mice were injected subcutaneously with 2.5 x 10⁶ cells/mouse in 0.1 mL of sterile PBS. Tumor dimensions were monitored by measurement with a caliper and by fluorescent imaging with KODAK in vivo Multispectral imaging system (Carestream Health, Rochester, NY). Orthotopic transplantation was performed as described previously [27]. Caki-1 cells expressing ptd-Tomato were trypsinized during mid-log phase of growth, pelleted, and re-suspended in rat-tail collagen prepared as described previously [28] at a density of 5,000 cells/μL. Cells were spotted onto 10 cm dishes. After the spots gelled to form cell plugs, they were overlaid with growth medium and incubated at 37°C overnight. The collagen plugs were then grafted under the renal capsule of one of the kidneys of SCID mice. Five days after graft insertion, mice were randomly assigned into 4 groups with 10 mice per group. Each group was injected i.p. with 5 mg/kg weight of TRIAM, DEX, or FLUOR in 100 μL PBS containing 2% DMSO every other day. At 38 days post-surgery, mice were sacrificed. Kidneys were removed for imaging and processed for histology.
Immunohistochemistry
Kidneys were fixed in formalin, embedded in paraffin, and 4–5 μm thick sections were mounted on slides. Slides were air dried, baked at 55°C, placed into Reveal solution (Biocare, Concord, CA), and heated at 125°C for 30 sec in a decloaking chamber (Biocare) followed by dipping in Hot Rinse solution (Biocare) at 90°C. Water was slowly added to the slides and rinsed with PBS. Endogenous peroxidase was quenched with 1% H2O2. Slides were blocked with 4% FBS in PBS. DsRed antibody (Clontech) was added to the slides and incubated overnight at 4°C in a humidified chamber. Unbound antibody was gently rinsed off slides with PBS. The MACH4 Universal Detection System (Biocare) was used to develop the slides following manufacturers’ instructions. Slides were then stained with hematoxylin and eosin. Slides were dehydrated in 100% ethanol and xylene and mounted with EcoMount. Slides were viewed under bright-field illumination with a Leica DMIL microscope (Leica Microsystems).
Analysis and scoring
Immunohistochemical staining for DsRed was used to determine localization of tumor tissue. The entire tumor boundary was scanned for invasive patches within the renal cortex. An invasive patch is defined as an area of DsRed positive cells penetrating the capsule wall. The average number of invasive patches in each treatment category was determined and plotted.
Statistical analysis
All data are expressed as means±SEs. A Student’s t-test was used to examine relationships between the control and drug treated groups. P-values of less than 0.05 were considered statistically significant. All experiments, except the in vivo studies, were repeated at least 3 times.
Results
High-throughput screen to identify small molecules that stimulate Na,K-ATPase β1-subunit promoter activity
We utilized a human cervical cancer cell line (HeLa) widely used in high-throughput screening (HTS) studies [29, 30] to create a cell-based gene reporter assay to identify compounds that enhance NaK-β1 gene expression. HeLa cells stably harboring a construct containing the firefly luciferase gene under the control of the NaK-β1 promoter (H1141β-Luc) were used to probe the small molecule library. Prior to screening, the assay conditions were optimized and validated to ensure that the assay can distinguish between true sample signals versus background noise. We achieved a Z’-factor of 0.5, which is considered reliable for such assays [31]. DMSO and DEX was included in each assay plate as negative and positive controls, respectively. An overwhelming majority of the compounds identified in the HTS were glucocorticoids (GCs) (S1 Table). We focused on GCs, since many of them are already FDA approved therapeutics for a broad array of pathologic conditions.
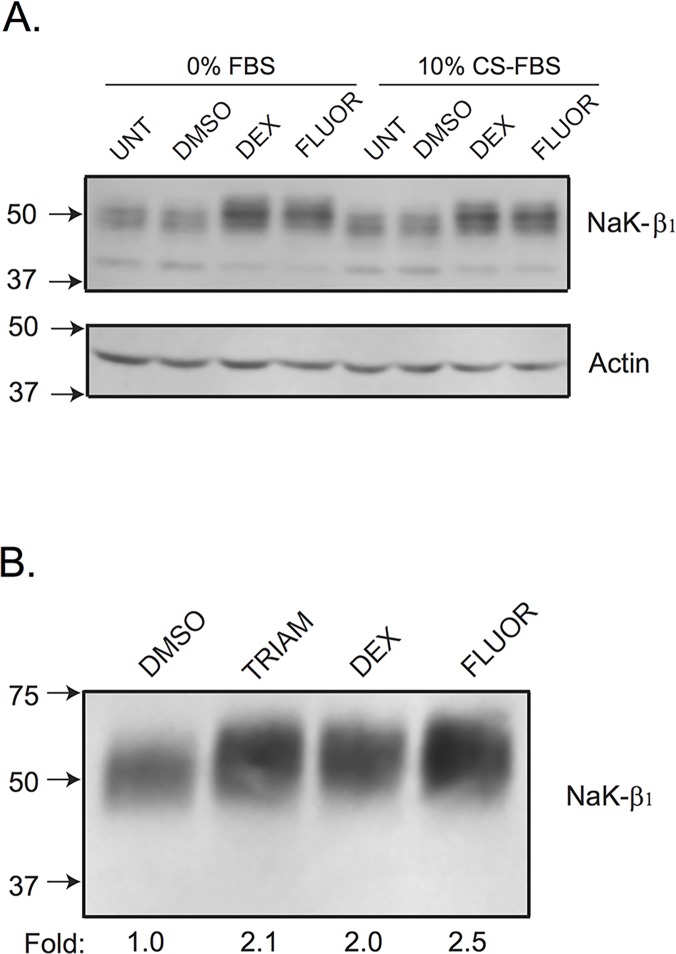
Triamcinolone (TRIAM) and fluorometholone (FLUOR) were further studied based on their solubility and strength of induction of NaK-β1 promoter activity compared to DEX (S1 Table). Compounds identified by HTS were verified by dosing studies, which demonstrated a dose-dependent increase in NaK-β1 promoter activity with increasing drug concentrations in HeLa cells (Fig 1). Next, we assessed if NaK-β1 protein levels were augmented with drug treatment by immunoblot analysis. With the addition of drugs, NaK-β1 expression was elevated in serum free as well as in charcoal-stripped serum (CS) (Fig 2A). Furthermore, the increased NaK-β1 was properly targeted to the cell membrane as assessed by a cell surface biotinylation assay (Fig 2B).
Fig 1. Steroidal drugs enhance NaK-β1 promoter activity.
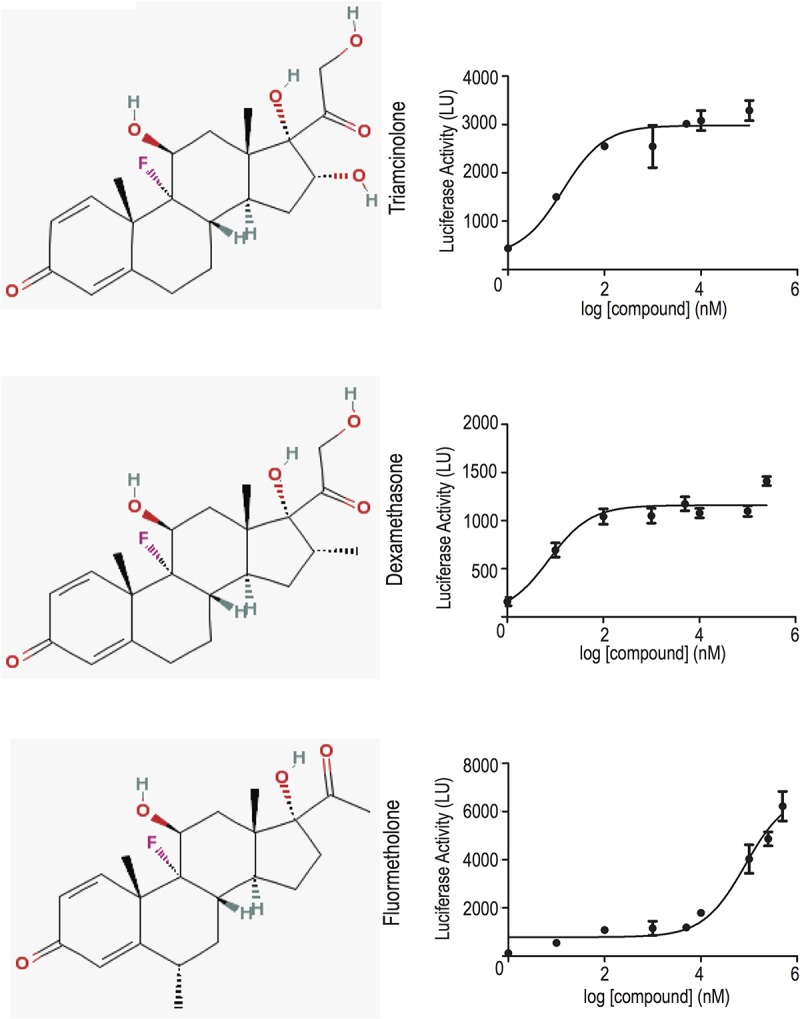
Compounds were tested at 1 nM to 250 μM and the luciferase activity was measured in light units (LU). There is a clear dose-dependent response in TRIAM, DEX, and FLUOR exposed HeLa cells.
Fig 2. Validation of the small molecule candidates in HeLa cells.
(A) Immunoblot confirmation of NaK-β1 up-regulation in the presence or absence of drugs. HeLa cells were treated with DEX or FLUOR in the presence or absence of charcoal-stripped serum. The compounds produced a similar degree of NaK-β1 induction regardless of serum content. Additionally, the control vehicle, DMSO, did not alter NaK-β1 expression compared to untreated cells. (B) HeLa cells were treated with 10 μM TRIAM, DEX, or FLUOR for 24 hr and a cell surface biotinylation assay was performed to elucidate the amount of NaK-β1 at the cell surface. A representative blot from three independent experiments confirm the localization of NaK-β1 at the cell exterior with compound treatment compared to DMSO treated cells.
Validation of GCs mediated induction of NaK-β1 expression in renal clear cell carcinoma cells
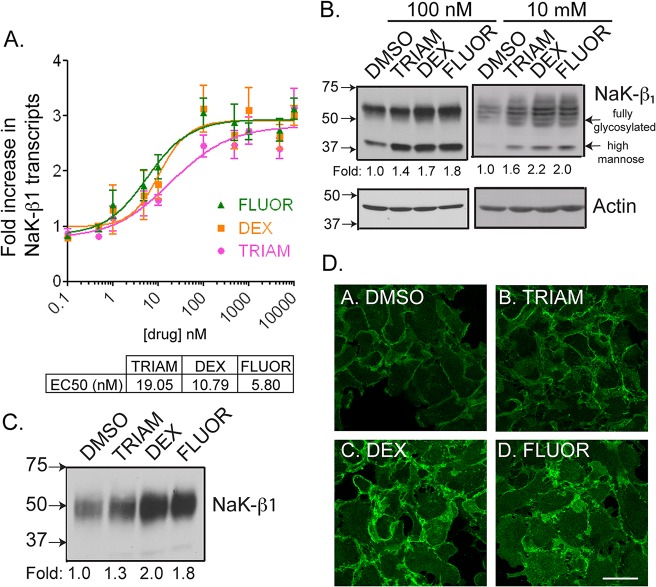
Caki-1, a renal clear cell carcinoma (RCC) cell line that has been extensively used for studies on RCC [32, 33], was used to characterize the function of the drugs in RCC. We determined whether the identified compounds exert their effects at the transcriptional level. Quantitative-PCR analysis showed that GCs increased NaK-β1 mRNA levels in a dose-dependent manner. TRIAM, DEX, and FLUOR enhanced NaK-β1 gene expression with EC50s of 19.05, 10.79, and 5.80 nM, respectively (Fig 3A). 100 nM and 10 μM concentrations were used for further studies because these concentrations are within the range applied clinically [34, 35].
Fig 3. GC compounds elevate NaK-β1 expression in kidney cancer cells.
(A) NaK-β1 transcript levels were determined by Q-PCR and expressed as a fold change over DMSO-treated cells. Drugs induced a dose-dependent increase in NaK-β1 transcripts. Data represents the mean±SE of 3 independent experiments performed in quadruplicates. (B) Immunoblot analysis showing NaK-β1 levels in Caki-1 cells treated with DMSO or GCs. Actin confirmed equal loading of protein. (C) All three drugs induced increased NaK-β1 at the plasma membrane at 100 nM and 10 μM in a cell-surface biotinylation assay. (D) Immunostaining of NaK-β1 (green) in Caki-1 drug treated cells imaged by confocal microscopy. TRIAM (panel B), DEX (panel C), and FLUOR (panel D) exhibited more intense NaK-β1 staining both intracellularly and at the cell surface compared to DMSO (panel A) treated cells. Note the thicker staining along the cell-cell contacts. Scale bar represents 20 μm.
Na,K-ATPase protein levels in DMSO- and GC-treated cells were analyzed by immunoblotting. TRIAM, DEX, and FLUOR enhanced NaK-β1 expression in Caki-1 cells (Fig 3B). Cell surface biotinylation of Caki-1 cells treated with TRIAM, DEX, and FLUOR revealed 1.3±0.1, 2.0±0.1, and 1.8±0.1-fold enhanced NaK-β1 expression at the plasma membrane, respectively, compared to DMSO-treated cells (Fig 3C). The enhanced cell surface expression of NaK-β1 was also confirmed by immunofluorescence (Fig 3D). In summary, GCs induced NaK-β 1 expression both at the transcript and protein levels in Caki-1 cells.
GCs increased cell-cell adhesion and reduced the motility and invasiveness of kidney cancer cells
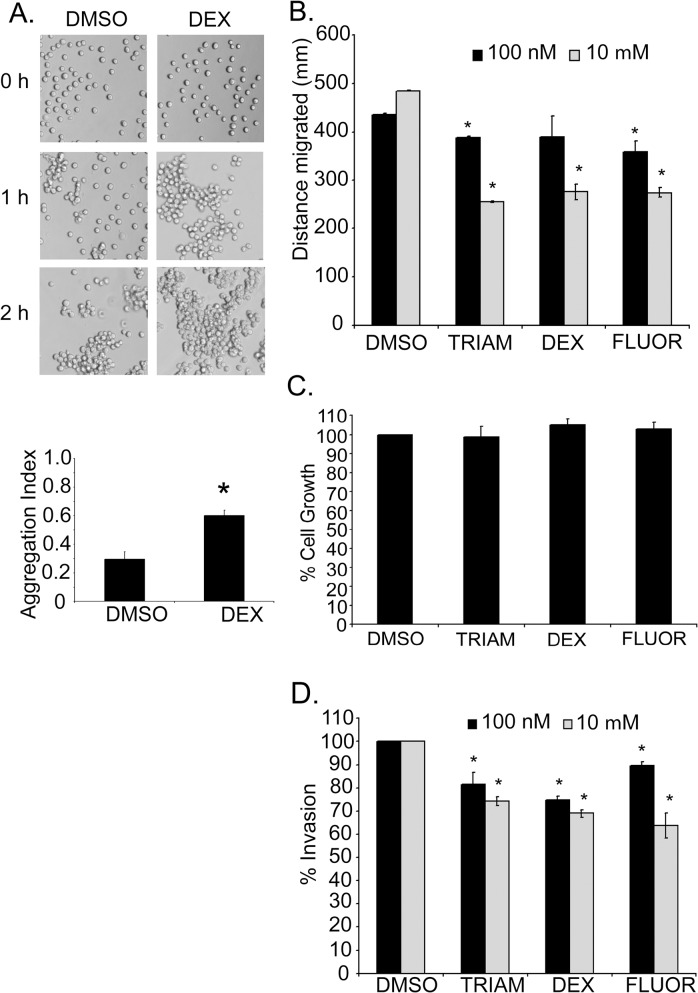
Previously, our laboratory and others have shown that NaK-β 1 mediates cell-cell adhesion [11, 12, 15–17, 22, 36]. We tested the ability of GCs to alter cellular adhesion in vitro. After 24 hr, DEX-treated cells displayed more cell-cell cohesion, produced larger cell clusters, and revealed a two-fold increase in the aggregation index compared to DMSO-treated cells (p-value = 0.0086) (Fig 4A).
Fig 4. GCs enhanced cell-cell aggregation and reduced the motility and invasiveness of kidney cancer cells.
(A) Phase contrast images of a cell-cell aggregation assay showing the ability of GCs to enhance cohesion of cells. The graph represents the mean of three independent experiments performed in quadruplicate wells ±SE. (B) The distance migrated by cells pre-treated with DMSO or GCs in a wound healing assay after 24 hr. The data represent the mean±SE of three independent experiments. Asterisk indicates p-value <0.05 by Student’s t-test comparing DMSO versus drug treatment. (C) The reduction of Caki-1 migration by drug treatment was not a result of changes in cell proliferation as shown by an MTT assay. This was performed in three independent experiments with 12 wells per condition. The graph is from a single representative experiment with bars representing the mean±SE. (D) A Transwell invasion assay showing the invasive capacity of Caki-1 cells through collagen coated inserts at 24 hr. Data represent means±SE of three independent experiments performed in duplicate wells. Asterisk indicates significant p-value < 0.05 by Student’s t-test.
Several reports have demonstrated that NaK-β 1 reduces tumor cell migration and invasiveness [14, 22, 37]. The migration of Caki-1 cells treated with 100 nM TRIAM, DEX, or FLUOR was reduced compared to DMSO-treated controls (389.2±1.0 μm, p-value = 0.000031; 404.4±28.2 μm, p-value = 0.326; and 363.8±14.4 μm, p-value = 0.0077; respectively, compared to 436.0±2.0 μm) (Fig 4B). The effect of 10 μM TRIAM, DEX, and FLUOR was greater (255.5±1.97, 275.9±16.1, 274.4±9.7 μm, respectively, compared to 458.8±1.6 μm) (Fig 4B). A cell viability assay showed that treatment of cells for 24 hr with the drugs did not alter the viability compared to DMSO controls (Fig 4C). Thus, the difference in migration distance between DMSO- and GC-treated cells is not a consequence of changes in cell growth.
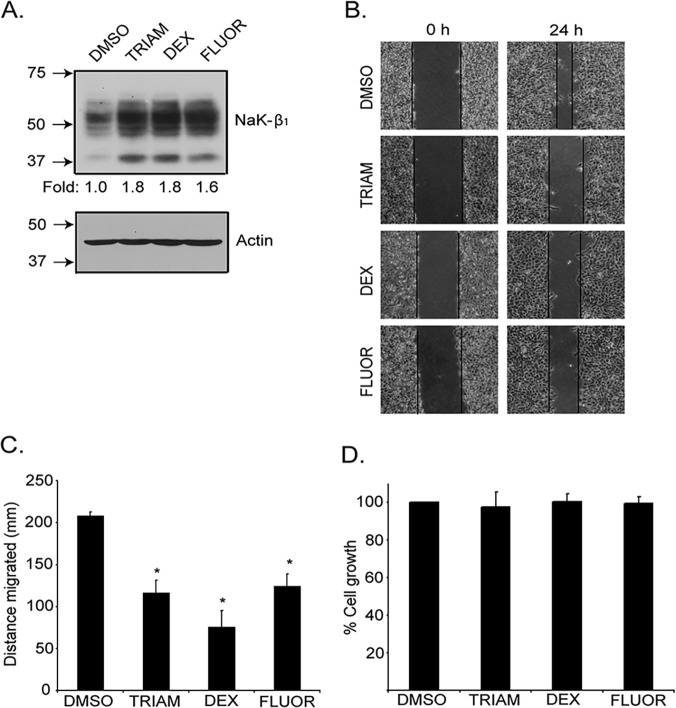
A Transwell invasion assay with TRIAM, DEX, and FLUOR (100 nM) treatment reduced the percentage of invading Caki-1 cells to 81.5±5.2% (p-value = 0.069), 74.8±1.7% (p-value = 0.0047), and 89.7±1.5% (p-value = 0.020) respectively, compared to DMSO controls (Fig 4D). At 10 μM TRIAM, DEX and FLUOR the invasiveness was further reduced (74.3±1.9%, p-value = 0.0027; 69.0±1.7%, p-value = 0.000053; and 63.8±5.4%, p-value = 0.00018, respectively). The ability of the drugs to enhance NaK-β 1 and reduce motility was confirmed in another human RCC cell line, UMRC6. Treatment of UMRC6 cells increased protein expression of Na,K-β1 by 1.6–1.8-fold (Fig 5A). This was accompanied by a reduction in cell migration after 24 hr drug treatment (Fig 5B and 5C). The reduction of cell migration was not due to alterations in UMRC6 growth, since a MTT assay showed that cell growth was similar in control vehicle and drug treated cells over this time period (Fig 5D). Taken together, these results confirm that GCs enhance NaK-β1 expression and reduce cancer cell motility and invasion in kidney cancer cells.
Fig 5. The anti-tumor effects were reproduced in UMRC6 cells.
(A) The small molecule drugs were effective in up-regulating NaK-β1 protein levels in the human renal clear cell carcinoma line, UMRC6, as observed in the immunoblot. (B) Additionally, the drugs were efficacious in reducing the motility of UMRC6 cells as demonstrated by the wound healing assay. Drug treated cells migrated a shorter distance. (C) Quantification of the wound healing indicates that the compounds reduced the distance migrated. (D) The attenuation in motility was not due to changes in the rate of cell growth, since DMSO and drug treated cells grew comparably as revealed by a MTT assay.
GCs function through NaK-β1 to enhance cell-cell aggregation and reduce invasion
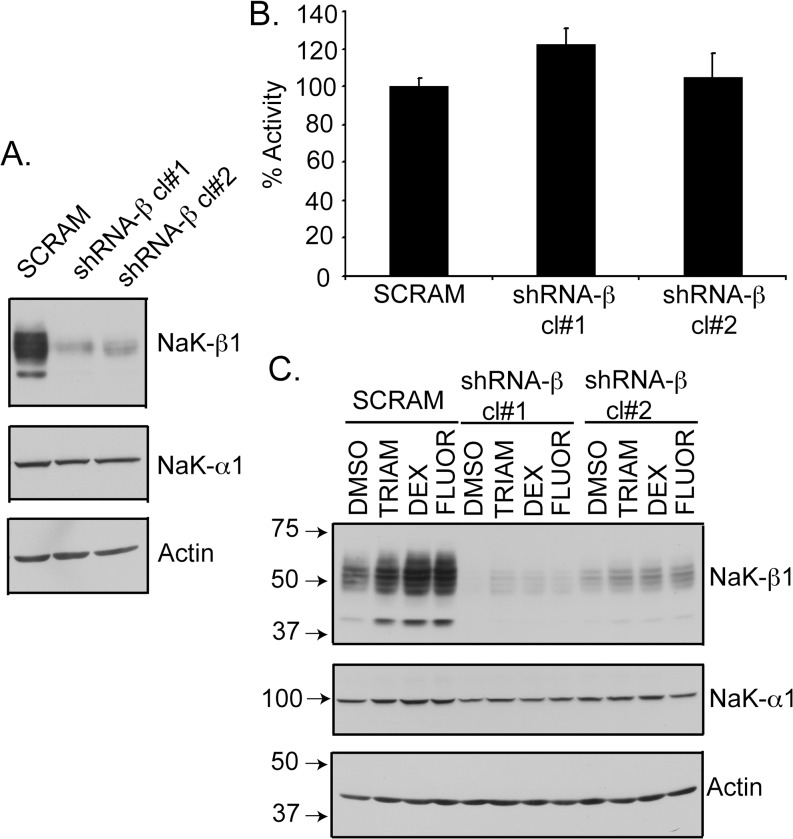
Since GCs may mediate anti-tumor effects through multiple mechanisms, we determined whether the enhanced cell-cell aggregation and reduced invasion by these drugs is mediated through NaK-β1 up-regulation. We generated a NaK-β1 knockdown (shRNA-β) Caki-1 cell line that exhibited 80–90% reduction in NaK-β1 (Fig 6A) [18, 24]. Strikingly, the level of NaK-α1 and the pump activity did not change significantly in these cell lines (Fig 6B). Furthermore, we tested the ability of the compounds to restore NaK-β1 expression in the knockdown clones. All three GCs induced NaK-β1 expression in shRNA-β clones, but expression levels remained below that present in parental or scrambled shRNA transfected cells (Fig 6C).
Fig 6. Characterization of shRNA-β clones.
(A) Immunoblots showing the levels of NaK-β1 and NaK-α1 in Caki-1 cells stably transfected with scrambled shRNA (SCRAM) or shRNA against NaK-β1 (shRNA-β). Two clones (cl#1 and cl#2) were further studied. Actin was used as a loading control. (B) Rubidium uptake assay showing Na,K-ATPase pump activity was comparable in SCRAM and shRNA-β cells. (C) Cells were treated with TRIAM, DEX, or FLUOR, and NaK-β1 and NaK-α1 expression was evaluated by immunoblotting.
A cell-cell aggregation assay revealed that DEX-treated Caki-1 cells produced larger cell aggregates compared to vehicle-treated cells. The shRNA-β knockdown cells were mostly mono-dispersed with occasional clusters at 2 hr (Fig 7A). DEX did not induce aggregation in either clone of shRNA-β cells (Fig 7A).
Fig 7. GCs are less effective on NaK-β1 knockdown cells.
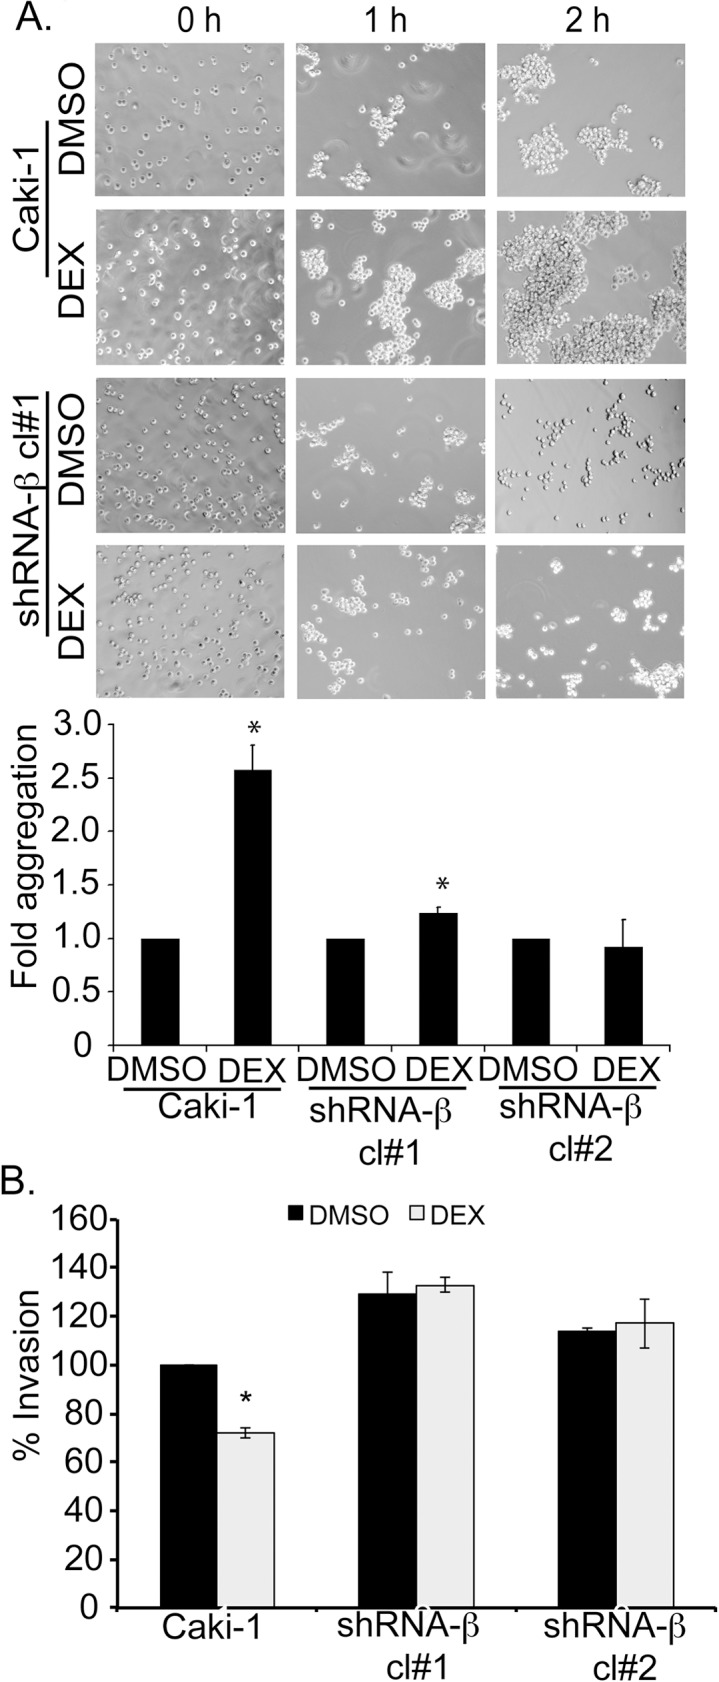
(A) Cells were pre-treated with DEX and cell aggregation was assessed. Phase contrast images were acquired to depict the extent of cell-aggregation. The extent of cell-cell aggregation was quantified at 1 hr post-shaking and DEX treated conditions were expressed as a fold of DMSO treated samples. Asterisk indicates p-value was < 0.05. (B) Transwell invasion assay showing the relative invasiveness of Caki-1 and shRNA-β cells in the presence or absence of DEX pre-treatment. The invasion exhibited by DMSO was considered 100% for each cell line. The graph represents the mean±SE from three independent experiments (p-value < 0.05).
To assess whether GCs mediate anti-invasive effects through NaK-β1, we determined the extent of cell invasion through collagen-coated filters in Caki-1 parental and shRNA-β cells. In the presence of 100 nM DEX, the invasion of Caki-1 cells was reduced to 75±1.7% of DMSO-treated cells (Fig 7B). In contrast, shRNA-β cells, in which DEX was not effective at up-regulating NaK-β1 expression, displayed no reduction in invasion (Fig 7B). We have shown previously that cell invasiveness was inversely proportional to NaK-β1 levels [14, 22]. As expected, untreated shRNA-β cells were more invasive than the parental cells. Taken together, these results demonstrate that GCs mediate suppression of invasiveness through the up-regulation of NaK-β1.
GCs induce MET like phenotype in Caki-1 cells
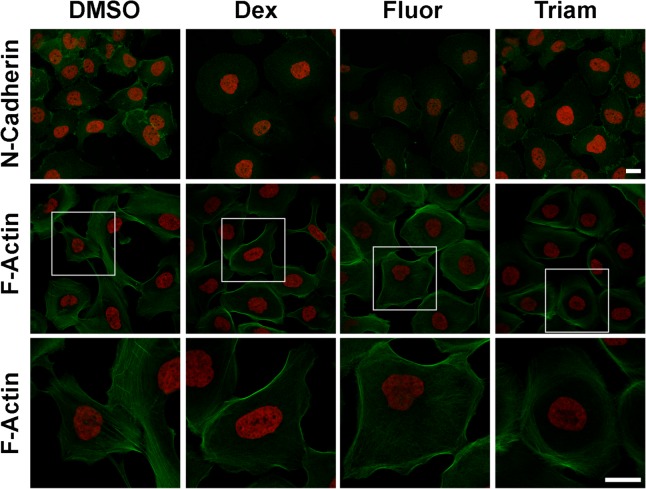
We have shown earlier that NaK-β1 expression is reduced during TGF-β induced EMT [18]. Carcinoma cell lines which have lost their epithelial phenotype also revealed reduced levels of NaK-β1 [9]. In addition, knockdown of NaK-β1 in Caki-1 cells induced mesenchymal phenotype which was accompanied by enhanced expression of fibronectin and smooth muscle actin which are markers upregulated during EMT [18]. Since NaK-β1 levels are inversely correlated with the acquisition of EMT, we reasoned that upregulated NaK-β1 expression by GCs might suppress the EMT phenotype. Consistent with this notion, GC treated cells showed enhanced cell to cell contact and revealed a more compact epithelial phenotype (Fig 8). Immunofluorescence analysis of N-cadherin, a mesenchymal marker which is upregulated during EMT was reduced by GC treatment. Invasive carcinoma cells show extensive stress fibers which is essential for their invasiveness and motility. GC treated Caki-1 cells showed drastically reduced stress fibers and increased cortical actin networks (Fig 8). These results suggest that GCs induce MET like phenotype in RCC cells.
Fig 8. GCs promoted mesenchymal-to-epithelial transition of kidney cancer cells.
Representative images of Caki-1 cells treated with GCs. Serum starved cells were treated with 10 μM GCs for three days and then immunostained. Staining of N-Cadherin (green) is shown with DAPI (red). F-Actin was stained with Alexa 488-conjugated phalloidin along with DAPI. Magnified images of the regions marked by white boxes are shown at the bottom. Scale bars represent 20 μm.
GCs suppress tumor growth and invasiveness in vivo
To study the effect of GCs on RCC tumor growth, Caki-1 cells expressing ptd-Tomato Red were generated and subcutaneously injected into SCID mice. Tumor growth was monitored by in vivo imaging and calipers. After 25 days, tumor volumes were strikingly smaller in the mice administered with any of the three drugs compared to vehicle treatment (Fig 9A and 9B). TRIAM and DEX slowed tumor growth, but did not completely prevent tumor growth over the 25 day period (Fig 9B). In contrast, FLUOR-treated mice displayed minimal tumor growth. On day 25, the tumor volume in TRIAM, DEX, and FLUOR-treated mice was smaller than the control (DMSO) group (70.6±15.7 mm3 (p-value = 0.20), 79.2±15.2 mm3 (p-value = 0.22), 44.2±6.0 mm3 (p-value = 0.02), respectively, compared to 140.0±14.7 mm3 for DMSO). Only FLUOR-treated mice showed a statistically significant effect in limiting tumor growth.
Fig 9. GCs suppress growth in a subcutaneous xenograft mouse model.
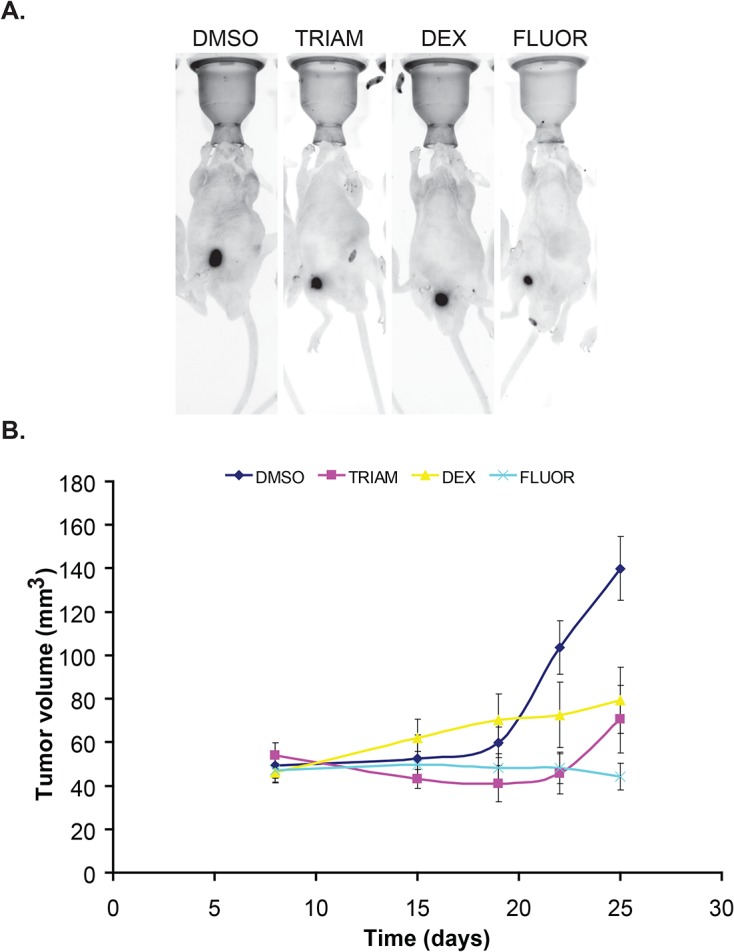
(A) Representative images of tumor-bearing mice treated with DMSO or GCs and acquired by Kodak in vivo multi-spectral imaging system are shown. (B) Tumor volume estimated by caliper measurements plotted as a function of time. Error bars denote SE of the mean (n = 5 per each group).
To test whether GCs reduce tumor invasiveness in vivo, Caki-1 cells harboring ptd-Tomato Red were embedded in collagen and orthotopically implanted into the sub-renal capsule of SCID mice. Mice were treated with 5 mg/kg of TRIAM, DEX, or FLUOR every other day and tumors were harvested after five weeks. GC-treated mice displayed tumors that were compact compared to DMSO-treated mice where the tumors were more dispersed (Fig 10A arrows). To monitor local invasiveness, we stained tumor cells in kidney sections using an antibody directed against DsRed and quantified the invasiveness. Regardless of treatment, invasion of tumor cells into the renal parenchyma was detected in mice from each group. However, DMSO-treated mice had the largest number of invasive patches where the invading cells migrated into the cortex and medullary regions (Fig 10B and 10C). TRIAM, DEX, and FLUOR-treated mice showed reduced number of invasive patches compared to DMSO (Fig 10C) (p-values for TRIAM = 0.0182, DEX = 0.005134, FLUOR = 0.027116). Taken together, these data show that TRIAM, DEX, and FLUOR limited tumor invasiveness in vivo.
Fig 10. GCs reduce local invasiveness in an orthotopic renal xenograft mouse model.
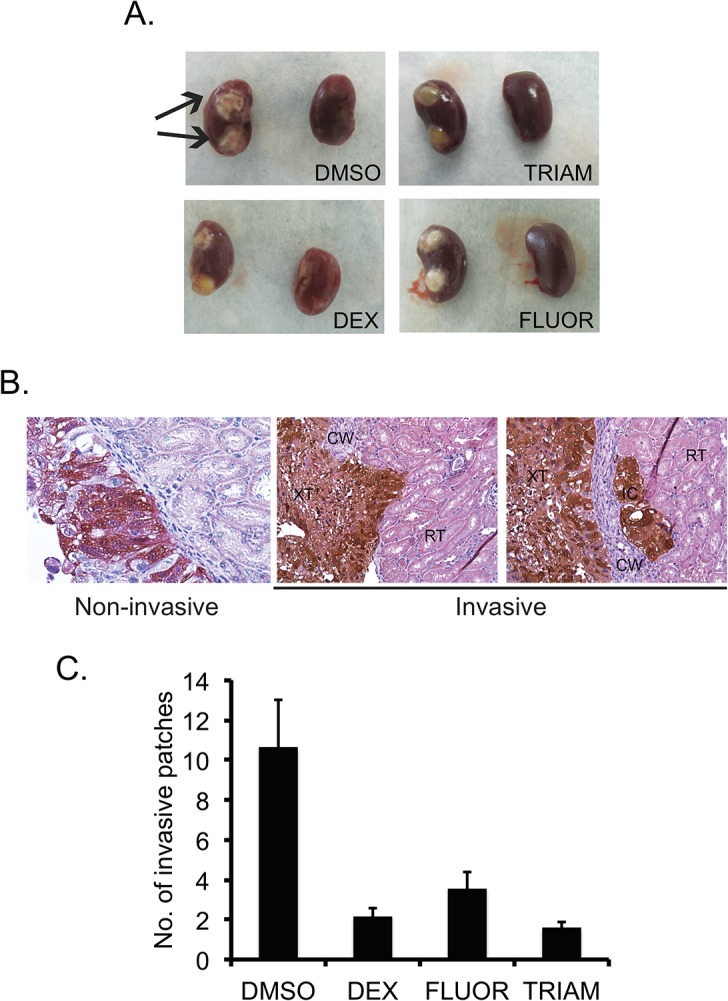
(A) Representative images of the left (with tumor implants) and right (normal) kidneys harvested from tumor-bearing mice. Arrows show compact tumors in DMSO treated mice. (B) The tumor-bearing kidneys were paraffin-embedded and sectioned. The sections were stained for antibodies against DsRed to visualize tumor cells (brown). Representative images showing invasive (DMSO treated) and non-invasive (DEX treated) patches are shown. (C) The graph shows the average number of invasive patches. Error bars denote SE of the mean (n = 8). Magnification 600X
Discussion
The major clinical use of GCs in cancer therapy has largely been a supportive one to reduce the side effects associated with cytotoxic chemotherapy. Graft versus host disease (GVHD) is a common and occasionally life-threatening side effect of bone marrow and stem cell transplants in patients, and GCs are also used to control GVHD. Steroid medications are particularly helpful in people who have spinal cord compression pain and nerve pain, which is common in patients with multiple myeloma. While GCs are not usually used alone, they are very effective and often lower the need for other pain medications. In addition to their palliative role, GCs are part of the standard treatment regimen for hematological malignancies. Dexamethasone is also used to treat patients with hormone refractory prostate cancer that has metastasized. Despite these multiple uses of GCs in the clinic, the mechanism by which GCs control tumor growth is not known. In this study, for the first time, we provide mechanistic evidence that GCs suppress RCC tumor growth and invasion by up-regulating the expression of a cell-adhesion molecule, Na,K-ATPase β1-subunit and suppressing expression of molecular markers associated with EMT.
In our high-throughput screen, a majority of the hit compounds identified were GCs, suggesting these are key regulators of NaK-β1 expression. Regulation of NaK-β1 expression by GCs, including TRIAM and DEX, occurs through the glucocorticoid receptor and/or mineralcorticoid receptor, which bind to cis elements in the NaK-β1 promoter to stimulate expression [5, 38–41]. However, the effect of FLUOR on NaK-β1 expression has not been studied. In agreement with the transcriptional regulation of NaK-β1 by GCs, we observed stimulation of the NaK-β1 promoter activity and increased transcripts in a dose-dependent manner, which correlated with increased protein. Previous reports have indicated that corticosteroids induce synthesis of NaK-β1, but the ability of these compounds to enhance the anti-tumor effects of NaK-β1 expression has not been tested. This reflects the discovery of corticosteroid effects on NaK-β1 expression, which occurred well before the tumor suppressor functions of NaK-β1 were identified.
We show that GCs increased surface expression of NaK-β1 resulting in enhanced cell-cell adhesion and suppressed cell motility and invasion. These effects are likely specific to GC mediated up-regulation of NaK-β1 since shRNA-β cells treated with GCs showed less cell-cell adhesion and were more motile compared to untreated parental cells. If GCs induced the cellular effects through NaK-β1 independent mechanisms, then the GCs should have enhanced cell-cell adhesion and suppressed the invasiveness of the shRNA-β cells.
RCC cells express E-cadherin, a calcium-dependent cell adhesion molecule and an invasion suppressor in epithelial cells. GCs did not increase the expression levels of E-cadherin (data not shown). Moreover the cell adhesion and invasion assays were performed under calcium-free conditions and treatment of cells with trypsin cleaves the extracellular domain of E-cadherin. Therefore, the increased aggregation and reduced invasion observed in GC-treated cells are likely due to enhanced expression of NaK-β1.
We confirmed that the GCs enhanced cell adhesion and suppressed of invasion in two well-characterized RCC cell lines. Our in vivo data suggests that GCs reduce growth and invasiveness of RCC tumors. Although all three GCs suppressed growth of tumors, FLUOR was the most and DEX the least effective in growth suppression in vivo. DEX suppressed growth of OUR-10, a RCC cell line, both in vivo and in vitro [42]. However, in our study, GCs did not suppress growth of RCC cells in vitro. This might be attributed to the fact that in vitro cells are exposed to the drug for a few days, whereas treatment in vivo occurred over several weeks. The prolonged and sustained exposure may be required to see inhibitory effects on tumor growth. It’s also possible that mechanisms which modulate growth regulation by GCs in vitro and in vivo are distinct. GCs may alter the tumor microenvironment in vivo to decrease tumor size. Using three different renal cell carcinoma cell lines, one group showed that treatment of cells in vitro and in vivo inhibited tumor growth through a possible mechanism involving inhibition of NF-kB and expression of its downstream products interleukin-6 (IL-6), interleukin-8 (IL-8), and vascular endothelial growth factor (VEGF) [40]. Since GCs bind to the glucocorticoid receptor, a transcriptional activator and repressor with multiple well-known targets, we cannot rule out the possibility that the observed anti-tumor effects are due solely to up-regulation of Na,K-β1. We did not measure levels of IL-6, IL-8, or VEGF, but we expect that they would be similarly decreased in tumor treated cells. As Arai et al. mentioned in their study, this may be a reason why we also did not observe a reduction of growth in vitro, but we did see dramatic changes in vivo [40]. In particular, the loss of IL-8 and VEGF would decrease tumor growth by limiting angiogenesis and neovascularization in vivo.
Our sub renal capsule xenograft model facilitated study of local invasiveness in vivo. Invasion was most effectively suppressed by TRIAM, whereas FLUOR was the least effective and DEX was intermediate. This result suggests that mechanisms which modulate in vivo growth and invasive properties of tumor cells are different. Future experiments are necessary to understand these mechanisms. These in vitro and in vivo observations demonstrate the proof of principle that elevation of NaK-β1 with GCs attenuates RCC tumor progression.
We showed earlier that an ovarian carcinoma sub-line (A2780/C10B) resistant to oxaliplatin has significantly reduced levels of NaK-β1 compared to non-resistant lines. Re-expression of NaK-β1 into this sub-line enhanced uptake of oxaliplatin and restored the sensitivity of these cells to oxaliplatin [43]. In this adjuvant setting, GC-stimulated up-regulation of NaK-β1 may play a dual role in suppressing tumor progression and enhancing the uptake of cytotoxic therapies. Combination therapies may be an interesting avenue to pursue, since the GCs in our study had a minimal oncolytic effect, which is in agreement with several published reports [44, 45]. Several reports have already noted GCs can potentiate or enhance the therapeutic effects of cisplatin and gemcitabine in different cancers, though the mechanism is not completely understood [46, 47]. It is plausible that the enhanced drug uptake is due to augmentation of NaK-β1. Future studies will address these possibilities.
The potential value of the steroids identified in the HTS in the setting of metastatic RCC has not been adequately studied. To our knowledge, the use of FLUOR and TRIAM in the treatment of renal cell carcinoma has been unexplored. In contrast, there have been a few case reports on the use of DEX in treatment of RCC. For example, it was shown that a patient diagnosed with poorly differentiated RCC showed a significant clinical response to DEX monotherapy. The patient did not receive any other systemic treatment or medication, but yet showed a size reduction of the primary kidney tumor along with a reduction in metastatic deposits in the lung, liver, and spleen [47]. There have been other case studies showing partial or complete regression of RCC when using other steroids identified in the HTS. For example, a group in Japan reported the complete regression of metastatic renal cell carcinoma following betamethasone treatment [48]. Another case study reported a patient with a 10-year complete remission of metastatic renal cell carcinoma undergoing prednisone monotherapy [46]. A recent study demonstrated that GCs suppress the invasion and migration of malignant glioblastoma cells in vitro [48]. GCs can also inhibit TGF-β1 induced EMT in lung epithelial cells [49] and in peritoneal mesothelial cells [50]. Here, we showed that treatment of GCs not only up-regulated NaK-β1, but also downregulated N-cadherin a marker up-regulated during EMT. In addition, actin stress fibers which are involved in the invasiveness and motility of carcinoma cells are drastically reduced in GC treated cells. These results are consistent with the notion that GCs induce MET like phenomenon and suppress EMT. It is possible that acquisition of MET like feature might have contributed to reduced tumor growth and invasiveness observed in vivo. Our data suggests a need for a re-examination of the use of GCs for the treatment of malignancies as it pertains to patients lacking NaK-β1 expression in late stages of disease. Future clinical trials are essential to validate the specific use of GCs in RCC treatments and the significance of enhanced NaK-β1 expression in the suppression of carcinoma progression.
Supporting Information
EC50 and fold activation values for each compound were determined from a single dose-response curve. Activation at each concentration was determined from three data points.
(TIF)
Acknowledgments
We thank Dr. Jerry Lingrel, University of Cincinnati, Cincinnati, OH for providing the NaK-β promoter constructs and Dr. Robert Mason for critical reading of the manuscript.
Data Availability
All data are included within the paper.
Funding Statement
Funding provided by National Institutes of Health Grants DK56216, P20GM103464 and F31CA117050. The funders had no role in study design, data collection and analysis, decision to publish, or preparation of the manuscript.
References
- 1. Jemal A, Siegel R, Ward E, Hao Y, Xu J, Thun MJ. Cancer statistics, 2009. CA Cancer J Clin. 2009;59(4):225–49. 10.3322/caac.20006 PubMed . [DOI] [PubMed] [Google Scholar]
- 2. Eble JN, Sauter G, Epstein JI, Sesterhenn IA. Pathology and genetics of tumours of the urinary system and male genital organs Lyon: IARC press; 2004. [Google Scholar]
- 3. Murphy AM, Buck AM, Benson MC, McKiernan JM. Increasing detection rate of benign renal tumors: evaluation of factors predicting for benign tumor histologic features during past two decades. Urology. 2009;73(6):1293–7. 10.1016/j.urology.2008.12.072 PubMed . [DOI] [PubMed] [Google Scholar]
- 4. Reeves DJ, Liu CY. Treatment of metastatic renal cell carcinoma. Cancer Chemother Pharmacol. 2009;64(1):11–25. 10.1007/s00280-009-0983-z PubMed . [DOI] [PubMed] [Google Scholar]
- 5. Therein AG, Blostein R. Mechanisms of sodium pump regulation. Am J Physiol Cell Physiol. 2000;279:C541–C66. [DOI] [PubMed] [Google Scholar]
- 6. Rajasekaran SA, Ball WJ, Bander NH, Liu H, Pardee JD, Rajasekaran AK. Reduced expression of B-subunit of Na,K-ATPase in human clear-cell renal cell carcinoma. J Urol. 1999;162:574–80. [PubMed] [Google Scholar]
- 7. Avila J, Leucona E, Morales M, Soriano A, Alonso T, Martin-Vasallo P. Opposite expression pattern of the human Na,K-ATPase B1 isoform in stomach and colon adenocarcinomas. Ann N Y Acad Sci. 1997;834(1):653–5. [DOI] [PubMed] [Google Scholar]
- 8. Espineda CE, Seligson DB, Ball WJ, Rao J, Paoltie A, Horvath S, et al. Analysis of the Na,K-ATPase alpha and beta-subunit expression profiles of bladder cancer using tissue microarrays. Cancer. 2003;97(8):1859–68. [DOI] [PubMed] [Google Scholar]
- 9. Espineda CE, Chang JH, Twiss J, Rajasekaran SA, Rajasekaran AK. Repression of Na,K-ATPase beta1-subunit by the transcription factor snail in carcinoma. Mol Biol Cell. 2004;15(3):1364–73. 10.1091/mbc.E03-09-0646 PubMed [DOI] [PMC free article] [PubMed] [Google Scholar]
- 10. Bab-Dinitz E, Albeck S, Peleg Y, Brumfeld V, Gottschalk KE, Karlish SJD. A C-terminal lobe of the B-subunit of Na,K-ATPase and H,K-ATPase resembles cell adhesion molecules. Biochemistry. 2009;48:8684–91. 10.1021/bi900868e [DOI] [PubMed] [Google Scholar]
- 11. Barwe SP, Kim S., Rajasekarna S.A., Bowie J.U., and Rajasekaran A.K. Janus model of the Na,K-ATPase B-subunit transmembrane domain: distinct faces mediate alpha/beta assembly and beta-beta homo-oligomerization. JMB. 2007;365:706–14. [DOI] [PMC free article] [PubMed] [Google Scholar]
- 12. Inge LJ, Rajasekaran SA, Yoshimoto K, Mischel PS, McBride W, Landaw E, et al. Evidence for a potential tumor suppressor role for the Na,K-ATPase B-subunit. Histol Histopathol. 2008;23:459–67. [DOI] [PMC free article] [PubMed] [Google Scholar]
- 13. Kitamura N, Ikekita M, Sato T, Akimoto Y, Hatanaka Y, Kawakami H, et al. Mouse Na,K-ATPase B1-subunit has a K dependent cell adhesion activity for B-glcNAc-terminating glycans. PNAS. 2005;102(8):2796–801. [DOI] [PMC free article] [PubMed] [Google Scholar]
- 14. Rajasekaran SA, Palmer L.G., Quan K., Harper J.F., Ball W.J., Bander N.H., Peralta Soler A., and Rajasekaran A.K. Na,K-ATPase B-subunit is required for epithelial polarization, suppression of invasion, and cell motility. Mol Cell Biol. 2001. b;12:279–95. [DOI] [PMC free article] [PubMed] [Google Scholar]
- 15. Shoshani L, Contreras RG, Roldan ML, Moreno J, Lazaro A, Balda MS, et al. The polarized expression of Na,K-ATPase in epithelia depends on the association between B-subunits located in neighboring cells. Mol Biol Cell. 2005;16:1071–81. [DOI] [PMC free article] [PubMed] [Google Scholar]
- 16. Vagin O, Tokhtaeva E, Sachs G. The role of B-subunit of the Na,K-ATPase and its glycosylation in cell-cell adhesion. J Biol Chem. 2006;281(51):39573–87. [DOI] [PubMed] [Google Scholar]
- 17. Rajasekaran SA, Palmer L.G., Soon S.Y., Peralta Soler, A., Apodaca G.L., Harper J.F., Zheng Y., and Rajasekaran A.K. Na,K-ATPase activity is required for formation of tight junctions, desmosomes, and induction of polarity in eptihelial cells. Mol Biol Cell. 2001. a;12(12):3717–32. [DOI] [PMC free article] [PubMed] [Google Scholar]
- 18. Rajasekaran SA, Huynh T.P., Wolle D.G., Espineda C.E., Inge L.J., Skay A., Lassman C., Nicholas S.B., Harper J.F., Reeves A.E., Ahmed M.M., Leatherman J.M., Mullin J.M., and Rajasekaran A.K. Na,K-ATPase subunits as markers for epithelial-mesenchymal transition in cancer and fibrosis. Mol Cancer Ther. 2010;9(6):1515–24. 10.1158/1535-7163.MCT-09-0832 [DOI] [PMC free article] [PubMed] [Google Scholar]
- 19. Hanahan D, Weinberg RA. The hallmarks of cancer. Cell. 2000;100(1):57–70 PubMed . [DOI] [PubMed] [Google Scholar]
- 20. Selvakumar P, Owens TA, David JM, Petrelli NJ, Christensen BC, Lakshmikuttyamma A, et al. Epigenetic silencing of Na,K-ATPase beta 1 subunit gene ATP1B1 by methylation in clear cell renal cell carcinoma. Epigenetics: official journal of the DNA Methylation Society. 2014;9(4):579–86. 10.4161/epi.27795 PubMed [DOI] [PMC free article] [PubMed] [Google Scholar]
- 21. Baylin SB, Ohm JE. Epigenetic gene silencing in cancer—a mechanism for early oncogenic pathway addiction? Nature reviews Cancer. 2006;6(2):107–16. 10.1038/nrc1799 PubMed . [DOI] [PubMed] [Google Scholar]
- 22. Barwe SP, Anilkumar G, Moon SY, Zheng Y, Whitelegge JP, Rajasekaran SA, et al. A novel role for Na,K-ATPase in phosphatidylinositol 3-kinase signaling and suppresion of cell motility. Mol Biol Cell. 2005;16:1082–94. [DOI] [PMC free article] [PubMed] [Google Scholar]
- 23. Gorospe M, Egan JM, Zbar B, Lerman M, Geil L, Kuzmin I, et al. Protective function of von Hippel-Lindau protein against impaired protein processing in renal carcinoma cells. Mol Cell Biol. 1999;19(2):1289–300 PubMed [DOI] [PMC free article] [PubMed] [Google Scholar]
- 24. Barwe SP, Skay A, McSpadden R, Huynh TP, Langhans SA, Inge LJ, et al. Na,K-ATPase beta-subunit cis homo-oligomerization is necessary for epithelial lumen formation in mammalian cells. Journal of cell science. 2012;125(Pt 23):5711–20. Epub 2012/10/19. 10.1242/jcs.108795 PubMed [DOI] [PMC free article] [PubMed] [Google Scholar]
- 25. Abbott A, Ball WJ Jr. The epitope for the inhibitor antibody M7-PB-E9 contains Ser-646 and Asp-652 of sheep Na,K-ATPase alpha-subunit. Biochemistry. 1993;32(13):3511–8. [DOI] [PubMed] [Google Scholar]
- 26. Sun Y, Ball WJ Jr. Determination of Na(+)-K(+)-ATPase alpha- and beta-isoforms and kinetic properties in mammalian liver. Am J Physiol. 1992;262(6 Pt 1):C1491–9 PubMed . [DOI] [PubMed] [Google Scholar]
- 27. Hayward SW, Haughney PC, Lopes ES, Danielpour D, Cunha GR. The rat prostatic epithelial cell line NRP-152 can differentiate in vivo in response to its stromal environment. The Prostate. 1999;39(3):205–12. Epub 1999/05/20 PubMed . [DOI] [PubMed] [Google Scholar]
- 28. Hayward SW, Haughney PC, Rosen MA, Greulich KM, Weier HU, Dahiya R, et al. Interactions between adult human prostatic epithelium and rat urogenital sinus mesenchyme in a tissue recombination model. Differentiation; research in biological diversity. 1998;63(3):131–40. Epub 1998/08/11. 10.1046/j.1432-0436.1998.6330131.x PubMed . [DOI] [PubMed] [Google Scholar]
- 29. DeMoe JH, Santaguida S, Daum JR, Musacchio A, Gorbsky GJ. A high throughput, whole cell screen for small molecule inhibitors of the mitotic spindle checkpoint identifies OM137, a novel Aurora kinase inhibitor. Cancer Res. 2009;69(4):1509–16. 10.1158/0008-5472.CAN-08-3133 PubMed [DOI] [PMC free article] [PubMed] [Google Scholar]
- 30. Kamata K, Wu RP, An DS, Saxe JP, Damoiseaux R, Phelps ME, et al. Cell-based chemical genetic screen identifies damnacanthal as an inhibitor of HIV-1 Vpr induced cell death. Biochem Biophys Res Commun. 2006;348(3):1101–6. [DOI] [PMC free article] [PubMed] [Google Scholar]
- 31. Zhang Q, Feng W, Zhou H, Yan B. Advances in preclinical small molecules for the treatment of NSCLC. Expert Opin Ther Pat. 2009;19(6):731–51. 10.1517/13543770902967674 PubMed . [DOI] [PubMed] [Google Scholar]
- 32. Siemann DW, Brazelle WD, Jurgensmeier JM. The vascular endothelial growth factor receptor-2 tyrosine kinase inhibitor cediranib (Recentin; AZD2171) inhibits endothelial cell function and growth of human renal tumor xenografts. Int J Radiat Oncol Biol Phys. 2009;73(3):897–903. 10.1016/j.ijrobp.2008.10.031 PubMed [DOI] [PMC free article] [PubMed] [Google Scholar]
- 33. Xu J, Kochanek KD, Tejada-Vera B. Deaths: preliminary data for 2007. National vital statistics reports [Internet]. 2009; 58(1). [PubMed] [Google Scholar]
- 34. Brady ME, Sartiano GP, Rosenblum SL, Zaglama NE, Bauguess CT. The pharmacokinetics of single high doses of dexamethasone in cancer patients. Eur J Clin Pharmacol. 1987;32(6):593–6 PubMed . [DOI] [PubMed] [Google Scholar]
- 35. Gassler N, Zhang C, Wenger T, Schnabel PA, Dienemann H, Debatin KM, et al. Dexamethasone-induced cisplatin and gemcitabine resistance in lung carcinoma samples treated ex vivo. Br J Cancer. 2005;92(6):1084–8. 10.1038/sj.bjc.6602453 PubMed [DOI] [PMC free article] [PubMed] [Google Scholar]
- 36. Auphan N, DiDonato JA, Rosette C, Helmberg A, Karin M. Immunosuppression by glucocorticoids: inhibition of NF-kappa B activity through induction of I kappa B synthesis. Science. 1995;270(286–290). [DOI] [PubMed] [Google Scholar]
- 37. Barwe SP, Rajasekaran S.A., and Rajasekaran A.K. Identification of protein kinase C as an intermediate in Na,K-ATPase B-subunit mediated lamellipodia formation and suppression of cell motility in carcinoma cells. Cell Mol Biol. 2006;52(8):41–7. [PubMed] [Google Scholar]
- 38. Chalaka S, Ingbar DH, Sharma R, Zhau Z, Wendt CH. Na(+)-K(+)-ATPase gene regulation by glucocorticoids in a fetal lung epithelial cell line. Am J Physiol. 1999;277(1 Pt 1):L197–203 PubMed . [DOI] [PubMed] [Google Scholar]
- 39. Derfoul A, Robertson NM, Lingrel JB, Hall DJ, Litwach G. Regulation of the human Na,K-ATPase beta1 gene promoter by mineralcorticoid and glucocorticoid receptors. J Biol Chem. 1998;273(33):20702–11. [DOI] [PubMed] [Google Scholar]
- 40. Hao H, Wendt CH, Sandhu G, Ingbar DH. Dexamethasone stimulates transcription of the Na,K-ATPase B1 gene in rat lung epithelial cels. Am J Physiol Lung Cell Mol Physiol. 2003. a;285:L593–L601. [DOI] [PubMed] [Google Scholar]
- 41. Hao H, Rhodes R., Ingbar D.H., and Wendt C.H. Dexamethasone responsive element in the rat Na,K-ATPase B1 gene coding region. Biochimica et Biophysica Acta. 2003. b;1630:55–63. [DOI] [PubMed] [Google Scholar]
- 42. Arai Y, Nonomura N, Nakai Y, Nishimura K, Oka D, Shiba M, et al. The growth-inhibitory effects of dexamethasone on renal cell carcinoma in vivo and in vitro. Cancer Invest. 2008;26(1):35–40. Epub 2008/01/09. 10.1080/07357900701638418 PubMed . [DOI] [PubMed] [Google Scholar]
- 43. Tummala R, Wolle D, Barwe SP, Sampson VB, Rajasekaran AK, Pendyala L. Expression of Na,K-ATPase-beta1 subunit increases uptake and sensitizes carcinoma cells to oxaliplatin. Cancer Chemother Pharmacol. 2009;64(6):1187–94. 10.1007/s00280-009-0985-x [DOI] [PMC free article] [PubMed] [Google Scholar]
- 44. Aapro MS, Alberts DS, Serokman R. Lack of dexamethasone effect on the antitumor activity of cisplatin. Cancer Treat Rep. 1983;67(11):1013–7 PubMed . [PubMed] [Google Scholar]
- 45. Yu WD, McElwain MC, Modzelewski RA, Russell DM, Smith DC, Trump DL, et al. Enhancement of 1,25-dihydroxyvitamin D3-mediated antitumor activity with dexamethasone. J Natl Cancer Inst. 1998;90(2):134–41 PubMed . [DOI] [PubMed] [Google Scholar]
- 46. Arafa HM, Abdel-Hamid MA, El-Khouly AA, Elmazar MM, Osman AM. Enhancement by dexamethasone of the therapeutic benefits of cisplatin via regulation of tumor angiogenesis and cell cycle kinetics in a murine tumor paradigm. Toxicology. 2006;222(1–2):103–13. 10.1016/j.tox.2006.02.007 PubMed . [DOI] [PubMed] [Google Scholar]
- 47. Wang H, Li M, Rinehart JJ, Zhang R. Pretreatment with dexamethasone increases antitumor activity of carboplatin and gemcitabine in mice bearing human cancer xenografts: in vivo activity, pharmacokinetics, and clinical implications for cancer chemotherapy. Clin Cancer Res. 2004;10(5):1633–44 PubMed . [DOI] [PubMed] [Google Scholar]
- 48. Piette C, Deprez M, Roger T, Noel A, Foidart JM, Munaut C. The dexamethasone-induced inhibition of proliferation, migration, and invasion in glioma cell lines is antagonized by macrophage migration inhibitor factor (MIF) and can be enhanced by specific MIF inhibitors. J Biol Chem. 2009;284(47):32483–92. 10.1074/jbc.M109.014589 [DOI] [PMC free article] [PubMed] [Google Scholar]
- 49. Zhang L, Lei W, Wang X, Tang Y, Song J. Glucocorticoid induces mesenchymal-to-epithelial transition and inhibits TGF-beta1-induced epithelial-to-mesenchymal transition and cell migration. FEBS letters. 2010;584(22):4646–54. Epub 2010/10/26. 10.1016/j.febslet.2010.10.038 PubMed . [DOI] [PubMed] [Google Scholar]
- 50. Jang YH, Shin HS, Sun Choi H, Ryu ES, Jin Kim M, Ki Min S, et al. Effects of dexamethasone on the TGF-beta1-induced epithelial-to-mesenchymal transition in human peritoneal mesothelial cells. Laboratory investigation; a journal of technical methods and pathology. 2013;93(2):194–206. Epub 2012/12/05. 10.1038/labinvest.2012.166 PubMed . [DOI] [PubMed] [Google Scholar]
Associated Data
This section collects any data citations, data availability statements, or supplementary materials included in this article.
Supplementary Materials
EC50 and fold activation values for each compound were determined from a single dose-response curve. Activation at each concentration was determined from three data points.
(TIF)
Data Availability Statement
All data are included within the paper.


