

Abstract
Background
QRS prolongation is associated with adverse outcomes in mostly white populations, but its clinical significance is not well established for other groups. We investigated the association between QRS duration and mortality in African Americans.
Methods and Results
We analyzed data from 5146 African Americans in the Jackson Heart Study stratified by QRS duration on baseline 12-lead electrocardiogram. We defined QRS prolongation as QRS ≥ 100 msec. We assessed the association between QRS duration and all-cause mortality using Cox proportional hazards models, and reported the cumulative incidence of heart failure (HF) hospitalization. We identified factors associated with the development of QRS prolongation in patients with normal baseline QRS. At baseline, 30% (n = 1528) of participants had QRS prolongation. The cumulative incidences of mortality and HF hospitalization were greater with versus without baseline QRS prolongation: 12.6% (95% CI, 11.0–14.4) vs. 7.1% (95% CI, 6.3–8.0) and 8.2% (95% CI, 6.9–9.7) vs. 4.4% (95% CI, 3.7–5.1), respectively. After risk adjustment, QRS prolongation was associated with increased mortality (HR, 1.27; 95% CI, 1.03–1.56; P = .02). There was a linear relationship between QRS duration and mortality (HR per 10 msec increase, 1.06; 95% CI, 1.01–1.12). Older age, male sex, prior myocardial infarction, lower ejection fraction, left ventricular hypertrophy, and left ventricular dilatation were associated with the development of QRS prolongation.
Conclusions
QRS prolongation in African Americans was associated with increased mortality and HF hospitalization. Factors associated with developing QRS prolongation included age, male sex, prior myocardial infarction, and left ventricular structural abnormalities.
Keywords: QRS duration, ventricular conduction, African American, mortality, heart failure
Prolonged duration of the QRS complex on a 12-lead electrocardiogram is associated with adverse events, including heart failure, sudden cardiac death, and all-cause mortality.1–3 Previous studies of QRS interval have focused on patients with known cardiac disease4–7 and were conducted in primarily white populations.3,8 Racial differences in ventricular conduction have been identified in the general population and among patients with cardiac disease.9,10 However, associations between QRS duration and clinical outcomes in African Americans have not been well characterized. The availability of electrocardiogram information on more than 5000 African American participants in the Jackson Heart Study allows a comprehensive investigation of the relationship between QRS duration and mortality in this population.11 Therefore, we investigated associations between QRS duration and long-term outcomes of African Americans in the Jackson Heart Study. In addition, we sought to identify clinical factors associated with the development of QRS prolongation in this cohort.
Methods
Data Sources
The Jackson Heart Study is a prospective community-based observational study initiated in 2000 to investigate risk factors for cardiovascular disease in African Americans.11 All participants provided written informed consent, and study protocols were approved by local institutional review boards. The study recruited participants from the Jackson, Mississippi, cohort of the Atherosclerosis Risk in Communities (ARIC) study and from the overall tricounty population, as described previously.12 Participants completed 3 study visits: exam 1 between September 2000 and March 2004, exam 2 between October 2005 and December 2008, and exam 3 between February 2009 and January 2013. Data collected include demographic characteristics, comorbid conditions, medications, laboratory test results, and cardiac test results, including electrocardiogram (exams 1 and 3 only) and echocardiogram (exam 1 only).13 The details of visit procedures, including supine 12-lead digital electrocardiography, have been described previously.13 The definitions of comorbid conditions and the details of electrocardiography measurements and medication collection and coding have also been reported.14,15 The Jackson Heart Study cohort surveillance system collects follow-up data on all participants, including deaths, study terminations (from 2000 through 2010), and heart failure hospitalizations (from 2005 through 2010).16
Study Population
For the primary analysis of mortality, we included participants who completed exam 1 with documentation of QRS duration and intraventricular conduction on an electrocardiogram. We excluded participants who had a ventricular pacemaker as noted by the presence of an electrocardiogram atrioventricular Minnesota Code of 6 to 8.13 For the analysis assessing clinical factors associated with the development of QRS prolongation, we included participants from the primary analysis cohort who completed exam 3 with documentation of QRS duration. Participants with delayed ventricular conduction at exam 1 (ie, QRS duration of 100 msec or greater) were excluded from this part of the analysis (Figure 1).
Figure 1.
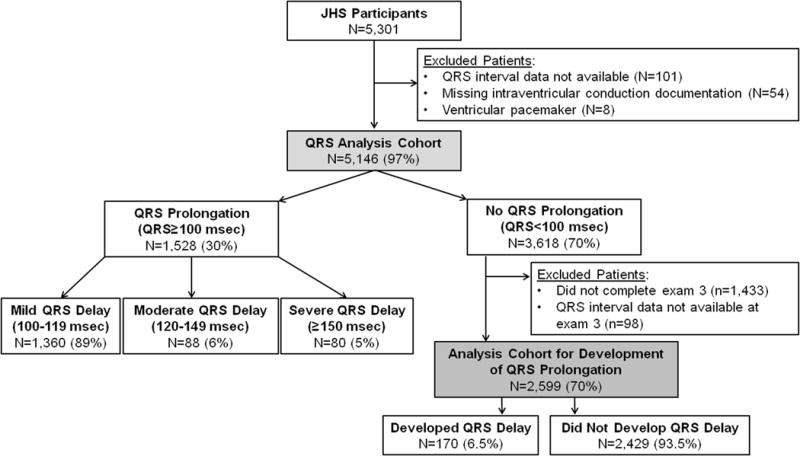
Derivation of the Study Cohort
QRS Prolongation
The study variable of interest was QRS duration on electrocardiogram at clinical exams 1 and 3. Previous studies defined QRS prolongation as 110 msec or greater or 120 msec or greater,3,5 but we were also interested in more modest degrees of QRS prolongation (ie, 100 to 119 msec), as assessed in other recent analyses.9 We defined normal ventricular conduction as QRS duration of less than 100 msec, and we defined QRS prolongation as 100 msec or greater. We categorized the severity of QRS prolongation as mild (100 to 119 msec), moderate (120 to 149 msec), or severe (150 msec or greater) conduction delay. We determined these groups on the basis of previous research5 and thresholds that are used to determine eligibility and expected response from implantable cardiac resynchronization therapy in the context of reduced ejection fraction.17 Intraventricular conduction defects were recorded using Minnesota 7- codes. Complete LBBB was defined as Minnesota code 7–11 and complete RBBB was defined as Minnesota code 7–2113.
Outcomes
The primary outcome was all-cause mortality within 8 years after the exam 1 visit date. Methods for identification of all-cause mortality and determination of cause of death in the Jackson Heart Study cohort have been described previously.16 Annual follow-up included interviews with participants and/or next of kin to ascertain health events such as hospitalization or death. These data and questionnaires completed by physicians and medical examiners or coroners were obtained and reviewed by the medical record abstraction unit to generate diagnosis information. These diagnoses were reviewed and adjudicated by trained medical personnel. For the present analysis, we classified mode of death on the basis of the cause of death recorded in the Jackson Heart Study long-term follow-up file.16 We also assessed the cumulative incidence of heart failure hospitalization between 2005 and 2010 among study participants who survived to January 1, 2005, when heart failure hospitalization surveillance began. Potential heart failure hospitalizations in the Jackson Heart Failure cohort were identified and adjudicated as described previously.16 Hospitalization data were obtained from the hospital discharge index from all catchment area hospitals and annual follow-up data. Hospitalization data from non-catchment area hospitals were obtained after patient consent. The self-reported data from annual follow-up were reconciled with the hospital discharge index data. The primary diagnoses based on International Classification of Diseases, Ninth Revision, Clinical Modification (ICD-9-CM) codes were reviewed and adjudicated by trained medical personnel.
The secondary outcome for the present analysis was the development of QRS prolongation from baseline to follow-up. Since electrocardiogram data were not collected at exam 2, the development of QRS prolongation was defined as a QRS duration of 100 msec or greater at exam 3 among participants who had normal conduction (QRS duration of less than 100 msec) at exam 1.
Covariates
Variables from the baseline clinical exam included demographic characteristics, medical history, physical examination measurements, medications, laboratory test results, and cardiac test results. Medical history was based on either direct clinical examination (hypertension, diabetes mellitus, and atrial fibrillation) or self-reported disease history (myocardial infarction, stroke, chronic lung disease, and smoking). Since heart failure history was not collected, we used both self-reported disease and clinical measurements at exam 1 to derive baseline heart failure using the modified Gothenburg criteria developed and validated in the ARIC data set (Supplemental Table 1).18 To ascertain left ventricular hypertrophy, we used quantitative left ventricular mass measurement from M-mode echocardiography when available (missing for 35% of participants); otherwise, left ventricular hypertrophy was based on a qualitative assessment of mild, moderate, or severe hypertrophy, as described previously.13 We derived medication variables by searching for therapeutic classification codes that were recorded based on medications taken within 2 weeks of exam 1. Most variables had very low rates of missingness (ie, less than 5%). For variables with less than 5% missingness, we imputed continuous variables to the overall median value, dichotomous variables to “no,” and multichotomous variables to the most frequent categorical value. For variables with greater than 5% missingness (medication variables), we treated the missing values as a separate category.
Statistical Analysis
We describe exam 1 baseline characteristics of the study population by QRS duration category using frequencies with percentages for categorical variables and medians with interquartile range or means with SDs for continuous variables. We tested for differences between groups using chi-square tests for categorical variables and Kruskal-Wallis tests for continuous variables.
We calculated the cumulative incidence of all-cause mortality and heart failure hospitalization by QRS duration category (normal conduction vs any prolonged conduction stratified by normal, mild, moderate, and severe delay) using Kaplan-Meier estimates, and we tested for differences between groups using log-rank tests. For all survival analyses, we censored data for participants at the time of study participation refusal or the end of study follow-up (December 31, 2010). For heart failure hospitalization, we also censored data for participants at the time of death. For mode of death, we used frequencies with percentages, calculated exact CIs for binomial proportions, and tested for differences between groups using Fisher exact tests.
We assessed the unadjusted and adjusted associations between QRS duration category and mortality using Cox proportional hazards models. We also investigated the association between QRS duration as a continuous variable and all-cause mortality. We explored both linear and nonlinear functional forms, including polynomials and restricted cubic splines. We selected the adjustment variables on the basis of previous studies3 and clinical judgment. Covariates included age, sex, prior myocardial infarction, heart failure, hypertension, prior stroke, diabetes mellitus, chronic lung disease, current or prior smoking, body mass index, systolic blood pressure, heart rate, sodium, estimated glomerular filtration rate (eGFR), hemoglobin level, ejection fraction, left ventricular hypertrophy, left ventricular end-diastolic dimension, β-blocker, angiotensin-converting enzyme (ACE) inhibitor or angiotensin II receptor blocker (ARB), statin, antiplatelet therapy, and a variable for missing medication data. We tested for interactions between QRS (yes/no, categorical and continuous) and sex as well as intraventricular conduction category (none, complete LBBB, complete RBBB and other intraventricular conduction defect) in our multivariable mortality models. We did not use multivariable modeling to assess the association between QRS duration and heart failure hospitalization because of discontinuity between baseline evaluation and the start of heart failure hospitalization surveillance.
To determine factors associated with the development of QRS prolongation, we used a modified Poisson model with an offset parameter to adjust for the log of participant time between exam 1 and exam 3 (range, 6 to 12 years).19,20 We determined the allowable number of variables based on 10 events per variable using a blinded review of the event rate. We chose the variable list on the basis of previous research9 and clinical judgment. Covariates included age, sex, prior myocardial infarction, heart failure, hypertension, prior stroke, diabetes mellitus, chronic lung disease, current smoking, body mass index, systolic blood pressure, heart rate, sodium, eGFR, hemoglobin level, ejection fraction, left ventricular hypertrophy, left ventricular dimension, and baseline QRS duration.
We used a 2-tailed α = .05 to establish statistical significance, and we report 95% CIs. We used SAS version 9.3 (SAS Institute Inc, Cary, NC) for all analyses. The institutional review board of the Duke University Health System approved the study.
Results
Of 5301 participants who completed exam 1, participants for whom QRS duration data (n = 101 [1.9%]) or intraventricular conduction documentation (n = 54 [1.0%]) was missing and participants with a ventricular pacemaker (n = 8 [0.2%]) were excluded from all analyses (Figure 1). For the assessment of predictors, we excluded participants who had QRS prolongation at exam 1 (n = 1528), those who did not complete exam 3 (n = 1433), and those without QRS documentation at exam 3 (n = 98). After all exclusions, the analysis sample consisted of 5146 participants eligible for the mortality assessment and 2599 eligible for the assessment of predictors of the development of QRS prolongation.
Of the 5146 individuals in the analysis, 1528 (30%) had a baseline QRS duration of 100 msec or greater (Table 1). Conduction delay was mild in 89% (n = 1360), moderate in 6% (n = 88), and severe in 5% (n = 80). Participants with QRS prolongation at baseline were more often men, were older, and had a greater prevalence of comorbid conditions, including hypertension, prior myocardial infarction, and heart failure, compared with those without QRS prolongation. With increasing severity of conduction delay (Supplemental Table 2), systolic blood pressure was higher and eGFR was lower. Patients with conduction delay were more likely to have an ejection fraction of less than 40%, compared with patients with a normal QRS duration. However, on average, ejection fraction was preserved in all groups. Use of β-blockers, ACE inhibitors/ARBs, and calcium channel blockers was higher among patients with QRS prolongation.
Table 1.
Baseline Characteristics of the Study Population Stratified by Normal Conduction vs Any Conduction Delay
| Characteristic | Normal Conduction (QRS < 100 msec) | Any Delay (QRS ≥ 100 msec) | P Value |
|---|---|---|---|
| No. of participants | 3618 | 1528 | |
| Age, median (IQR), y | 54.1 (44.4–63.8) | 59.3 (48.5–67.3) | < .001 |
| Male sex, No. (%) | 1114 (30.8) | 752 (49.2) | < .001 |
| Medical history, No. (%) | |||
| Atrial fibrillation | 7 (0.2) | 11 (0.7) | .003 |
| Chronic lung disease | 250 (6.9) | 121 (7.9) | .20 |
| Diabetes mellitus | 735 (20.3) | 375 (24.5) | < .001 |
| Heart failure | 222 (6.1) | 153 (10.0) | < .001 |
| Hypertension | 2091 (57.8) | 1054 (69.0) | < .001 |
| Myocardial infarction | 153 (4.2) | 117 (7.7) | < .001 |
| Smoker currently | 461 (12.7) | 205 (13.4) | .51 |
| Smoker previously | 634 (17.5) | 353 (23.1) | < .001 |
| Stroke | 152 (4.2) | 71 (4.6) | .47 |
| Physical examination, median (IQR) | |||
| Body mass index, kg/m2 | 30.2 (26.5–35.1) | 31.3 (27.7–36.4) | < .001 |
| Pulse, beats/min | 64.0 (58.0–71.0) | 62.0 (56.0–70.0) | < .001 |
| Systolic blood pressure, mm Hg | 124.0 (114.0–136.0) | 126.0 (116.0–139.0) | < .001 |
| Laboratory test results, median (IQR) | |||
| eGFR, mL/min/1.73 m2 | 85.9 (75.9–97.1) | 85.5 (75.1–95.4) | .006 |
| Glucose, mg/dL | 91.0 (85.0–100.0) | 93.0 (87.0–104.0) | < .001 |
| Hemoglobin, g/dL | 13.0 (12.1–13.9) | 13.2 (12.4–14.3) | < .001 |
| Low-density lipoprotein, mg/dL | 124.0 (101.0–147.0) | 124.0 (102.0–147.0) | .86 |
| Serum potassium, mEq/L | 4.3 (4.0–4.5) | 4.3 (4.0–4.5) | .08 |
| Serum sodium, mEq/L | 141.0 (139.0–142.0) | 141.0 (139.0–142.0) | < .001 |
| Cardiac test results | |||
| Complete LBBB, No. (%) | 0 | 52 (3.4) | < .001 |
| Complete RBBB, No. (%) | 0 | 64 (4.2) | < .001 |
| Other IV conduction Defect, No. (%) | 94 (2.6) | 132 (8.6) | < .001 |
| Ejection fraction, mean (SD), % | 62.5 (6.7) | 60.7 (8.8) | < .001 |
| Ejection fraction < 40%, No. (%) | 9 (0.2) | 35 (2.3) | < .001 |
| Left ventricular dimension, median (IQR), cm | 48.1 (45.2–50.3) | 49.3 (47.0–52.5) | < .001 |
| Left ventricular hypertrophy, No. (%) | 222 (6.1) | 166 (10.9) | < .001 |
| Medications, No. (%) | |||
| ACE inhibitor/ARB | 548 (15.1) | 302 (19.8) | < .001 |
| Anti-arrhythmic agent | 6 (0.2) | 12 (0.8) | < .001 |
| Antiplatelet agent | 44 (1.2) | 34 (2.2) | .007 |
| β-Blocker | 319 (8.8) | 189 (12.4) | < .001 |
| Calcium channel blocker | 597 (16.5) | 357 (23.4) | < .001 |
| Digoxin | 28 (0.8) | 46 (3.0) | < .001 |
| Diuretic | 742 (20.5) | 430 (28.1) | < .001 |
| Insulin | 197 (5.4) | 121 (7.9) | < .001 |
| Oral diabetic agent | 380 (10.5) | 172 (11.3) | .42 |
| Statin | 377 (10.4) | 207 (13.5) | .001 |
Abbreviations: ACE, angiotensin-converting enzyme; ARB, angiotensin II receptor blocker; eGFR, estimated glomerular filtration rate.
Median follow-up was 8.3 years (interquartile range, 7.5–9.0 years) and was similar in all groups. Table 2 shows the cumulative incidence of death within 8 years after exam 1. The cumulative incidence of death among participants with normal conduction was 7.1% (95% CI, 6.3–8.0,) compared with 12.6% (95% CI, 11.0–14.4) among those with any QRS prolongation at baseline (P < .001). With increasing severity of conduction delay, there was an increase in mortality associated with mild delay (11.2%; 95% CI, 9.6–13.1), moderate delay (14.9%; 95% CI, 9.0–24.6), and severe delay (33.7%; 95% CI, 24.5–46.3) (Supplemental Table 3). Figure 2 shows the curves for the cumulative incidence of death by baseline QRS interval. Table 2 and Supplemental Table 3 also show associations between QRS prolongation and mode of death and heart failure hospitalization. The number of events was low among participants with severe conduction delay, but there was a marked increase in the proportions of sudden cardiac death and heart failure death compared with participants with normal conduction.
Table 2.
Outcomes Stratified by Normal Conduction vs Any Conduction Delay
| Outcome | Normal Conduction (< 100 msec) | Any Delay (≥ 100 msec) | P Value |
|---|---|---|---|
| Mortality, No. (cumulative incidencea) | 241 (7.1) | 186 (12.6) | < .001 |
| 95% CI | (6.3–8.0) | (11.0–14.4) | |
| Mode of death, No. (%) | |||
| Cardiac mortality | 101 (41.9) | 97 (52.2) | .04 |
| 95% CI | 35.6–48.4 | 44.7–59.5 | |
| Sudden cardiac death | 8 (3.3) | 15 (8.1) | .05 |
| 95% CI | 1.4–6.4 | 4.6–13.0 | |
| Heart failure or cardiomyopathy | 6 (2.5) | 10 (5.4) | .13 |
| 95% CI | 0.9–5.3 | 2.6–9.7 | |
| Noncardiovascular mortality | 140 (58.1) | 89 (47.8) | .04 |
| 95% CI | 51.6–64.4 | 40.5–55.3 | |
| Heart failure hospitalization, No. (cumulative incidence)b | 153 (4.4) | 118 (8.2) | < .001 |
| 95% CI | 3.7–5.1 | 6.9–9.7 |
Cumulative incidence of death within 8 years after exam 1.
Calculated among the 5065 participants who survived to January 1, 2005, when heart failure hospitalization surveillance began.
Figure 2. Cumulative Incidence of Death by Baseline QRS Duration.
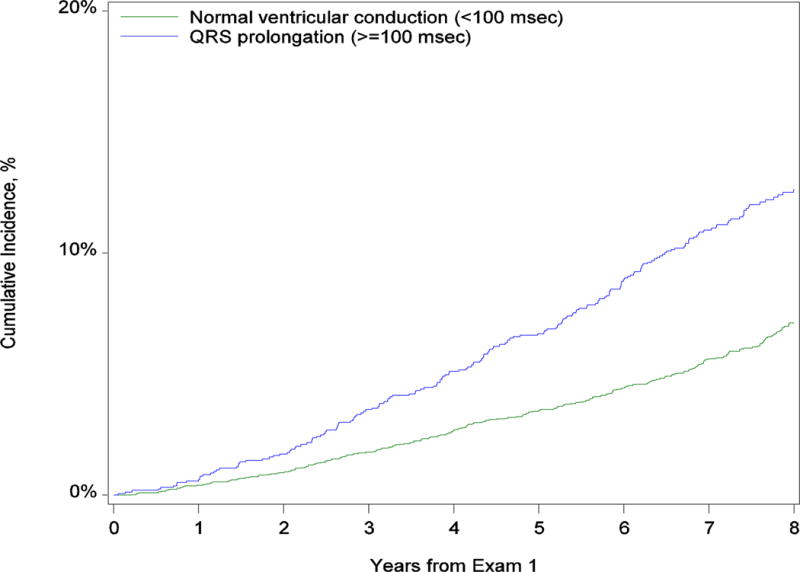
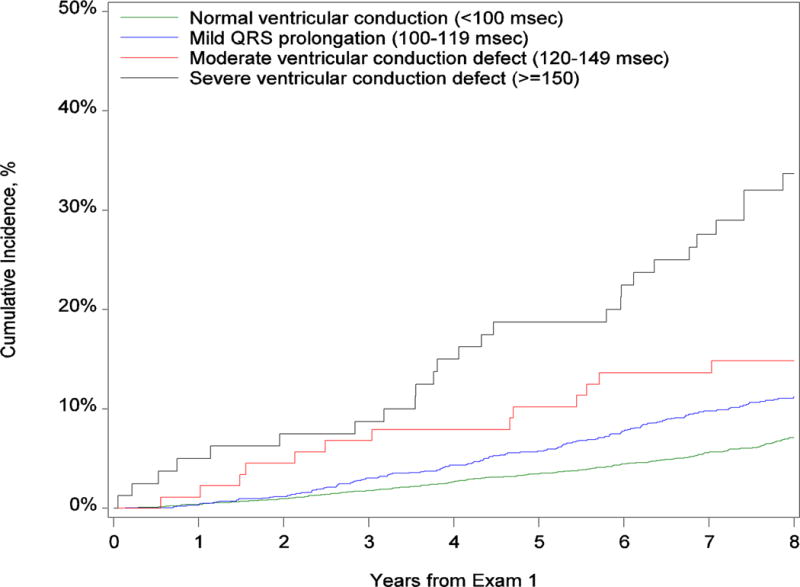
Panel A shows the comparison between no conduction delay and any QRS delay. Panel B shows the comparison between normal conduction, mild conduction delay, moderate conduction delay, and severe conduction delay.
Table 3 shows the association between baseline QRS duration and 8-year all-cause mortality. After risk adjustment, any conduction delay was associated with a 27% increase in mortality. Mild and severe delay were associated with a 26% and 57% increase in adjusted mortality, respectively. In contrast, moderate conduction delay was not associated with a statistically significant increase in mortality after risk adjustment. To investigate this lack of association between moderate conduction delay and mortality, we assessed how the sequential addition of adjustment variables attenuated the association. After adjustment for age alone, the hazard ratio decreased from 2.36 to 1.25 and was no longer significant (P = .43). After including sex and prior myocardial infarction in the model, the hazard ratio decreased to 1.16 (P = .60) and 1.09 (P = .77), respectively. The QRS*sex and QRS*intraventricular conduction delay category interactions were insignificant, indicating that the effect of QRS duration on mortality does not differ between males and females or based on the type of conduction delay (e.g., complete LBBB, complete RBBB, other intraventricular conduction defect).
Table 3.
Associations Between QRS Duration and 8-Year All-Cause Mortality
| Variable | Unadjusted Analysis | Adjusted Analysisa | ||
|---|---|---|---|---|
| Hazard Ratio (95% CI) | P Value | Hazard Ratio (95% CI) | P Value | |
| Normal conduction | 1.00 [Reference] | 1.00 [Reference] | ||
| Any QRS delay | 1.89 (1.56–2.29) | < .001 | 1.27 (1.03–1.56) | .02 |
| Mild conduction delay | 1.67 (1.36–2.05) | < .001 | 1.26 (1.01–1.56) | .04 |
| Moderate conduction delay | 2.36 (1.35–4.12) | .003 | 1.09 (0.61–1.93) | .77 |
| Severe conduction delay | 5.63 (3.76–8.44) | < .001 | 1.57 (1.01–2.45) | .047 |
Adjusted for age, sex, prior myocardial infarction, heart failure, hypertension, stroke, diabetes, chronic lung disease, current smoking, prior smoking, body mass index, systolic blood pressure, heart rate, sodium, estimated glomerular filtration rate, hemoglobin level, ejection fraction, left ventricular hypertrophy, left ventricular dimension, β-blocker, angiotensin-converting enzyme inhibitor, statin, and antiplatelet agent.
When we assessed the association between QRS duration as a continuous variable and mortality, we found no statistically significant evidence of a nonlinear association (P = .57). When we assessed the multivariable-adjusted linear association, the hazard ratio per 10 msec increase in QRS duration was 1.06 (95% CI, 1.01–1.12; P = .02). Figure 3 shows the association between the continuous QRS variable and mortality (using QRS duration of 70 msec as the reference). Participants with QRS duration of 125 msec had a 50% higher hazard of death compared with participants with a QRS duration of 70 msec. The hazard of death was twice as high for those with a QRS duration of 185 msec compared with a QRS duration of 70 msec.
Figure 3. Adjusted Hazard of Mortality by QRS Duration as a Continuous Variable.
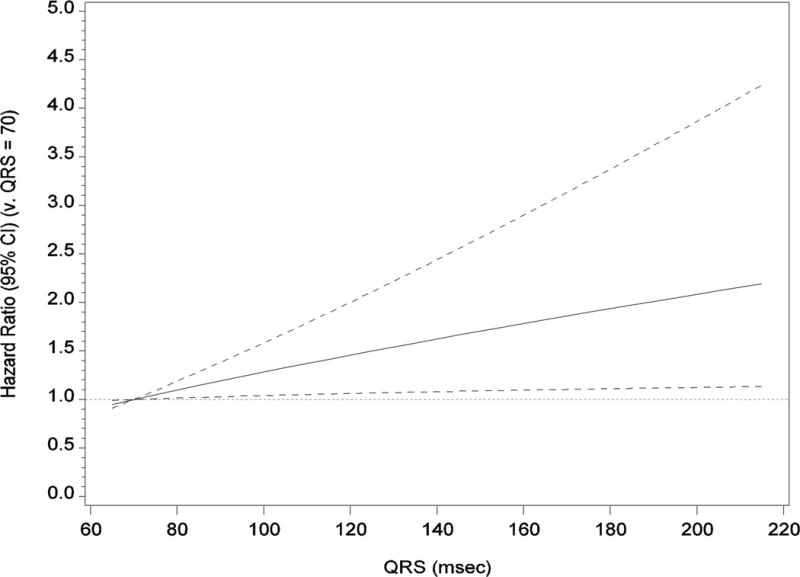
The reference category is QRS duration of 70 msec. The solid black line represents the hazard ratio, and the dotted lines represent the 95% CIs. The analysis is adjusted for age, sex, prior myocardial infarction, heart failure, hypertension, stroke, diabetes, chronic lung disease, current smoking, prior smoking, body mass index, systolic blood pressure, heart rate, serum sodium level, estimated glomerular filtration rate, hemoglobin level, ejection fraction, left ventricular hypertrophy, left ventricular dimension, β-blocker, angiotensin-converting enzyme inhibitor, statin, and antiplatelet therapy.
Supplemental Table 4 shows the baseline characteristics of the 2599 participants who completed exam 3 and had normal conduction at baseline. The median age of the population at baseline was 53 years and 69% were women. Hypertension and diabetes mellitus were present in 55% and 17%, respectively. The median body mass index was 30 kg/m2, systolic blood pressure was 123 mm Hg, and eGFR was 87 mL/min/1.73m2. Of these participants, 170 (6.5%) developed QRS prolongation during the follow-up period. Table 4 shows the factors associated with the development of QRS prolongation. Greater age, male sex, prior myocardial infarction, lower ejection fraction, left ventricular hypertrophy, and larger left ventricular end-diastolic dimension were associated with QRS prolongation (P < .05 for all comparisons). For example, each 5-year increase in age was associated with a 15% greater risk for developing QRS prolongation, and male sex was associated with a 58% greater risk. Prior myocardial infarction and left ventricular hypertrophy on echocardiogram were associated with a 72% and 64% increased risk of developing QRS prolongation, respectively.
Table 4.
Associations Between Clinical Factors and the Development of QRS Prolongation
| Variable | Unadjusted RR (95% CI) | P Value | Adjusted RR (95% CI) | P Value |
|---|---|---|---|---|
| Age, per 5-year increase | 1.17 (1.10–1.25) | < .001 | 1.15 (1.06–1.25) | < .001 |
| Male sex | 2.21 (1.66–2.95) | < .001 | 1.58 (1.10–2.26) | .01 |
| Medical history | ||||
| Myocardial infarction | 2.57 (1.56–4.24) | < .001 | 1.72 (1.01–2.92) | .04 |
| Heart failure | 1.05 (0.55–2.00) | .89 | 0.99 (0.51–1.91) | .98 |
| Hypertension | 2.15 (1.55–2.99) | < .001 | 1.45 (0.98–2.14) | .06 |
| Stroke | 2.11 (1.15–3.84) | .02 | 1.36 (0.70–2.65) | .37 |
| Diabetes | 1.26 (0.89–1.80) | .20 | 0.95 (0.65–1.37) | .78 |
| Chronic lung disease | 0.54 (0.24–1.20) | .13 | 0.54 (0.24–1.21) | .13 |
| Current smoker | 1.00 (0.63–1.58) | > .99 | 0.90 (0.57–1.40) | .63 |
| Physical examination results | ||||
| BMI, kg/m2 | 1.00 (0.98–1.02) | .96 | 1.00 (0.97–1.02) | .76 |
| Systolic blood pressure, mm Hg | 1.09 (1.05–1.13) | < .001 | 1.02 (0.97–1.07) | .43 |
| Pulse, beats/min | 0.97 (0.90–1.05) | .45 | 1.02 (0.95–1.09) | .61 |
| Laboratory test results | ||||
| Serum sodium, mEq/L | 1.03 (0.97–1.10) | .35 | 0.99 (0.93–1.05) | .72 |
| eGFR, mL/min/1.73 m2 | 0.97 (0.94–1.02) | .22 | 1.01 (0.97–1.06) | .60 |
| Hemoglobin, g/dL | 1.12 (1.00–1.25) | .05 | 0.99 (0.88–1.12) | .92 |
| Baseline cardiac test results | ||||
| Ejection fraction, % | 1.24 (1.12–1.38) | < .001 | 1.17 (1.06–1.28) | .001 |
| Left ventricular hypertrophy | 2.35 (1.52–3.63) | < .001 | 1.64 (1.03–2.62) | .04 |
| Left ventricular end diastolic dimension, cm | 1.11 (1.07–1.15) | < .001 | 1.05 (1.02–1.09) | .002 |
| QRS duration, msec | 1.11 (1.09–1.13) | < .001 | 1.09 (1.07–1.12) | < .001 |
Abbreviations: BMI, body mass index; eGFR, estimate glomerular filtration rate; RR, risk ratio.
Discussion
We found that 30% of African Americans in this community-based cohort had QRS prolongation at baseline. The participants with QRS prolongation tended to be older, were more likely to be men, and had greater comorbidity. After risk adjustment, QRS prolongation was associated with a 27% increase in all-cause mortality compared with no prolongation. Severe prolongation of 150 msec or greater was associated with a 57% increase in all-cause mortality. All-cause mortality increased 6% per 10 msec increase in QRS duration. Relatively few baseline factors were associated with the development of QRS prolongation, but these included increasing age, male sex, prior myocardial infarction, and left ventricular structural abnormalities. These results extend previous findings regarding the prognostic utility of QRS duration to African Americans. In addition, clinicians may be able to use the identified clinical variables associated with the development of QRS prolongation to assist with prognostication in African American populations.
A major finding of this analysis was the high prevalence of QRS prolongation in a community cohort of mostly middle-aged African Americans. Thirty percent had a baseline QRS duration of 100 msec or greater. In comparison, in a large middle-aged Finnish cohort, 1.3% of had a QRS duration of 110 msec or greater.3 In the National Health and Nutrition Examination Survey (NHANES) data set of mostly white participants, the top quartile (ie, 25%) had a QRS duration of 106 msec or greater.8 Contrary to these findings, a previous analysis of patients with heart failure found that a QRS duration greater than 120 msec was less prevalent among black patients than white patients (15.8% vs 26.0%).21 We found that the vast majority of Jackson Heart Study participants with QRS prolongation had a QRS duration of 100 to 119 msec (ie, 89% of prolongation cases). These findings support previous research suggesting important differences in ventricular conduction by race10,22,23 and highlight the high prevalence of mild QRS prolongation in African Americans. Genetic differences may explain, in part, these racial differences in QRS duration. For example, a previous analysis from the Jackson Heart Study found that polymorphisms in the SCN5A gene encoding a cardiac voltage-gated sodium channel were associated with QRS duration.24
To our knowledge, ours is the first report of an association between QRS prolongation and increased mortality in a community cohort of African Americans. The cumulative incidence of 8-year mortality was nearly twice as high with any QRS prolongation compared with no prolongation (12.6% vs 7.1%). The cumulative incidence of mortality was higher than 30% in participants with QRS duration of 150 msec or greater. In addition, when QRS duration was assessed as a continuous variable, there was a linear association with increased mortality. These observations suggest that the ambulatory African American population with delayed ventricular conduction is at substantial risk for mortality. Conduction disease was an independent risk factor even after adjustment for other markers of cardiac disease such as hypertension, left ventricular hypertrophy, and left ventricular dimension. There was no evidence of a differential association between QRS duration and mortality based on sex or QRS morphology. Thus, our results support other recent data suggesting that RBBB (in addition to LBBB) may be an important negative prognostic variable25 in both men and women. These findings are in contrast to earlier reports of RBBB representing a benign finding26.
The specific reasons for the increased risk associated with even mild conduction delay is unclear. It has been hypothesized that QRS duration may represent a marker of underlying structural heart disease or that it may be linked to other adverse genetic features.27 Abnormal electrical activation of the ventricles may be related to mechanical dyssynchrony and reduced cardiac efficiency. We found that QRS prolongation was associated with an increased incidence of heart failure hospitalization. The increased prevalence of symptomatic heart failure may represent an important link with increased mortality. In addition, disrupted electrical conduction may lead to the development of ventricular arrhythmias.3 In the present analysis, patients with QRS delay died from a cardiac cause 52.2% of the time compared to 41.9% cardiac death in those without delay. In particular, there was an increased incidence of sudden cardiac death and heart failure death in patients with any QRS prolongation. Thus, QRS delay in the JHS population was associated with increased mortality due to arrhythmic and pump failure death.
Our finding that moderate conduction delay in the range of 120 to 149 msec was not associated with risk-adjusted mortality was unexpected. These results are likely related to the overall modest sample size of the moderate delay group (n = 88) or statistical chance. The analysis of QRS duration as a continuous variable did not demonstrate any statistically significant nonlinear associations and overall had greater statistical power compared with the analysis of QRS duration as a categorical variable.
We found that increasing age, male sex, prior myocardial infarction, lower ejection fraction, left ventricular hypertrophy, and larger left ventricular dimension were associated with developing QRS prolongation. Previous studies have also identified male sex and markers of ventricular mass as predictors of the development of QRS prolongation.9 Our study extends these data by demonstrating the prognostic utility of prior myocardial infarction and echocardiographic features such as left ventricular dimension and left ventricular hypertrophy. These characteristics can be used to identify African American patients at higher risk of developing QRS prolongation. If these findings are validated in additional studies, it may be reasonable to perform an echocardiogram to evaluate left ventricular dimension and assess left ventricular hypertrophy in African American patients with other risk factors for the development of QRS prolongation. Earlier identification of the constellation of these factors may allow for targeted use of medications with ventricular remodeling effects. These findings may be particularly relevant given the increased incidence of heart failure hospitalization in patients who demonstrate QRS prolongation. Future studies are needed to determine whether the addition of medications such as ACE inhibitors or β-blockers in patients with features such as left ventricular hypertrophy or increased left ventricular dimension can reduce conduction delays.
Our study has limitations. This was a retrospective analysis from a community cohort of African Americans in the southern United States. Other measured and unmeasured variables may have influenced the results. The sample size in the groups with a greater degree of QRS prolongation was modest. Limited data are available in this cohort regarding implantation of biventricular pacing therapy which would be expected to influence outcomes. Future studies should further investigate the association between QRS prolongation and mode-specific mortality including HF death. The unexpectedly higher rate of QRS prolongation at baseline (30%) resulted in a smaller than expected cohort available for analysis of predictors of new QRS prolongation and, subsequently, a lower event count (n = 170 with QRS delay by exam 3). Therefore, the number of variables was restricted and we could not explore the effect of medications on development of QRS prolongation.
In conclusion, QRS prolongation on a standard 12-lead electrocardiogram in African Americans appears to be associated with increased mortality. Factors associated with developing QRS prolongation in African Americans include prior myocardial infarction, left ventricular hypertrophy, ejection fraction, and left ventricular dimension. QRS prolongation should be considered as an important risk factor for long-term morbidity and mortality in African American populations and a potential therapeutic target for interventions.
Supplementary Material
Acknowledgments
We would like to acknowledge the contributions of the JHS participants and data collections staff.
Sources of Funding
Dr Mentz was supported by grant T32GM086330 from the National Institute of General Medical Sciences. The Jackson Heart Study is supported by contracts HHSN268201300046C, HHSN268201300047C, HHSN268201300048C, HHSN268201300049C, HHSN268201300050C from the National Heart, Lung, and Blood Institute and the National Institute on Minority Health and Health Disparities.
Footnotes
Additional Contributions
Damon M. Seils, MA, Duke University, provided editorial assistance for the manuscript. Mr Seils did not receive compensation for his assistance apart from his employment at the institution where the study was conducted.
Disclaimer
The content of this manuscript is solely the responsibility of the authors and does not necessarily represent the official views of the National Institute of General Medical Sciences or the National Institutes of Health.
Disclosures
Dr Mentz reported receiving research support from Gilead, BMS, AztraZeneca, GSK, Novartis, ResMed and Otsuka and receiving honoraria from Thoratec. Dr DeVore reported receiving research support from the American Heart Association, Novartis, and Thoratec. Dr Eapen reported serving on advisory boards for Cytokinetics and Novartis and receiving honoraria from Janssen. Dr Thomas reported receiving research support from and serving as a consultant for Boston Scientific. Dr Hernandez reported receiving research support from BMS, GlaxoSmithKline, Janssen, and Novartis; and receiving honoraria from Amgen, BMS, Janssen, and Novartis. No other authors reported financial disclosures.
References
- 1.Dhingra R, Pencina MJ, Wang TJ, Nam BH, Benjamin EJ, Levy D, Larson MG, Kannel WB, D’Agostino RB, Vasan RS. Electrocardiographic qrs duration and the risk of congestive heart failure: the Framingham Heart Study. Hypertension. 2006;47:861–867. doi: 10.1161/01.HYP.0000217141.20163.23. [DOI] [PubMed] [Google Scholar]
- 2.Morin DP, Oikarinen L, Viitasalo M, Toivonen L, Nieminen MS, Kjeldsen SE, Dahlöf B, John M, Devereux RB, Okin PM. QRS duration predicts sudden cardiac death in hypertensive patients undergoing intensive medical therapy: the LIFE study. Eur Heart J. 2009;30:2908–2914. doi: 10.1093/eurheartj/ehp321. [DOI] [PubMed] [Google Scholar]
- 3.Aro AL, Anttonen O, Tikkanen JT, Junttila MJ, Kerola T, Rissanen HA, Reunanen A, Huikuri HV. Intraventricular conduction delay in a standard 12-lead electrocardiogram as a predictor of mortality in the general population. Circ Arrhythm Electrophysiol. 2011;4:704–710. doi: 10.1161/CIRCEP.111.963561. [DOI] [PubMed] [Google Scholar]
- 4.Kashani A, Barold SS. Significance of QRS complex duration in patients with heart failure. J Am Coll Cardiol. 2005;46:2183–2192. doi: 10.1016/j.jacc.2005.01.071. [DOI] [PubMed] [Google Scholar]
- 5.Wang NC, Maggioni AP, Konstam MA, Zannad F, Krasa HB, Burnett JC, Jr, Grinfeld L, Swedberg K, Udelson JE, Cook T, Traver B, Zimmer C, Orlandi C, Gheorghiade M, Efficacy of Vasopressin Antagonism in Heart Failure Outcome Study With Tolvaptan (EVEREST) Investigators Clinical implications of QRS duration in patients hospitalized with worsening heart failure and reduced left ventricular ejection fraction. JAMA. 2008;299:2656–2666. doi: 10.1001/jama.299.22.2656. [DOI] [PubMed] [Google Scholar]
- 6.Zimetbaum PJ, Buxton AE, Batsford W, Fisher JD, Hafley GE, Lee KL, O’Toole MF, Page RL, Reynolds M, Josephson ME. Electrocardiographic predictors of arrhythmic death and total mortality in the Multicenter Unsustained Tachycardia Trial. Circulation. 2004;110:766–769. doi: 10.1161/01.CIR.0000139311.32278.32. [DOI] [PubMed] [Google Scholar]
- 7.Bongioanni S, Bianchi F, Migliardi A, Gnavi R, Pron PG, Casetta M, Conte MR. Relation of QRS duration to mortality in a community-based cohort with hypertrophic cardiomyopathy. Am J Cardiol. 2007;100:503–506. doi: 10.1016/j.amjcard.2007.03.049. [DOI] [PubMed] [Google Scholar]
- 8.Badheka AO, Singh V, Patel NJ, Deshmukh A, Shah N, Chothani A, Mehta K, Grover P, Savani GT, Gupta S, Rathod A, Marzouka GR, Mitrani RD, Moscucci M, Cohen MG. QRS duration on electrocardiography and cardiovascular mortality (from the National Health and Nutrition Examination Survey-III) Am J Cardiol. 2013;112:671–677. doi: 10.1016/j.amjcard.2013.04.040. [DOI] [PubMed] [Google Scholar]
- 9.Ilkhanoff L, Soliman EZ, Ning H, Liu K, Lloyd-Jones DM. Factors associated with development of prolonged QRS duration over 20 years in healthy young adults: the Coronary Artery Risk Development in Young Adults Study. J Electrocardiol. 2012;45:178–184. doi: 10.1016/j.jelectrocard.2011.11.001. [DOI] [PMC free article] [PubMed] [Google Scholar]
- 10.Mentz RJ, Bittner V, Schulte PJ, Fleg JL, Piña IL, Keteyian SJ, Moe G, Nigam A, Swank AM, Onwuanyi AE, Fitz-Gerald M, Kao A, Ellis SJ, Kraus WE, Whellan DJ, O’Connor CM. Race, exercise training, and outcomes in chronic heart failure: findings from Heart Failure – A Controlled Trial Investigating Outcomes in Exercise Training (HF-ACTION) Am Heart J. 2013;166:488–495.e481. doi: 10.1016/j.ahj.2013.06.002. [DOI] [PMC free article] [PubMed] [Google Scholar]
- 11.Taylor HA., Jr The Jackson Heart Study: an overview. Ethn Dis. 2005;15:S6-1–3. [PubMed] [Google Scholar]
- 12.Fox ER, Musani SK, Bidulescu A, Nagarajarao HS, Samdarshi TE, Gebreab SY, Sung JH, Steffes MW, Wang TJ, Taylor HA, Vasan RS. Relation of obesity to circulating B-type natriuretic peptide concentrations in blacks: the Jackson Heart Study. Circulation. 2011;124:1021–1027. doi: 10.1161/CIRCULATIONAHA.110.991943. [DOI] [PMC free article] [PubMed] [Google Scholar]
- 13.Carpenter MA, Crow R, Steffes M, Rock W, Heilbraun J, Evans G, Skelton T, Jensen R, Sarpong D. Laboratory, reading center, and coordinating center data management methods in the Jackson Heart Study. Am J Med Sci. 2004;328:131–144. doi: 10.1097/00000441-200409000-00001. [DOI] [PubMed] [Google Scholar]
- 14.Wyatt SB, Akylbekova EL, Wofford MR, Coady SA, Walker ER, Andrew ME, Keahey WJ, Taylor HA, Jones DW. Prevalence, awareness, treatment, and control of hypertension in the Jackson Heart Study. Hypertension. 2008;51:650–656. doi: 10.1161/HYPERTENSIONAHA.107.100081. [DOI] [PubMed] [Google Scholar]
- 15.Akylbekova EL, Crow RS, Johnson WD, Buxbaum SG, Njemanze S, Fox E, Sarpong DF, Taylor HA, Newton-Cheh C. Clinical correlates and heritability of qt interval duration in blacks: the Jackson Heart Study. Circ Arrhythm Electrophysiol. 2009;2:427–432. doi: 10.1161/CIRCEP.109.858894. [DOI] [PMC free article] [PubMed] [Google Scholar]
- 16.Keku E, Rosamond W, Taylor HA, Jr, Garrison R, Wyatt SB, Richard M, Jenkins B, Reeves L, Sarpong D. Cardiovascular disease event classification in the Jackson Heart Study: methods and procedures. Ethn Dis. 2005;15:S6-62–70. [PubMed] [Google Scholar]
- 17.Yancy CW, Jessup M, Bozkurt B, Butler J, Casey DE, Jr, Drazner MH, Fonarow GC, Geraci SA, Horwich T, Januzzi JL, Johnson MR, Kasper EK, Levy WC, Masoudi FA, McBride PE, McMurray JJ, Mitchell JE, Peterson PN, Riegel B, Sam F, Stevenson LW, Tang WH, Tsai EJ, Wilkoff BL. 2013 ACCF/AHA guideline for the management of heart failure: a report of the American College of Cardiology Foundation/American Heart Association Task Force on Practice Guidelines. J Am Coll Cardiol. 2013;62:e147–e239. doi: 10.1016/j.jacc.2013.05.019. [DOI] [PubMed] [Google Scholar]
- 18.Avery CL, Mills KT, Chambless LE, Chang PP, Folsom AR, Mosley TH, Ni H, Rosamond WD, Wagenknecht L, Wood J, Heiss G. Long-term association between self-reported signs and symptoms and heart failure hospitalizations: the Atherosclerosis Risk in Communities (ARIC) study. Eur J Heart Fail. 2010;12:232–238. doi: 10.1093/eurjhf/hfp203. [DOI] [PMC free article] [PubMed] [Google Scholar]
- 19.Zou G. A modified Poisson regression approach to prospective studies with binary data. Am J Epidemiol. 2004;159:702–706. doi: 10.1093/aje/kwh090. [DOI] [PubMed] [Google Scholar]
- 20.Breslow NE, Day NE. Statistical methods in cancer research Volume II–the design and analysis of cohort studies. IARC Sci Publ. 1987;(82):1–406. [PubMed] [Google Scholar]
- 21.Hebert K, Quevedo HC, Tamariz L, Dias A, Steen DL, Colombo RA, Franco E, Neistein S, Arcement LM. Prevalence of conduction abnormalities in a systolic heart failure population by race, ethnicity, and gender. Ann Noninvasive Electrocardiol. 2012;17:113–122. doi: 10.1111/j.1542-474X.2012.00492.x. [DOI] [PMC free article] [PubMed] [Google Scholar]
- 22.Walsh JA, 3rd, Prineas R, Daviglus ML, Ning H, Liu K, Lewis CE, Sidney S, Schreiner PJ, Iribarren C, Lloyd-Jones DM. Prevalence of electrocardiographic abnormalities in a middle-aged, biracial population: Coronary Artery Risk Development in Young Adults study. J Electrocardiol. 2010;43:385.e1–9. doi: 10.1016/j.jelectrocard.2010.02.001. [DOI] [PMC free article] [PubMed] [Google Scholar]
- 23.Katibi I, Clark E, Devine B, Lloyd S, Macfarlane PW. Comparison of QRS duration in African blacks and European Caucasians. Comput Cardiol. 2010;37:701–704. [Google Scholar]
- 24.Jeff JM, Brown-Gentry K, Buxbaum SG, Sarpong DF, Taylor HA, George AL, Roden DM, Crawford DC. SCN5A variation is associated with electrocardiographic traits in the Jackson Heart Study. Circ Cardiovasc Genet. 2011;4:139–144. doi: 10.1161/CIRCGENETICS.110.958124. [DOI] [PMC free article] [PubMed] [Google Scholar]
- 25.Bussink BE, Holst AG, Jespersen L, Deckers JW, Jensen GB, Prescott E. Right bundle branch block: Prevalence, risk factors, and outcome in the general population: Results from the copenhagen city heart study. Eur Heart J. 2013;34:138–146. doi: 10.1093/eurheartj/ehs291. [DOI] [PubMed] [Google Scholar]
- 26.Fleg JL, Das DN, Lakatta EG. Right bundle branch block: Long-term prognosis in apparently healthy men. J Am Coll Cardiol. 1983;1:887–892. doi: 10.1016/s0735-1097(83)80204-6. [DOI] [PubMed] [Google Scholar]
- 27.Sotoodehnia N, Isaacs A, de Bakker PIW, Dorr M, Newton-Cheh C, Nolte IM, van der Harst P, Muller M, Eijgelsheim M, Alonso A, Hicks AA, Padmanabhan S, Hayward C, Smith AV, Polasek O, Giovannone S, Fu J, Magnani JW, Marciante KD, Pfeufer A, Gharib SA, Teumer A, Li M, Bis JC, Rivadeneira F, Aspelund T, Kottgen A, Johnson T, Rice K, Sie MPS, Wang YA, Klopp N, Fuchsberger C, Wild SH, Leach IM, Estrada K, Volker U, Wright AF, Asselbergs FW, Qu J, Chakravarti A, Sinner MF, Kors JA, Petersmann A, Harris TB, Soliman EZ, Munroe PB, Psaty BM, Oostra BA, Cupples LA, Perz S, de Boer RA, Uitterlinden AG, Volzke H, Spector TD, Liu F-Y, Boerwinkle E, Dominiczak AF, Rotter JI, van Herpen G, Levy D, Wichmann HE, van Gilst WH, Witteman JCM, Kroemer HK, Kao WHL, Heckbert SR, Meitinger T, Hofman A, Campbell H, Folsom AR, van Veldhuisen DJ, Schwienbacher C, O’Donnell CJ, Volpato CB, Caulfield MJ, Connell JM, Launer L, Lu X, Franke L, Fehrmann RSN, te Meerman G, Groen HJM, Weersma RK, van den Berg LH, Wijmenga C, Ophoff RA, Navis G, Rudan I, Snieder H, Wilson JF, Pramstaller PP, Siscovick DS, Wang TJ, Gudnason V, van Duijn CM, Felix SB, Fishman GI, Jamshidi Y, Ch Stricker BH, Samani NJ, Kaab S, Arking DE. Common variants in 22 loci are associated with QRS duration and cardiac ventricular conduction. Nat Genet. 2010;42:1068–1076. doi: 10.1038/ng.716. [DOI] [PMC free article] [PubMed] [Google Scholar]
Associated Data
This section collects any data citations, data availability statements, or supplementary materials included in this article.