

Abstract
Endothelial-to-mesenchymal transition (EndMT) occurs during development and underlies the pathophysiology of multiple diseases. In tumors, unscheduled EndMT generates cancer-associated myofibroblasts that fuel inflammation and fibrosis, and may contribute to vascular dysfunction that promotes tumor progression. We report that freshly isolated subpopulations of tumor-specific endothelial cells (TEC) from a spontaneous mammary tumor model undergo distinct forms of EndMT in response to TGFβ stimulation. Whereas some TEC strikingly up-regulate alpha smooth muscle actin (SMA), a principal marker of EndMT and activated myofibroblasts, counterpart normal mammary gland endothelial cells (NEC) showed little change in SMA expression after TGFβ treatment. Compared with NEC, SMA+ TEC were 40 % less motile in wound healing assays and formed more stable vascular-like networks in vitro when challenged with TGFβ. Lineage tracing using ZsGreenCdh5-Cre reporter mice confirmed that only a fraction of vessels in breast tumors contain SMA+ TEC, suggesting that not all endothelial cells (EC) respond identically to TGFβ in vivo. Indeed, examination of 84 TGFβ-regulated target genes revealed entirely different genetic signatures in TGFβ-stimulated NEC and TEC cultures. Finally, we found that basic FGF (bFGF) exerts potent inhibitory effects on many TGFβ-regulated genes but operates in tandem with TGFβ to up-regulate others. EC challenged with TGFβ secrete bFGF which blocks SMA expression in secondary cultures suggesting a cell-autonomous or lateral-inhibitory mechanism for impeding mesenchymal differentiation. Together, our results suggest that TGFβ-driven EndMT produces a spectrum of EC phenotypes with different functions that could underlie the plasticity and heterogeneity of the tumor vasculature.
Keywords: Tumor angiogenesis, tumor endothelial cells, endothelial heterogeneity, endothelial mesenchymal transition, tumor microenvironment, TGFβ
Introduction
Endothelial-to-mesenchymal transition (EndMT) is defined as the loss of endothelial-specific factors and gain of mesenchymal features that accompany the morphogenesis of specific tissues, especially those of the heart (1). EndMT also occurs in various pathological conditions including cerebral cavernous malformations, cardiac and kidney fibrosis, vein stenosis, and cancer (2–7). In these diseased states, aberrantly regulated EndMT results in unscheduled conversion of endothelial cells (EC) into diverse mesenchymal-lineage cell types, especially myofibroblasts, that may dissociate from the vessel wall and can be found throughout the affected tissue (8–14). EndMT coincides with genome-wide reprogramming that allows EC to exist in a variety of phenotypic states but may also cause vascular dysfunction that contributes to disease progression (9,15,16).
The concept that EC may “drift” towards mesenchymal-like cell types was shown many years ago in transforming growth factor beta- (TGFβ) treated EC cultures (17). TGFβ, and other members of the TGFβ superfamily, impart plasticity to EC by activation of specific transcription factors (e.g. Snail, Slug, and Twist) that interact with chromatin modifiers to create genome-wide epigenetic reconfigurations (15,18). Whether acquisition of the mesenchymal program in EC is a partial and transient or stable and transmittable change in cellular specification is not clear. The context-dependency of TGFβ, combined with its cell-type specific activity, has made it challenging to understand how EC react to sustained TGFβ signaling, particularly in complex tissues such as tumors (19,20). In addition, EC responses to TGFβ may proceed differently in different types of EC owing to heterogeneous forms of mesenchymal differentiation throughout the vasculature that is tumor-type and/or tumor-stage dependent.
Recently, we isolated normal mammary gland EC (NEC) and mammary tumor EC (TEC) from a transgenic tumor model (21). We were surprised to find a wide range of mesenchymal-like genetic signatures among these different types of EC challenged with TGFβ in vitro. Furthermore, whereas some TGFβ-stimulated mesenchymal genes (e.g. smooth muscle actin alpha, SMA) were blocked by addition of basic fibroblast growth factor (bFGF), expression of other mesenchymal genes was augmented by the combination. These results require a refined assessment for how EndMT is defined across different vascular beds. In principle, EndMT may be characterized by a spectrum of intermediate and reversible mesenchymal-cell phenotypes, especially in pathological tissues. Moreover, EC resist specific conversion to SMA+ myofibroblast-like cells when challenged with TGFβ through secretion of bFGF; thus, EC maintain their own fate and differentiation by a self-regulatory mechanism that counteracts TGFβ activity.
Materials and methods
EC isolation, cell culture and media
Mammary NEC and TEC were isolated from C3-TAg (FVB/N C31-TAg) mice and FVB wild-type mice, respectively (21). We previously isolated prostate TEC from TRAMP mice (8), and K-Ras lung TEC were isolated from K-RasG12D mouse lung tumors (22). Fluorescently labeled acetylated low-density lipoprotein (DiI-Ac-LDL) (Biomedical Technologies) were incubated with lung TEC clones to examine cell purity under a fluorescent microscope (23). EC clones were maintained in 1 g/L D-glucose DMEM (LG-DMEM, Gibco) supplemented with 10 % fetal bovine serum (FBS), 10 % Nu-Serum IV (BD), 5 ng/mL bFGF (Peprotech), 10 ng/mL vascular endothelial growth factor A (VEGF) (Peprotech), and 20 USP units/mL heparin (Sigma). Mouse mesenchymal stem cells (MSC) were purchased from Gibco and were maintained in DMEM/F-12 (Gibco) with 10 % MSC-qualified FBS (Gibco). All media were supplemented with antibiotic–antimycotic (Gibco).
Unless otherwise stated, 5 ng/mL bFGF and/or 10 ng/mL TGFβ2 in 20 % FBS or 1 % FBS LG-DMEM was used to treat cells for 48 hours prior to protein or RNA extraction. BMP-2 (Peprotech), BMP-6 (Peprotech), and BMP-7 (Peprotech) were used at 100 ng/mL. Small-molecule inhibitors were added to the media for one hour before TGFβ2 treatment. Reagents used: TGFβ2R inhibitor (SB431542, Sigma), phosphoinositide 3-kinase (PI3K) inhibitor LY294002 (Sigma), Akt inhibitor VIII (EMD Millipore), Smad3 inhibitor SIS3 (Calbiochem), mammalian target of rapamycin (mTOR) inhibitor rapamycin (Sigma), MEK (MAPK/ERK kinase) 1/2 inhibitor U0126 (Calbiochem), bFGF neutralizing antibody (Millipore, 05-117), and FGF receptor (FGFR) kinase inhibitor (Calbiochem).
Real-time quantitative PCR (qPCR)
Total RNA isolation was completed using an RNeasy Mini Kit (Qiagen) according to the manufacturer’s instructions, and cDNA synthesis was carried out using an iScript cDNA Synthesis Kit (Bio-Rad). qPCR was run in triplicate in 10 μL/reaction with 2X Maxima SYBR Green (ThermoFisher) on an Applied Biosystems Step One Plus analyzer. The threshold cycle (Ct) values were determined by Step One Software 2.2.2 by Applied Biosystems. Ct values of Gapdh gene expression were used as an endogenous control. The relative expression of each gene was quantified using the formula: 2e(Ct of Gapdh – Ct of gene X) = fold increase of reference gene expression. Primer sequences are available upon request. Heat maps were generated using Gene-E (http://www.broadinstitute.org/cancer/software/GENE-E/.)
Western blots
Cells were lysed in RIPA buffer complemented with phosphatase and protease inhibitor cocktails (Sigma) for protein extraction. Protein concentrations were determined by Bradford assays, and ~ 30 μg per sample was used for Western blotting. For non-phosphorylated protein detection, membranes were blocked and antibodies were added in 5 % milk tris-buffered saline with 0.1 % Tween 20 (TBST), and for phosphorylated protein detection, 5 % bovine serum albumin (BSA) TBST was used. Membranes were incubated with primary antibodies at 4 °C overnight and then with secondary antibody at room temperature for one hour. Primary antibodies: 1:1000 mouse anti-SMA (Sigma, A5228), 1:1000 rabbit anti-phospho-Ser 465/467 SMAD2 (pSMAD2) (Cell Signaling, 3108), 1:1000 rabbit anti-phospho-Ser 423/425 SMAD3 (pSMAD3) (Millipore, 0713-89), 1:1000 rabbit anti-SMAD2 (Cell Signaling, 5339), 1:1000 rabbit anti-SMAD2/3 (Cell Signaling, 8685), 1:1000 rabbit anti-fibronectin (Abcam, ab2413), 1:1000 rabbit anti-bFGF (Sigma), 1:1000 rabbit anti-phospho-Thr 202/204 ERK (pERK) 1/2 (Cell Signaling, 4370), 1:2000 rabbit anti-ERK1/2 (Cell Signaling, 9102), 1:1000 rabbit anti-VEGF receptor 2 (VEGFR2) (Cell Signaling, 55B11), and 1:2500 rabbit anti-GAPDH (Cell Signaling, 5174). Secondary HRP-conjugated antibodies: 1:10,000 horse anti-mouse and 1:10,000 goat anti-rabbit antibodies (Vector Laboratories).
Wound closure scratch assay and live imaging
Cells were plated at 1.0 × 10⁵ cells/well in 6-well plates. Twenty-four hours later, the monolayer was gently scratched with a 200 μL pipette tip across the center of the well. An Olympus IX70 Inverted Live Cell System was used for time-lapse imaging of the cells at a minimum of four locations/well at 20-minute intervals until the scratch wound was completely closed. The images were acquired with the Volocity 6.2 software package (Perkin Elmer) and analyzed using TScratch software (available at: http://www.cse-lab.ethz.ch) according to the developers’ instructions. (24). The open areas on the images were quantified with the software’s automated image analysis and expressed as relative area closure with an arbitrary area unit assigned by the software. Phase contrast images were captured with a Hamamatsu ORCAR2 camera.
Matrigel tube formation assay
Growth factor-reduced Matrigel (Corning, 356230) was first plated into 96-well plates and allowed to set for 30 minutes at 37°C. Cells were pre-incubated in 10 % FBS medium with or without TGFβ2 for 16 hours before being detached and plated in 10 % FBS medium with or without TGFβ2 in Matrigel-containing wells in triplicate at a density of 1.0 × 10⁴ cells/well. Phase contrast images (4×) were taken on an Evos® XL Core Cell Imaging System (Life Technologies) at ~ seven hours. Images were processed with ImageJ using the “find edges” feature to enhance the contrast. Quantification was done by counting vessel-like cords that were formed by at least two non-adjacent cells. A 3 × 3 grid was superimposed on each image, and at least four random squares were counted per image to obtain an average number of tubes per image.
Flow cytometry
Flow cytometry was performed using a BD Accuri® C6 Flow Cytometer as previously described with data analyzed post-hoc using FloJo (version X) (21). Antibodies: PE rat anti-mouse CD31 (BD Pharmingen, 553373), PE rat anti-mouse CDH5 (VE-cadherin) (BD Pharmingen, 562243), and rat anti-mouse IgG (BD Pharmingen, 55393) at a ratio of 1.5 μL antibody to 100 μL of cell suspension.
Tumor studies in mice
C3-TAg mice were provided by the Mouse Phase 1 Unit from the Lineberger Comprehensive Cancer Center at UNC Chapel Hill. Tumors were harvested when mice were approximately five months of age. ZsGreenCdh5-Cre mice were generated by crossing R26 ZsGreen mice (Jackson Laboratory, 007906) and Cdh5-Cre mice (Jackson Laboratory, 006137). E0771 murine mammary tumor cells (CH3 BioSystems, 940001) or PyVMT tumor cells isolated from the PyVMT mice were suspended in Matrigel (Corning, 356234) at a density of 1.0 × 10⁷ cells/mL, and 100 μL of cell suspension was orthotopically injected into the mammary fat pats of seven week-old female ZsGreenCdh5-Cre mice (25). Tumors were harvested when they reached 1 cm3 in size, and normal mammary glands from age-matched littermates were harvested at the same time. Lung tumors were obtained from K-RasG12D mice (22). Tissues were fixed in 4 % paraformaldehyde and cryoprotected in 30 % sucrose-phosphate buffered saline (PBS) before OCT embedment and cryosection. All mouse experiments were carried out under approval of the Institutional Animal Care and Use Committee at UNC-Chapel Hill.
Immunofluorescence (IF)
IF methods were described previously (8). Antibodies used were: 1:100 rat anti-mouse CD31 antibody (BD, 550274), 1:200 Alexa Fluor® 488 goat anti-rat antibody (Invitrogen, A11006), and 1:500 monoclonal mouse anti-α-smooth muscle actin (SMA) Cy3 antibody (Sigma, C6198). Slides were mounted with Vectashield Hardset Mounting Medium with DAPI (Vector Labs) and imaged on a Zeiss CLSM 710 or 700 Spectral Confocal Laser Scanning Microscope.
Three-dimensional confocal microscopy
Sections were stained as described above, and imaged on a Zeiss CLSM 710 Spectral Confocal Laser Scanning Microscope using cubic voxels to capture the z-dimension. Three-dimensional projections, orthogonal slices, and the supplementary movie (Movie S1) were generated using ImageJ (http://imagej.nih.gov/ij/).
TGFβ pathway qPCR array
The array was carried out in duplicate using the Mouse TGFβ Signaling Targets RT2 Profiler™ PCR Array (SA Biosciences, PAMM-235Z) according to the manufacturers’ instructions. Cells were plated and exposed to TGFβ2 and/or bFGF for 48 hours. Total RNA was purified with an RNeasy Mini Kit (Qiagen) and cDNA synthesis was performed with an iScript cDNA Synthesis Kit (Bio-Rad). ABI 7900HT Quantitative PCR System was used for the qPCR array and the data were analyzed with SA Biosciences’ RT2 Profiler™ PCR Array Data Analysis Online Software.
Conditioned-media (CM) treatment of TEC-H8
CM collected from TEC-H8 treated with or without TGFβ2 (10 ng/mL) for 48 hours were concentrated using Amicon Ultra-15 Centrifugal Filter Unit (Millipore) or Pierce Protein Concentrators (Thermo Scientific). For Western analysis of bFGF, 25 μL of the concentrated CM was used, and the remaining concentrated CM were then divided equally to treat a new batch of TEC-H8 for 48 hours in the presence or absence of freshly added TGFβ2. Cell lysates were collected for Western and qPCR analyses.
Statistics
All values are expressed as ± standard error of mean (SEM). Results were analyzed by a student’s t-test or ANOVA using GraphPad Prism 5 software. P values less than 0.05 were considered significant.
Results and discussion
Isolation of TEC with an intermediate EndMT phenotype
We recently isolated multiple NEC and TEC clones from wild-type mice and spontaneous mammary tumors in C3-TAg mice using a high-fidelity cloning method producing pure EC populations uniformly positive for CD31 and CDH5 (Fig. 1A and 1B) (21). Surprisingly, a number of TEC clones showed elevated basal mRNA expression of the EndMT and myofibroblast differentiation marker, SMA (Acta2) (Fig. 1C). On the other hand, expression of endothelial markers Cd31 and Vegfr-2 were variable among all NEC and TEC clones and did not correlate with the levels of Acta2 mRNA (Fig. 1C). When challenged with TGFβ2, TEC-H8 (a clone with high basal SMA expression) up-regulated SMA protein expression, whereas an NEC clone (B12) and TEC-A2 (a SMA-low TEC clone) were relatively unresponsive (Fig. 2A). TEC-H8 were responsive to all three TGFβ isoforms and similar results were obtained using an additional mammary TEC clone with high SMA mRNA (TEC-D8) and mesenchymal-like prostate TEC previously described by us (Fig. 2B and 2C) (8). As non-EC (e.g. SMA+ fibroblast) contamination can occur during EC isolation, we performed staining with SMA and CD31 to exclude this possibility. All individual cells in the TEC clone examined expressed CD31, and confocal images clearly revealed co-localization of SMA+ stress fibers and CD31 in the same cells post-TGFβ2 treatment (Fig. 2D). SMA+ EC have been observed in the luminal surface of healthy thoracic aorta, but their density is markedly increased in atheromatous aorta (26). The appearance of SMA+ EC correlates with a pro-inflammatory state, such as in tumors or fibrosis, where TGFβ is also highly up-regulated (27,28). It is possible that the tumor microenvironment promotes the conversion of SMA− EC into SMA+ EC, or favors the enrichment of rare but pre-existing SMA+ EC located throughout the mammary gland vasculature.
Figure 1. Isolation and characterization of NEC and TEC clones.
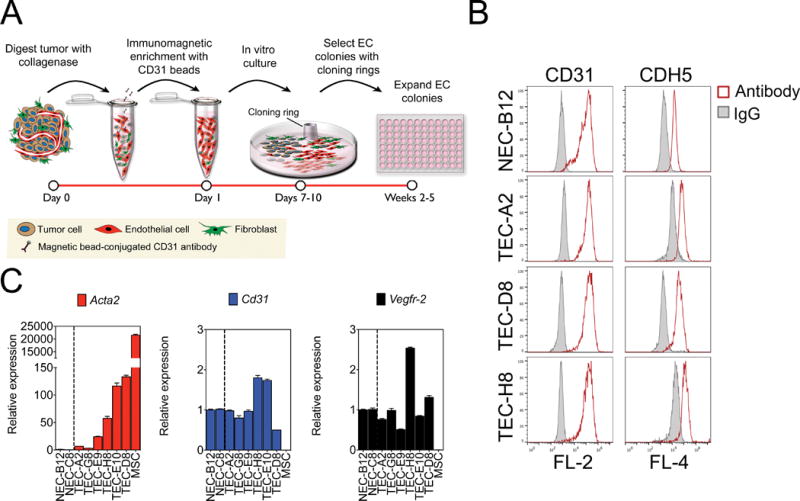
(A) Schematic diagram of EC isolation procedure. (B) Representative CD31 and CDH5 FACS histogram plots of NEC and TEC clones. Open curves represent cells stained with CD31 or CDH5 antibodies, and solid curves indicate FACS histogram plots of cells stained with an isotype-matched control antibody. (C) Relative mRNA expression by qPCR of Acta2 (SMA), Cd31, and Vegfr-2 in NEC and TEC clones. Gapdh was used as an endogenous control and relative mRNA expression of each gene was expressed as fold increase compared to NEC. MSC were used as a positive control.
Figure 2. Subpopulations of EC undergo a spectrum of EndMT in response to TGFβ2 stimulation.
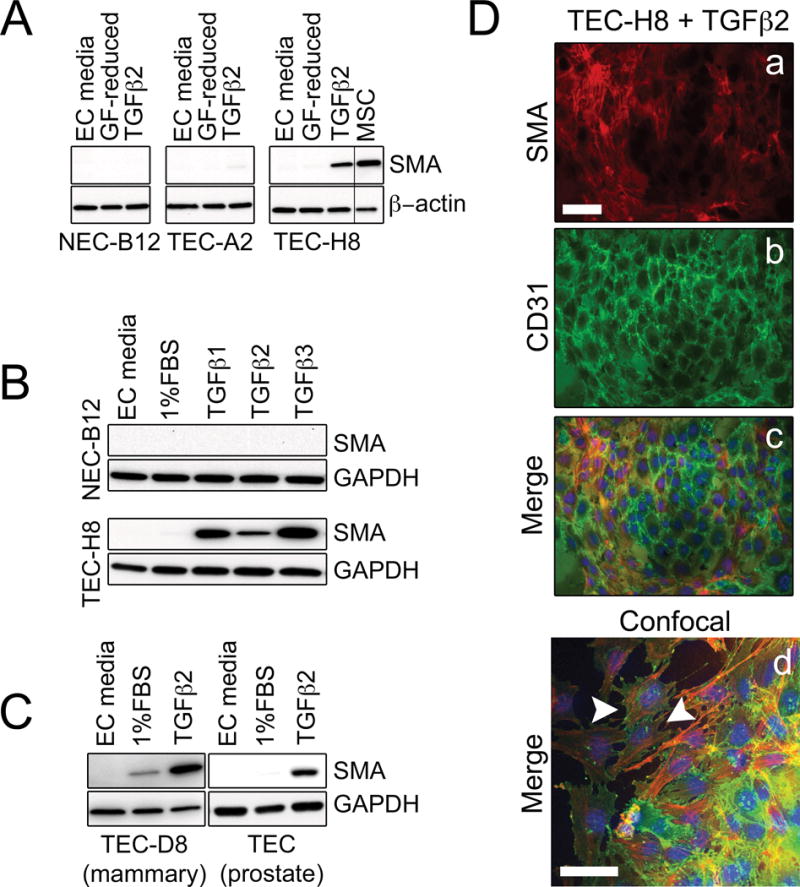
(A) Western blots showing that TGFβ increases SMA protein expression in TEC-H8, a clone that has high basal SMA mRNA levels. Three clones representing NEC (NEC-B12), SMA-low TEC (TEC-A2), and SMA-high TEC (TEC-H8) were treated with 10 ng/mL TGFβ2 in growth factor (GF)-reduced media (20 % FBS LG-DMEM) for 48 hours before being subjected to Western blotting. MSC were used as a positive control. (B) Western blots showing SMA expression in NEC-B12 and TEC-H8 after stimulation with 10 ng/mL TGFβ1, TGFβ2, or TGFβ3 for 48 hours. (C) Western blots showing SMA expression in TEC-D8 and prostate TEC isolated from TRAMP mice after stimulation with 10 ng/mL TGFβ2 for 48 hours. (D) Immunofluorescence images of TEC-H8 stimulated with 10 ng/mL TGFβ2 for 48 hours. Cells were stained with SMA (red, a), CD31 (green, b), and DAPI (blue) as shown in the merged image (c). (d) Merged confocal image of TGFβ2-stimulated TEC-H8. The white arrowheads indicate co-localization of SMA (red) and CD31 (green) in the same cell. Scale bars = 50 μm.
To test whether there were any functional differences between SMA-high TEC and NEC, we carried out a time-lapse wound healing migration assay using TEC-H8 and NEC-B12 clones. NEC-B12 challenged with TGFβ2 showed little difference in migration compared to untreated controls whereas TEC-H8 migration was inhibited by ~ 40 % (Fig. 3A). TGFβ2 also markedly enhanced TEC-H8 contraction in collagen gel contraction assays, while exerting little effect on NEC-B12 (unpublished data, DJK). These results are consistent with previous studies showing impaired migration of SMA+ myofibroblasts and are perhaps related to higher contractility and increased focal adhesions associated with filamentous actin stress fibers (29–31). In contrast, formation of in vitro vascular structures was inhibited by 60–80 % in NEC-B12 and SMA-low TEC (TEC-A2) challenged with TGFβ2 but were increased by 40 % in TEC-H8 (Fig. 3B). Taken together, our data suggest that subpopulations of EC are differentially receptive to TGFβ stimulation: some are characterized by high SMA induction, decreased migration, and stabilized vascular structures whereas others respond oppositely.
Figure 3.
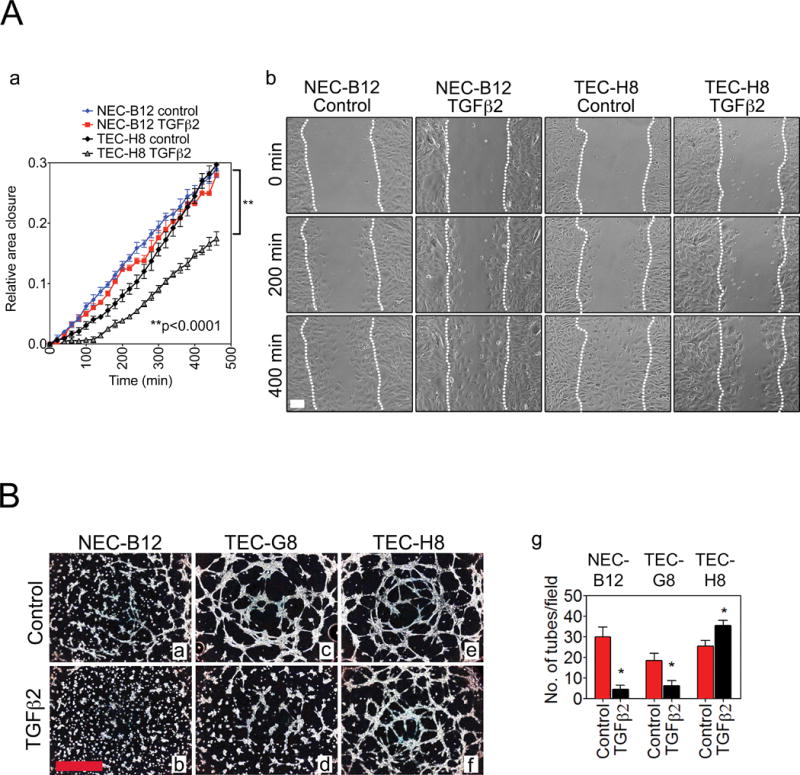
(A) (a) Wound closure rates of NEC-B12 and TEC-H8 treated with or without TGFβ2. (b) Representative images of the wound closure at indicated time points. White dotted lines indicate the migration fronts of cells. Cells were exposed to 10 ng/mL TGFβ2 in 20 % FBS LG-DMEM for ~ 30 minutes before imaging (n = 3). Scale bar = 100 μm. Statistical significance was determined by two-way ANOVA (**P < 0.001). (B) Representative phase-contrast images of Matrigel tube formation of NEC (a, b), TEC-G8 (c, d), and TEC-H8 (e, f) with or without TGFβ2 treatment. (g) Quantification of tubes by counting the number of tubes per field. Scale bar = 1 mm. n = 3–4 observations. Statistical significance was determined using a Student’s t test (*P < 0.05).
TGFβ induces diverse genetic signatures in different types of EC
We next used qPCR to compare the expression pattern of 12 mesenchymal marker genes in TGFβ2-treated NEC-B12 versus TEC-H8 cultures. Strikingly, we found the pattern of gene expression to be entirely opposite when these genes were hierarchically clustered (Fig. 4A). For example, whereas NEC-B12 strongly up-regulated mesenchymal markers including calponin 1 (Cnn1), transgelin (Tagln), cadherin 11 (Cdh11), and endosialin (Cd248), TEC-H8 strongly increased the expression of Acta2 (SMA), fibronectin 1 (Fn1), platelet-derived growth factor (PDGF) receptor β (Pdgfrβ), and desmin (Des). Basal FN1 protein expression was also slightly higher in TEC-H8 and was further increased after TGFβ2 stimulation as shown by Western blotting (Fig. S1A). Another cluster of mesenchymal genes including tenascin c (Tnc), endoglin (Eng), and vimentin (Vim) were slightly elevated in TEC-H8 and their levels were variably altered by TGFβ2 treatment. The EC markers Cdh5, Cd31, and Vegfr1 were either moderately decreased or unchanged by TGFβ2 challenge. Longer periods of TGFβ2 treatment could result in sustained down-regulation of these and other EC-specific genes. Notably, the pericyte marker Ng2 was not detected in NEC or TEC-H8 with or without TGFβ2 treatment, ruling out the presence of contaminating pericytes in these cultures (data not shown).
Figure 4. Only a fraction of tumor vessels contain SMA+ TEC.
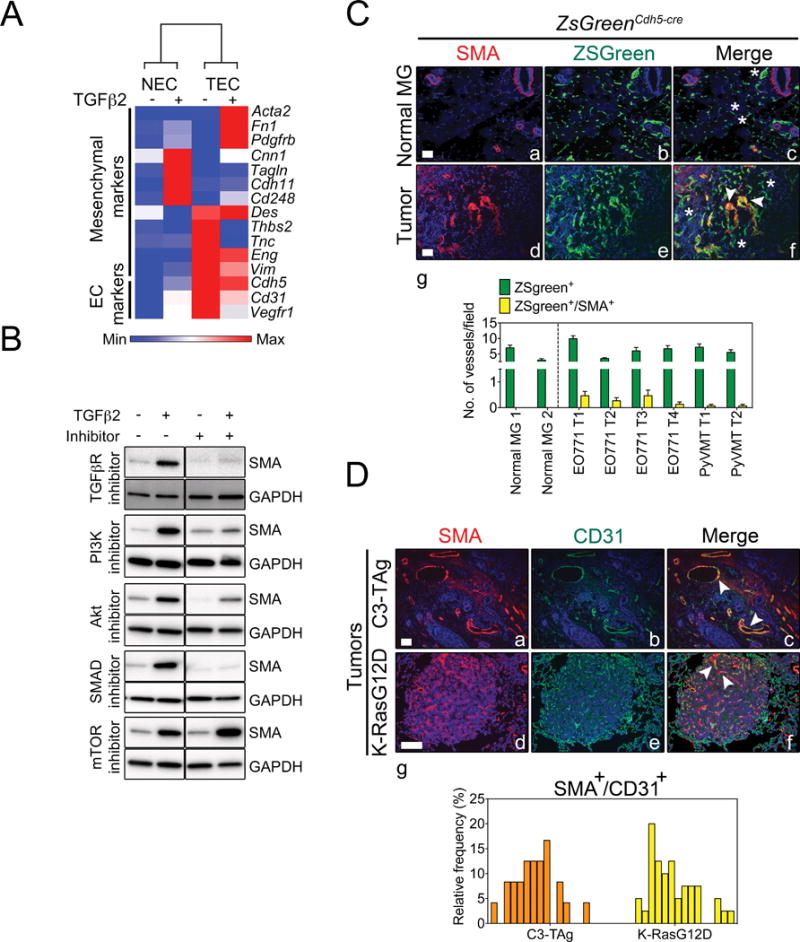
(A) Heat-map representation of mesenchymal and endothelial marker mRNA levels by qPCR in NEC-B12 and TEC-H8 clones treated with or without of TGFβ2. Gapdh was used as an endogenous control. The heat map was generated using Gene-E software. (B) Western blots demonstrating that TGFβ2 up-regulates SMA expression in TEC-H8 via SMAD2/3 and PI3K pathways. TGFβ2R inhibitor (SB431542): 10 μM, PI3K inhibitor (LY294002): 3 μM, Akt inhibitor VIII: 5 μM, SMAD 3 inhibitor (SIS3): 3 μM, and mTOR inhibitor (rapamycin): 100 nM. (C) Representative immunofluorescent images of normal mammary glands (Normal MG) (a–c) and mammary tumors (d–f) from lineage-traced ZsGreenCdh5-cre mice showing SMA staining (red), blood vessels that are tagged with ZsGreen (green), and nuclear staining with DAPI (blue). Mammary tumors were induced by orthotopic injection of E0771 or PyVMT tumor cells in ZsGreenCdh5-cre mice. The arrowheads indicate ZsGreen+/SMA+ vessels and asterisks indicate ZsGreen+/SMA− vessels. (g) Quantification of vessels containing ZsGreen+/SMA+ cells in normal mammary glands and mammary tumors. (D) Representative immunofluorescent staining of SMA (red), CD31 (green), and DAPI (blue) in spontaneous C3-TAg mammary tumors (a–c) and K-RasG12D lung tumors (d–f). The arrowheads indicate ZsGreen+/SMA+ vessels. Scale bars = 100 μm. (g) Frequency distribution of vessels containing CD31+/SMA+ cells in C3-TAg and K-RasG12D tumors. Each bar represents one microscopic field of view.
Because both SMAD-dependent and SMAD-independent pathways are implicated in mesenchymal gene regulation during EndMT, we used pharmacological inhibitors to evaluate different mechanisms of TGFβ2-induced SMA expression in TEC (32). We found that TGFβ regulated SMA expression in TEC via PI3K, Akt, and SMAD3, but not through mTOR (Fig. 4B). To determine whether differential expression of SMADs could account for the divergent responses to TGFβ2 in NEC versus TEC cultures, we assessed levels of pSMAD2 and pSMAD3 using Western blotting. We found similar basal pSMAD2 and pSMAD3 levels in both NEC-B12 and TEC-H8 cultures (Fig. S1B and S1C). TGFβ2 further induced SMAD2 and SMAD3 phosphorylation in the two cell types to a similar level, with comparable total SMAD2/3 expression, indicating that TGFβ2-signaling is not altered in TEC-H8 compared to NEC-B12. However, TGFβ2-activated SMADs regulate distinct groups of target genes in NEC versus TEC suggesting that either additional cofactors are differentially recruited to mesenchymal gene promoters in the two cell types or that a different set of mesenchymal genes may be poised for transcription in different types of EC.
Only a fraction of tumor vessels contain SMA+ endothelial cells in vivo
We found that primary EC clones displayed a spectrum of SMA expression upon TGFβ2 stimulation suggesting that not all EC respond identically to TGFβ2 challenge. To test this possibility in vivo, we fate-mapped tumor endothelium using ZsGreenCdh5-Cre reporter mice to indelibly mark all EC (Fig. S2A and S2B). Three-dimensional confocal imaging of these tumors at high magnification clearly demonstrated that SMA and ZsGreen localized in the same cells (Fig. S2C, S3, and Movie S1). Consistent with our in vitro findings, we observed that in two different orthotopically implanted mammary tumors, only a minor fraction (~ 1–10 %) of tumor blood vessels contained SMA+ EC, whereas few if any SMA+ EC were found in normal mammary glands (Fig. 4C). On the other hand, blood vessels in spontaneous C3-TAg mammary tumors and K-RasG12D lung tumors showed a broad range (0–25 %) of CD31 and SMA co-expression in EC (Fig. 4D). The higher frequency of CD31+/SMA+ EC in these genetically engineered mouse (GEM) models could be due to the longer tumor growth period, or in the case of lung, be related to underlying plasticity inherent within the vascular bed (i.e. different vascular beds show differential proclivity to undergo EndMT). However, it is challenging to discriminate between SMA+ pericytes and the closely underlying CD31+ EC using immunostaining in these models and these results must be interpreted with caution; therefore the frequency of CD31+/SMA+ EC in these GEM models could be overestimated.
These results suggest that EC variably acquire SMA expression in the tumor models we evaluated, but SMA+ EC may be more common in other tumor types; for example, in pancreatic tumors where fibrosis is a prominent feature and the percentages reported are markedly higher (~ 40 %) (5). SMA+ EC might appear only transiently during different stages of tumor progression, or are generated continuously, but can revert to SMA− EC depending on the balance of EndMT promoting (or inhibiting) factors present in the tumor microenvironment. Though ZsGreenCdh5-Cre mice are a high-fidelity EC lineage tracing model, it is also conceptually possible that SMA+ fibroblasts or other mesenchymal-lineage cells may acquire EC markers through mesenchymal-endothelial transition (MEndT), which is a reverse process of EndMT. While EndMT has been observed in a wide range of conditions, the phenomenon of MEndT in tumors is still a matter of debate (33). In contrast to EndMT which may arise spontaneously in vitro, generation of EC from lineage-committed mesenchymal cells requires enforced induction of multiple EC-selective transcription factors in addition to TGFβ inhibition, indicating that MEndT demands restrictive conditions and precise temporal activation of specific regulatory factors (34). Therefore, SMA+ EC in our model are more likely to be originated from endothelial-lineage cells via EndMT rather than mesenchymal-lineage cells through MEndT.
bFGF opposes the expression of some TGFβ target genes but augments the expression of others
Similar to epithelial-to-mesenchymal transition (EMT), we expected that conversion of EC to mesenchymal-like cells was dynamic and could be reversed upon removal of TGFβ2 from the culture medium. Indeed, we found that when TGFβ2 was removed and cells were returned to their normal growth medium which contains bFGF (EC media), SMA expression was rapidly lost and TEC regained their typical EC morphology (Fig. S4A and S4B). The same cell population up-regulated SMA again after being returned to TGFβ2-containing media, indicating that some TEC may readily morph between SMA− endothelial and SMA+ mesenchymal-like phenotypes. We further determined that bFGF, but not VEGF, suppressed TGFβ2-induced SMA expression (Fig. 5A). Similar to interstitial cells in the heart, bFGF neutralized TGFβ2-stimulated SMA expression in TEC at 500 pg/mL, a concentration that was 20-fold lower than the TGFβ2 concentration added to the culture medium (Fig. 5B) (35). Remarkably, acidic FGF (aFGF), the closely related isoform of bFGF, did not neutralize SMA expression in TGFβ2-challenged cells at the same concentrations. Suppression of TGFβ2-induced SMA expression by bFGF was confirmed at the protein level by immunofluorescence (Fig. 5C). Simply removing bFGF from the culture medium promoted TEC to drift towards a mesenchymal-like phenotype indicated by a moderate increase in SMA expression, especially in cells maintained at subconfluent conditions (Fig. S4C). Moreover, these subconfluent cells were highly receptive to TGFβ stimulation compared to confluent cultures and showed robust SMA induction and more pronounced VEGFR2 suppression (Fig. S4C), indicating that loss of cell–cell contact enhances TGFβ responses. Thus, bFGF functions both as a potent EC mitogen and a “specification factor” that prevents EC drift towards mesenchymal-like cell types, particularly in the presence of TGFβ.
Figure 5. bFGF opposes the expression of some TGFβ target genes but augments the expression of others.
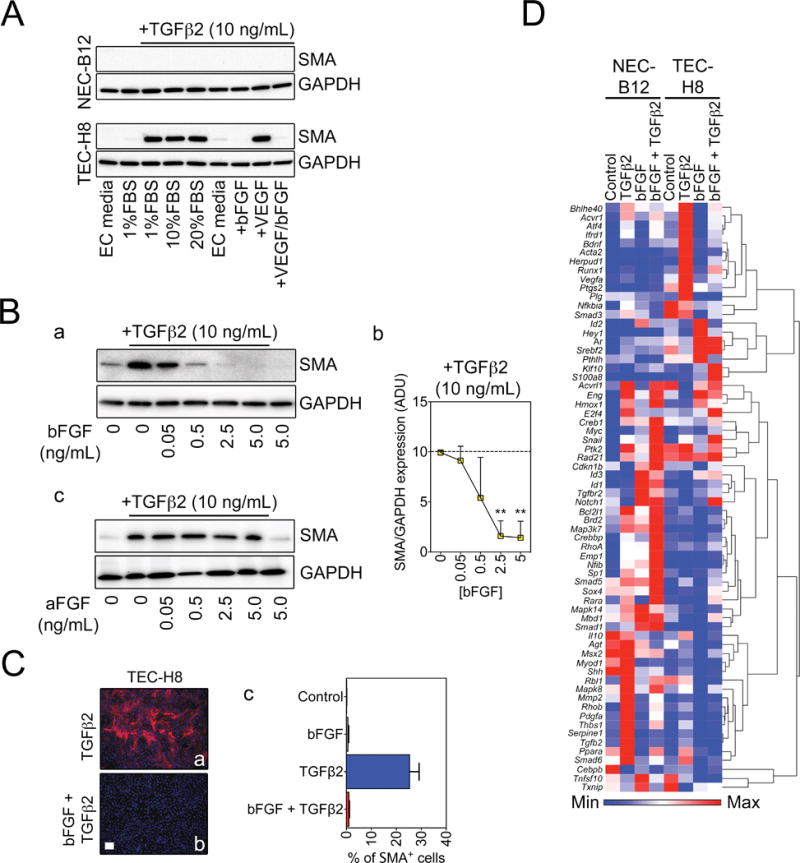
(A) Western blots showing that bFGF but not VEGF blocks SMA protein expression in TEC-H8. (B) (a) Representative Western blots demonstrating that bFGF suppresses TGFβ2-induced SMA expression in a dose-dependent manner. (b) Densitometry quantification of SMA expression (n = 3). Statistical significance was determined using One-way ANOVA with Bonferroni post test (**P < 0.01). ADU: arbitrary density units. (c) Western blots showing that aFGF does not suppress TGFβ2-induced SMA expression. (C) Representative immunofluorescent images of SMA expression in TEC-H8 stimulated with TGFβ2 in the absence (a) or presence (b) of bFGF. (c) Quantification of SMA+ cells from immunofluorescence. Scale bar = 100 μm. (D) Heat map and hierarchical clustering of gene expression of NEC and TEC-H8 clones analyzed using the Mouse TGFβ Signaling Targets RT2 Profiler™ PCR Array. Cells were stimulated for 48 hours with TGFβ2 and/or bFGF as indicated, and the arrays were performed in duplicate. Results were normalized and log-transformed, and genes were clustered using Pearson’s correlation.
Next, we carried out a TGFβ2 pathway qPCR array to comprehensively assess the expression of 84 TGFβ2 target genes in NEC versus TEC cultures, either with or without addition of bFGF. The results showed that, as predicted, TGFβ2 induced distinct expression patterns in NEC versus TEC cultures (Fig. 5D). Furthermore, while bFGF counteracts TGFβ2-induced expression of the mesenchymal genes Acta2 and thrombospondin 1 (Thbs1), TGFβ2 and bFGF synergistically activate other genes such as Notch1 and S100a8, which were shown previously to regulate tumor angiogenesis (Fig. 5D) (36,37). While repressing SMA, bFGF rescued the expression of Vegfr-2, which is suppressed by TGFβ2 challenge; however, bFGF only marginally down-regulated expression of the transcription factor Snail, which was previously identified as a master regulator of EndMT (Fig. S4D) (38). Interestingly, bFGF expression was increased by TGFβ2 stimulation, suggesting a possible autocrine or paracrine feedback loop in EC to counteract TGFβ2-induced expression of specific target genes, namely SMA (Fig. S4D).
To further confirm the protective role of bFGF in neutralizing TGFβ-induced SMA expression, we examined gene expression patterns in an additional C3-TAg TEC clone with relatively low basal SMA mRNA (TEC-G8). bFGF completely suppressed TGFβ-induced SMA expression in TEC-G8, even though the SMA levels were significantly lower than those in the SMA+ clone TEC-H8 (Fig. S5A and S5B). To assess the interaction between bFGF and TGFβ in EC derived from a different tumor model, we isolated lung TEC from K-RasG12D mouse lung tumors (22). All clones were virtually 100 % positive for DiI-Ac-LDL uptake and CD31, and strongly expressed VEGFR2 (Fig. S6A and S6B). Interestingly, unlike C3-TAg TEC clones, the K-Ras TEC clones showed elevated basal SMA protein that was detectable by Western blotting even in EC media that contained bFGF, suggestive of a “partial” EndMT phenotype in EC subpopulations derived from lung. The expression of SMA and other myofibroblast markers including Col1a1, Fn1, and Tagln in these K-Ras clones was further stimulated by TGFβ2 in the absence of bFGF, although to a lesser extent when compared to SMA+ mammary TEC (Fig. S6B and S6C). Addition of bFGF variably antagonized the effect of TGFβ on these genes, indicating that bFGF may act through similar pathways in different types of EC to maintain EC fate (Fig. S6C). Although Twist1 and Twist2 have been implicated in the induction of mesenchymal genes during EndMT and EMT; surprisingly, we did not observe an up-regulation of Twist1 or Twist2 by TGFβ (39). It is possible that induction of these genes in EC requires prolonged stimulation with TGFβ or they play only a marginal role during EndMT.
Previous studies have demonstrated that bFGF can antagonize TGFβ through the MAPK/ERK kinase pathway to suppress fibrogenic effects in epithelial cells and revert EMT, a process closely related to EndMT (40). Providing a further link between bFGF and TGFβ signaling, basal SMAD2 phosphorylation and TGFβR1 levels are increased when FRS2, an FGFR co-activator, is depleted using shRNA (41). In lymphatic EC, bFGF was reported to suppress TGFβ-stimulated SMAD2 activation via MAPK signaling (42). However, we found that although bFGF strongly induced EKR1/2 activation, it exerted no observable effects on TGFβ2-stimulated SMAD2 phosphorylation and only weakly reduced SMAD3 phosphorylation after a 60-minute TGFβ2 stimulation (Fig. S7A). Furthermore, inhibition of MAPK/ERK only mildly disabled the opposing effect of bFGF on TGFβ-induced SMA (Fig. S7B), indicating that bFGF may counteract TGFβ signaling through additional mechanisms.
Bone morphogenetic proteins (BMPs), which are members of the TGFβ superfamily, can interact synergistically or antagonistically with TGFβ to fine-tune cellular differentiation. For example, BMP-2 controls cardiac valve formation through Snail1-mediated EMT during heart development, while BMP-7 was reported to attenuate TGFβ-induced EndMT in cardiac fibrosis (4,43). In addition, BMP-6 acts as a major inhibitor of renal fibrosis as loss of BMP-6 increases SMA and FN1 expression in obstructed kidneys (44). However, we found that treatment with BMP-2, 6, or 7 did not overly affect SMA or FN1 expression stimulated by TGFβ2 in EC (Fig. S7C), suggesting that interaction between TGFβ and BMP signaling may be cell-type dependent. More specifically, different types of EC may respond differently to combinations of TGFβ and BMP signals. Taken together, our results suggest that EndMT, while sharing many features with EMT, is a distinctly regulated process that is variably regulated in different vascular beds, or in different disease settings.
EC challenged with TGFβ secrete their own bFGF which suppresses mesenchymal-like differentiation in secondary cultures
Because bFGF potently blocks TGFβ-stimulated conversion to SMA+ mesenchymal cells, and EC up-regulate bFGF in response to TGFβ, we asked whether a cell autonomous mechanism in EC could counteract TGFβ challenge. Consistent with our findings, a recent study using microarrays also showed that EC challenged with TGFβ up-regulate bFGF mRNA (2). First, we confirmed that TGFβ2 dose-dependently increased bFGF mRNA expression, with a maximum ~ 10-fold increase after 10 ng/mL TGFβ2 treatment (Fig. 6A). TGFβ2 also time-dependently increased bFGF expression, with maximum levels peaking at ~ 10-fold above untreated control cells after 48 hours. Next, we harvested the conditioned medium (CM) and cellular lysates of TGFβ2-challenged TEC. We found a striking time-dependent increase in bFGF secretion and a slight increase in bFGF expression in the cellular lysates after TGFβ2 stimulation (Fig. 6B). Notably, we observed that secreted bFGF migrated at three different molecular weights, which is consistent with a previous study reporting multiple splice variants of bFGF (45).
Figure 6. EC challenged with TGFβ secrete their own bFGF which suppresses mesenchymal-like differentiation in secondary cultures.
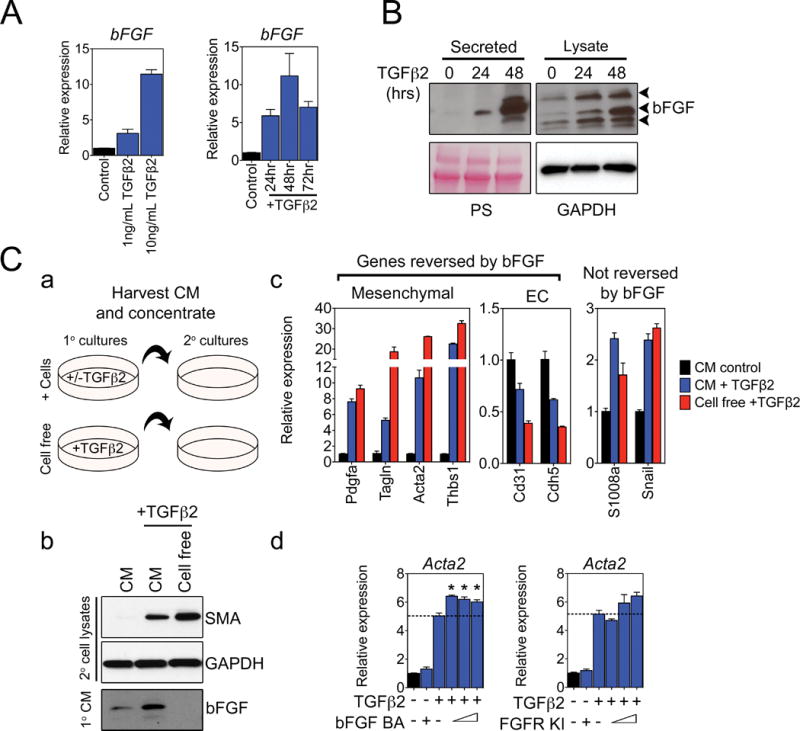
(A) Dose- and time-dependent induction of bFGF mRNA expression in TEC-H8 challenged with TGFβ2. In the dose-response experiment, cells were treated with increasing concentrations of TGFβ2 for 48 hours, and in the time-dependent experiment, cells were stimulated with 10 ng/mL TGFβ2. (B) Western blots showing secreted and intracellular bFGF in TEC-H8 challenged with 10 ng/mL TGFβ2 for the indicated times. Ponceau staining (PS) and GAPDH were used as loading controls for secreted proteins and cell lysates, respectively. The arrowheads indicate bFGF isoforms of different molecular weights. (C) Secondary TEC-H8 culture treatments with conditioned media (CM) obtained from TEC-H8 challenged with TGFβ2. (a) Schematic diagram of the CM experiment. Media conditioned by TEC-H8 stimulated with or without TGFβ2, and media containing only TGFβ2 were concentrated and used to treat secondary TEC-H8 cultures for 48 hours. (b) Western blot of SMA expression in the secondary TEC cultures treated with CM or cell-free media, and Western analysis of secreted bFGF in the CM and cell-free media. (c) qPCR analysis of changes in mRNA expression in secondary TEC-H8 cultures treated with CM or cell-free media. (d) qPCR analysis of Acta2 (SMA) mRNA expression in TEC-H8 treated with increasing doses of either a bFGF blocking antibody (BA) or a FGFR kinase inhibitor (KI) in the presence of 10 ng/mL TGFβ2 for 48 hours. From left to right: the bFGF BA concentrations are 0 μg/mL, 20 μg/mL, 0 μg/mL, 10 μg/mL, 15 μg/mL, and 20 μg/mL, and the FGFR KI concentrations are 0 nM, 200 nM, 0 nM, 40 nM, 120 nM, and 200 nM. Graphs are representative of three independent experiments. Error bars represent SEM (n = 3). Significance was determined using a one-way ANOVA and is indicated by an asterisk (P < 0.05).
To determine whether EC-derived bFGF could oppose TGFβ2 activity, we challenged TEC cultures with TGFβ2 and then harvested the CM to re-challenge secondary cultures (Fig. 6C, a). We found that CM collected from TEC stimulated with TGFβ2 induced ~ two-fold less SMA expression in secondary cultures treated with cell-free media containing equal amounts of TGFβ2 (Fig. 6C, b–c). The decrease in SMA expression in secondary cultures correlated with the presence of secreted bFGF protein in the CM. qPCR analysis of additional mesenchymal and EC genes, including Tagln, Pdgfa, Thbsp1, Cd31, and Cdh5, further showed that the CM of TGFβ2-challenged primary cultures could oppose the effects of TGFβ2 in secondary cultures. In contrast, S1008a, which can be induced synergistically by TGFβ2 and bFGF as revealed by the TGFβ-pathway array (refer to Fig. 5D), showed a similar expression pattern after the CM treatment, while the expression of Snail was not affected. To test if the TGFβ2-antagonizing effect of the CM was due specifically to an increased bFGF production by TEC, we used a bFGF blocking antibody (BA) and an FGFR kinase inhibitor (KI) to neutralize bFGF activity. As expected, blocking bFGF signaling by either compound increased TGFβ2-stimulated SMA mRNA expression in TEC (Fig. 6C, d). However, neutralizing bFGF with a BA or KI only had a modest effect on SMA expression, possibly because SMA mRNA levels were already maximized by the addition of TGFβ2.
Our results have shown that EC exhibit heterogeneity in their responses to TGFβ: some express high basal SMA and react to TGFβ by generating SMA+ myofibroblast-like cells with distinct functions, whereas others have low basal SMA and transition to SMA− fibroblast-like cells (Fig. 7). These results are remarkably similar to what has been reported for epithelial cells and suggests parallels between the processes of EMT and EndMT (46). However, EC which have undergone a partial mesenchymal-like transition may be directed to a stable SMA+ mesenchymal-like phenotype perhaps after prolonged TGFβ stimulation or disruption in bFGF signaling (41). In addition to regulation by growth factors and cytokines, EndMT may also be controlled by epigenetic barriers within the different subpopulations of EC that guides them towards one lineage or the other. These epigenetic restrictions could explain heterogeneity in EC responses to TGFβ signaling. EC markedly increase bFGF production in response to stimulation by TGFβ2; thus, one EC that receives TGFβ could protect neighboring EC from mesenchymal-like differentiation through a lateral inhibitory mechanism involving bFGF secretion (47). A similar mechanism of lateral inhibition involving VEGF/Notch signaling is well known in EC, as it occurs during fate determination of tip cells during sprouting angiogenesis (48). In tumors, organ fibrosis, and other chronic inflammatory conditions, the extent of EndMT will likely be determined by local concentrations of several interacting cytokines and growth factors, including TGFβ, bFGF, and BMPs, and perhaps on organ-specific properties and heterogeneity of the EC that form the microvasculature (49). Notably, in endoglin- (a TGFβ2 co-receptor) deficient mice, EndMT in tumor vessels was exacerbated and the frequency of metastases was increased (13). On the other hand, endoglin deficiency delayed resistance to an anti-angiogenic therapy targeting VEGF. These findings bring to light the importance of further understanding the molecular mechanisms that promote and inhibit EndMT in tumors and in other pathological conditions.
Figure 7. Schematic diagram of TGFβ and bFGF interactions during EndMT.
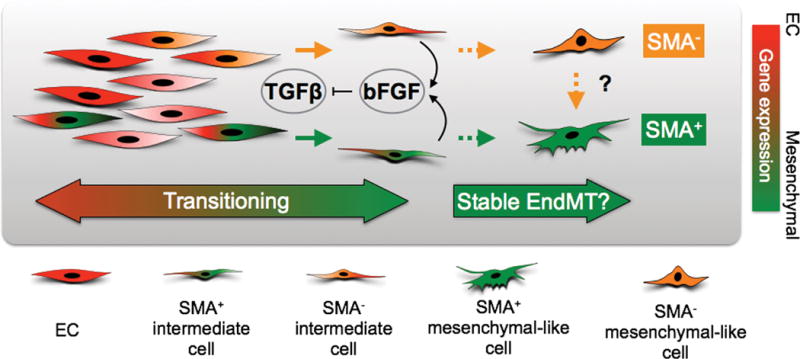
Heterogeneous EC populations consist of cells with a spectrum of basal SMA mRNA expression suggesting that some EC possess intrinsic ability to gain SMA protein expression. Transient TGFβ exposure stimulates EC to undergo reversible EndMT where some EC transition into SMA+ intermediate cells whereas others form SMA− intermediate cells. EC also up-regulate bFGF in response to TGFβ, providing a mechanism to counteract TGFβ, thereby maintaining endothelial specification via an autocrine or paracrine loop. Prolonged TGFβ stimulation may force EC to reach a “point of no return” and enter an irreversible or stable EndMT state. EC at this stage may completely lose endothelial specification, which cannot be rescued by bFGF addition or TGFβ removal, and generate either SMA+ or SMA− mesenchymal-like cells. It is also possible there are epigenetic barriers are in place among heterogeneous EC that restricts SMA− mesenchymal-like EC from becoming SMA+, but these barriers could be overcome depending on specific conditions in the tumor microenvironment.
Supplementary Material
Acknowledgments
ACD is supported by a grant from the National Institute of Health (R01-CA177875). LX is a fellow in the HHMI-funded translational medicine program at UNC Chapel Hill. We thank the UNC Microscopy Services Laboratory in the UNC Department of Pathology and Laboratory Medicine for technical assistance with confocal and live imaging, and K. McNaughton and J. A. Ezzell at the Histology Core of the UNC Department of Cell Biology and Physiology for processing and sectioning histology samples. We also thank Dr. Shelly Earp from the Lineberger Cancer Center for sharing the PyVMT tumor cells.
Footnotes
THERE ARE NO CONFLICTS OF INTEREST TO DISCLOSE
References
- 1.Bischoff J, Aikawa E. Progenitor Cells Confer Plasticity to Cardiac Valve Endothelium. J of Cardiovasc Trans Res. 2011 doi: 10.1007/s12265-011-9312-0. [DOI] [PubMed] [Google Scholar]
- 2.Cooley BC, Nevado J, Mellad J, Yang D, St Hilaire C, Negro A, et al. TGF-β signaling mediates endothelial-to-mesenchymal transition (EndMT) during vein graft remodeling. Sci Transl Med. 2014;6:227ra34–4. doi: 10.1126/scitranslmed.3006927. [DOI] [PMC free article] [PubMed] [Google Scholar]
- 3.Maddaluno L, Rudini N, Cuttano R, Bravi L, Giampietro C, Corada M, et al. EndMT contributes to the onset and progression of cerebral cavernous malformations. Nature. 2013;498:492–6. doi: 10.1038/nature12207. [DOI] [PubMed] [Google Scholar]
- 4.Zeisberg EM, Tarnavski O, Zeisberg M, Dorfman AL, McMullen JR, Gustafsson E, et al. Endothelial-to-mesenchymal transition contributes to cardiac fibrosis. Nat Med. 2007;13:952–61. doi: 10.1038/nm1613. [DOI] [PubMed] [Google Scholar]
- 5.Zeisberg EM, Potenta S, Xie L, Zeisberg M, Kalluri R. Discovery of endothelial to mesenchymal transition as a source for carcinoma-associated fibroblasts. Cancer Res. 2007;67:10123–8. doi: 10.1158/0008-5472.CAN-07-3127. [DOI] [PubMed] [Google Scholar]
- 6.Goumans M-J, van Zonneveld AJ, Dijke ten P. Transforming Growth Factor. Trends Cardiovasc Med Elsevier Inc. 2008;18:293–8. doi: 10.1016/j.tcm.2009.01.001. [DOI] [PubMed] [Google Scholar]
- 7.LeBleu VS, Taduri G, O’Connell J, Teng Y, Cooke VG, Woda C, et al. Origin and function of myofibroblasts in kidney fibrosis. Nat Med. 2013;19:1047–53. doi: 10.1038/nm.3218. [DOI] [PMC free article] [PubMed] [Google Scholar]
- 8.Dudley AC, Khan ZA, Shih S-C, Kang S-Y, Zwaans BMM, Bischoff J, et al. Calcification of multipotent prostate tumor endothelium. Cancer Cell. 2008;14:201–11. doi: 10.1016/j.ccr.2008.06.017. [DOI] [PMC free article] [PubMed] [Google Scholar]
- 9.Medici D, Shore EM, Lounev VY, Kaplan FS, Kalluri R, Olsen BR. Conversion of vascular endothelial cells into multipotent stem-like cells. Nat Med. 2010;16:1400–6. doi: 10.1038/nm.2252. [DOI] [PMC free article] [PubMed] [Google Scholar]
- 10.Yao Y, Jumabay M, Ly A, Radparvar M, Cubberly MR, Bostrom KI. A Role for the Endothelium in Vascular Calcification. Circ Res. 2013;113:495–504. doi: 10.1161/CIRCRESAHA.113.301792. [DOI] [PMC free article] [PubMed] [Google Scholar]
- 11.Wylie-Sears J, Aikawa E, Levine RA, Yang J-H, Bischoff J. Mitral valve endothelial cells with osteogenic differentiation potential. Arterioscler Thromb Vasc Biol. 2011;31:598–607. doi: 10.1161/ATVBAHA.110.216184. [DOI] [PMC free article] [PubMed] [Google Scholar]
- 12.Hofmann JJ, Briot A, Enciso J, Zovein AC, Ren S, Zhang ZW, et al. Endothelial deletion of murine Jag1 leads to valve calcification and congenital heart defects associated with Alagille syndrome. Development. 2012;139:4449–60. doi: 10.1242/dev.084871. [DOI] [PMC free article] [PubMed] [Google Scholar]
- 13.Anderberg C, Cunha SI, Zhai Z, Cortez E, Pardali E, Johnson JR, et al. Deficiency for endoglin in tumor vasculature weakens the endothelial barrier to metastatic dissemination. J Exp Med. 2013;210:563–79. doi: 10.1084/jem.20120662. [DOI] [PMC free article] [PubMed] [Google Scholar]
- 14.Paruchuri S, Yang J-H, Aikawa E, Melero-Martin JM, Khan ZA, Loukogeorgakis S, et al. Human pulmonary valve progenitor cells exhibit endothelial/mesenchymal plasticity in response to vascular endothelial growth factor-A and transforming growth factor-beta2. Circ Res. 2006;99:861–9. doi: 10.1161/01.RES.0000245188.41002.2c. [DOI] [PMC free article] [PubMed] [Google Scholar]
- 15.Tam WL, Weinberg RA. The epigenetics of epithelial-mesenchymal plasticity in cancer. Nat Med. 2013;19:1438–49. doi: 10.1038/nm.3336. [DOI] [PMC free article] [PubMed] [Google Scholar]
- 16.Polyak K, Weinberg RA. Transitions between epithelial and mesenchymal states: acquisition of malignant and stem cell traits. Nat Rev Cancer. 2009;9:265–73. doi: 10.1038/nrc2620. [DOI] [PubMed] [Google Scholar]
- 17.Arciniegas E, Sutton AB, Allen TD, Schor AM. Transforming growth factor beta 1 promotes the differentiation of endothelial cells into smooth muscle-like cells in vitro. J Cell Sci. 1992;103(Pt 2):521–9. doi: 10.1242/jcs.103.2.521. [DOI] [PubMed] [Google Scholar]
- 18.Wu C-Y, Tsai Y-P, Wu M-Z, Teng S-C, Wu K-J. Epigenetic reprogramming and post-transcriptional regulation during the epithelial-mesenchymal transition. Trends Genet. 2012;28:454–63. doi: 10.1016/j.tig.2012.05.005. [DOI] [PubMed] [Google Scholar]
- 19.Massagué J. How cells read TGF-beta signals. Nat Rev Mol Cell Biol. 2000;1:169–78. doi: 10.1038/35043051. [DOI] [PubMed] [Google Scholar]
- 20.Massagué J. TGFβ signalling in context. Nat Rev Mol Cell Biol. 2012;13:616–30. doi: 10.1038/nrm3434. [DOI] [PMC free article] [PubMed] [Google Scholar]
- 21.Xiao L, Harrell JC, Perou CM, Dudley AC. Identification of a stable molecular signature in mammary tumor endothelial cells that persists in vitro. Angiogenesis. 2014;17:511–8. doi: 10.1007/s10456-013-9409-y. [DOI] [PMC free article] [PubMed] [Google Scholar]
- 22.Xu X, Rock JR, Lu Y, Futtner C, Schwab B, Guinney J, et al. Evidence for type II cells as cells of origin of K-Ras-induced distal lung adenocarcinoma. Proceedings of the National Academy of Sciences. 2012;109:4910–5. doi: 10.1073/pnas.1112499109. [DOI] [PMC free article] [PubMed] [Google Scholar]
- 23.Voyta JC, Via DP, Butterfield CE, Zetter BR. Identification and isolation of endothelial cells based on their increased uptake of acetylated-low density lipoprotein. J Cell Biol. 1984;99:2034–40. doi: 10.1083/jcb.99.6.2034. [DOI] [PMC free article] [PubMed] [Google Scholar]
- 24.Gebäck T, Schulz MMP, Koumoutsakos P, Detmar M. TScratch: a novel and simple software tool for automated analysis of monolayer wound healing assays. BioTechniques. 2009 Apr;:265–74. doi: 10.2144/000113083. [DOI] [PubMed] [Google Scholar]
- 25.Cook RS, Jacobsen KM, Wofford AM, DeRyckere D, Stanford J, Prieto AL, et al. MerTK inhibition in tumor leukocytes decreases tumor growth and metastasis. J Clin Invest. 2013;123:3231–42. doi: 10.1172/JCI67655. [DOI] [PMC free article] [PubMed] [Google Scholar]
- 26.Azuma K, Ichimura K, Mita T, Nakayama S, Jin WL, Hirose T, et al. Presence of alpha-smooth muscle actin-positive endothelial cells in the luminal surface of adult aorta. BIOCHEMICAL AND BIOPHYSICAL RESEARCH COMMUNICATIONS. 2009;380:620–6. doi: 10.1016/j.bbrc.2009.01.135. [DOI] [PubMed] [Google Scholar]
- 27.Hashimoto N, Phan SH, Imaizumi K, Matsuo M, Nakashima H, Kawabe T, et al. Endothelial-mesenchymal transition in bleomycin-induced pulmonary fibrosis. Am J Respir Cell Mol Biol. 2010;43:161–72. doi: 10.1165/rcmb.2009-0031OC. [DOI] [PMC free article] [PubMed] [Google Scholar]
- 28.Massagué J. TGFβ in Cancer. Cell. 2008;134:215–30. doi: 10.1016/j.cell.2008.07.001. [DOI] [PMC free article] [PubMed] [Google Scholar]
- 29.Rønnov-Jessen L, Petersen OW. A function for filamentous alpha-smooth muscle actin: retardation of motility in fibroblasts. J Cell Biol. 1996 doi: 10.1083/jcb.134.1.67. [DOI] [PMC free article] [PubMed] [Google Scholar]
- 30.Tomasek JJ, Gabbiani G, Hinz B, Chaponnier C, Brown RA. Myofibroblasts and mechano-regulation of connective tissue remodelling. Nat Rev Mol Cell Biol. 2002;3:349–63. doi: 10.1038/nrm809. [DOI] [PubMed] [Google Scholar]
- 31.Hinz B, Phan SH, Thannickal VJ, Prunotto M, Desmoulière A, Varga J, et al. Recent developments in myofibroblast biology: paradigms for connective tissue remodeling. American Journal Of Pathology. 2012;180:1340–55. doi: 10.1016/j.ajpath.2012.02.004. [DOI] [PMC free article] [PubMed] [Google Scholar]
- 32.Medici D, Potenta S, Kalluri R. Transforming growth factor-β2 promotes Snail-mediated endothelial–mesenchymal transition through convergence of Smad-dependent and Smad-independent signalling. Biochem J. 2011;437:515–20. doi: 10.1042/BJ20101500. [DOI] [PMC free article] [PubMed] [Google Scholar]
- 33.Gurzu S, Ciortea D, Munteanu T, Kezdi-Zaharia I, Jung I. Mesenchymal-to-endothelial transition in Kaposi sarcoma: a histogenetic hypothesis based on a case series and literature review. PLoS ONE. 2013;8:e71530. doi: 10.1371/journal.pone.0071530. [DOI] [PMC free article] [PubMed] [Google Scholar]
- 34.Ginsberg M, James D, Ding B-S, Nolan D, Geng F, Butler JM, et al. Efficient direct reprogramming of mature amniotic cells into endothelial cells by ETS factors and TGFβ suppression. Cell. 2012;151:559–75. doi: 10.1016/j.cell.2012.09.032. [DOI] [PMC free article] [PubMed] [Google Scholar]
- 35.Cushing MC, Mariner PD, Liao JT, Sims EA, Anseth KS. Fibroblast growth factor represses Smad-mediated myofibroblast activation in aortic valvular interstitial cells. FASEB J. 2008;22:1769–77. doi: 10.1096/fj.07-087627. [DOI] [PMC free article] [PubMed] [Google Scholar]
- 36.Ichikawa M, Williams R, Wang L, Vogl T, Srikrishna G. S100A8/A9 activate key genes and pathways in colon tumor progression. Mol Cancer Res. 2011;9:133–48. doi: 10.1158/1541-7786.MCR-10-0394. [DOI] [PMC free article] [PubMed] [Google Scholar]
- 37.Dufraine J, Funahashi Y, Kitajewski J. Notch signaling regulates tumor angiogenesis by diverse mechanisms. Oncogene. 2008;27:5132–7. doi: 10.1038/onc.2008.227. [DOI] [PMC free article] [PubMed] [Google Scholar]
- 38.Kokudo T, Suzuki Y, Yoshimatsu Y, Yamazaki T, Watabe T, Miyazono K. Snail is required for TGF -induced endothelial-mesenchymal transition of embryonic stem cell-derived endothelial cells. J Cell Sci. 2008;121:3317–24. doi: 10.1242/jcs.028282. [DOI] [PubMed] [Google Scholar]
- 39.Fang X, Cai Y, Liu J, Wang Z, Wu Q, Zhang Z, et al. Twist2 contributes to breast cancer progression by promoting an epithelial-mesenchymal transition and cancer stem-like cell self-renewal. Oncogene. 2011;30:4707–20. doi: 10.1038/onc.2011.181. [DOI] [PubMed] [Google Scholar]
- 40.Ramos C, Becerril C, Montaño M, García-De-Alba C, Ramírez R, Checa M, et al. FGF-1 reverts epithelial-mesenchymal transition induced by TGF-{beta}1 through MAPK/ERK kinase pathway. AJP: Lung Cellular and Molecular Physiology. 2010;299:L222–31. doi: 10.1152/ajplung.00070.2010. [DOI] [PubMed] [Google Scholar]
- 41.Chen P-Y, Qin L, Barnes C, Charisse K, Yi T, Zhang X, et al. FGF regulates TGF-β signaling and endothelial-to-mesenchymal transition via control of let-7 miRNA expression. Cell Rep. 2012;2:1684–96. doi: 10.1016/j.celrep.2012.10.021. [DOI] [PMC free article] [PubMed] [Google Scholar]
- 42.Ichise T, Yoshida N, Ichise H. FGF2-induced Ras-MAPK signalling maintains lymphatic endothelial cell identity by upregulating endothelial-cell-specific gene expression and suppressing TGF signalling through Smad2. J Cell Sci. 2014;127:845–57. doi: 10.1242/jcs.137836. [DOI] [PubMed] [Google Scholar]
- 43.Luna-Zurita L, Prados B, Grego-Bessa J, Luxán G, del Monte G, Benguría A, et al. Integration of a Notch-dependent mesenchymal gene program and Bmp2-driven cell invasiveness regulates murine cardiac valve formation. J Clin Invest. 2010;120:3493–507. doi: 10.1172/JCI42666. [DOI] [PMC free article] [PubMed] [Google Scholar]
- 44.Dendooven A, van Oostrom O, van der Giezen DM, Leeuwis JW, Snijckers C, Joles JA, et al. Loss of endogenous bone morphogenetic protein-6 aggravates renal fibrosis. American Journal Of Pathology. 2011;178:1069–79. doi: 10.1016/j.ajpath.2010.12.005. [DOI] [PMC free article] [PubMed] [Google Scholar]
- 45.Powell PP, Klagsbrun M. Three forms of rat basic fibroblast growth factor are made from a single mRNA and localize to the nucleus. J Cell Physiol. 1991;148:202–10. doi: 10.1002/jcp.1041480204. [DOI] [PubMed] [Google Scholar]
- 46.Shirakihara T, Horiguchi K, Miyazawa K, Ehata S, Shibata T, Morita I, et al. TGF-β regulates isoform switching of FGF receptors and epithelial-mesenchymal transition. EMBO J. 2011;30:783–95. doi: 10.1038/emboj.2010.351. [DOI] [PMC free article] [PubMed] [Google Scholar]
- 47.Schweigerer L, Neufeld G, Friedman J, Abraham JA, Fiddes JC, Gospodarowicz D. Capillary endothelial cells express basic fibroblast growth factor, a mitogen that promotes their own growth. 1987;325:257–9. doi: 10.1038/325257a0. [DOI] [PubMed] [Google Scholar]
- 48.Potente M, Gerhardt H, Carmeliet P. Basic and therapeutic aspects of angiogenesis. Cell. 2011;146:873–87. doi: 10.1016/j.cell.2011.08.039. [DOI] [PubMed] [Google Scholar]
- 49.Nolan DJ, Ginsberg M, Israely E, Palikuqi B, Poulos MG, James D, et al. Molecular signatures of tissue-specific microvascular endothelial cell heterogeneity in organ maintenance and regeneration. Developmental Cell. 2013;26:204–19. doi: 10.1016/j.devcel.2013.06.017. [DOI] [PMC free article] [PubMed] [Google Scholar]
Associated Data
This section collects any data citations, data availability statements, or supplementary materials included in this article.