

Abstract
Background
Patients with anxiety disorders suffer marked functional impairment in their activities of daily living. Many studies have documented that improvements in anxiety symptom severity predict functioning improvements. However, no studies have investigated how improvements in functioning simultaneously predict symptom reduction. We hypothesized that symptom levels at a given time point will predict functioning at the subsequent time point, and simultaneously that functioning at a given time point will predict symptom levels at a subsequent time point.
Methods
Patients were recruited from primary care centers for the Coordinated Anxiety Learning and Management (CALM) study and were randomized to receive either computer-assisted cognitive-behavioral therapy and/or medication management (ITV) or usual care (UC). A cross-lagged panel design examined the relationship between functional impairment and anxiety and depression symptom severity at baseline, 6, 12, and 18 month follow-up assessments.
Results
Prospective prediction of functioning from symptoms and symptoms from functioning were both important in modeling these associations. Anxiety and depression predicted functioning as strongly as functioning predicted anxiety and depression. There were some differences in these associations between UC and ITV. Where differences emerged, the UC group was best modeled with prospective paths predicting functioning from symptoms, whereas symptoms and functioning were both important predictors in the ITV group.
Conclusion
Treatment outcome is best captured by measures of functional impairment as well as symptom severity. Implications for treatment are discussed, as well as future directions of research.
Anxiety disorders are associated with pervasive functional impairment. The cost to society in income or productivity loss for patients who meet criteria for one of these disorders was $46.6 billion in 1990 (DuPont et al. 1996). In addition to the financial burden, patients with anxiety disorders experience interpersonal problems such as marital discord and other family and social problems (Markowitz et al. 1989; Lochner et al. 2003), education problems (Stein et al. 1997; Wittchen et al. 2000), and increased use of non-prescription drugs (Lochner et al. 2003). Thus, the functional impairment associated with anxiety disorders is as important to understand and address as the symptoms of anxiety.
Throughout this paper, for the sake of clarity, symptoms will be referred to throughout as anxiety and depression characteristics that are operationalized in the Diagnostic and Statistical Manual of Mental Disorders (American Psychiatric Association, 2013), including physical, behavioral, and cognitive disturbances. Functioning will refer to activities of daily living such as the ability to work or attend school, or fulfill social or familial obligations. The relationship between symptom severity and functional impairment in patients with anxiety disorders is not as straightforward as might be expected. For instance, while the majority of studies demonstrate that the frequency of panic attacks or number of depression symptoms is predictive of disability (Katerndahl & Realini, 1997; Rubin et al. 2000; Chan et al. 2009), others have found that the frequency of panic attacks is not correlated with functioning (Michelson et al. 1998). In addition, the number of anxiety symptoms endorsed accounts for only a small percentage of variance in quality of life or functioning (Leon et al. 1992; Michelson et al. 1998; Rapaport et al. 2005). These data suggest that improvements in functioning are unlikely to occur merely through symptom reduction.
Improvement in functioning is often measured as a sign of treatment effectiveness. A number of studies of pharmacological treatment report significant improvements on measures of functioning alongside improvements on symptom measures for anxiety disorders (Jacobs et al. 1997; Lecrubier & Judge, 1997; Mavissakalian et al. 1998; Michelson et al. 1998; Malik et al. 1999; Stein et al. 1999). However, the situation is complicated by other studies that fail to find differences in functioning between patients receiving medication versus placebo (Hoehn-Saric et al. 1993) or find differences on self-report measures of functioning but fail to find differences on clinician-rated measures of functioning (Michelson et al. 1998). Evidence for changes in functioning from pre- to post- cognitive behavior therapy (CBT) is more limited, particularly compared to other active treatments, but several studies indicate improved quality of life for patients with anxiety disorders following CBT (Safren et al. 1996; Moritz et al. 2005; Arch et al. 2012). Some studies indicate equivalent improvements in functioning following CBT compared to pharmacotherapy (Kilic, Noshirvani, Basoglu, & Marks, 1997).
Few studies have attempted to parse the complicated relationship between symptom levels and functional impairment. Those that have only examine unidirectional relationships, typically by examining whether improvements in symptom levels predict improvements in functioning. The results from such studies have been contradictory. On the one hand, several studies show that symptom improvements are associated with, or predict, functional improvement, following pharmacotherapy (Jacobs et al. 1997) and CBT (Telch et al. 1995; Moritz et al. 2005). On the other hand, other studies fail to substantiate the link between symptom and functional impairment outcomes (Tenney et al. 2003; Monson et al. 2006).
No study to our knowledge has simultaneously analyzed the predictive role of symptom improvement on functioning while examining the role of functional improvement on symptom alleviation. This is an essential question that has clear implications for treatment development. If functional improvement is a stronger predictor of symptom reduction than the converse, then clinicians would be encouraged to target ways of improving functioning in patients’ daily lives early in the treatment process. Alternatively, if symptom alleviation more strongly predicts functional improvement, clinicians would be justified in dedicating more time to targeting symptom alleviation from the onset of treatment. The current study aimed to evaluate the bidirectional nature of the relationship between symptoms and functioning. We used data from a sample of patients with principal anxiety disorders presenting to their primary care physicians as part of the Coordinated Anxiety Learning and Management (CALM; Roy-Byrne et al. 2010; Craske et al. 2011) study. Analyses were conducted on data covering an 18-month period, providing an extended time period to capture changes in both functioning and symptoms. The primary hypothesis was that symptom levels at a given time point would predict functioning at the subsequent time point, and simultaneously that functioning at a given time point would predict symptom levels at a subsequent time point.
Methods
Participants
Participants were recruited from 13 primary care clinics throughout the United States (Roy-Byrne et al. 2010; Craske et al. 2011). They were diagnosed with a principal anxiety disorder of panic disorder (n=262), generalized anxiety disorder (n=549), social anxiety disorder (n=132), or post-traumatic stress disorder (n=61). Participants were at least 18 years old, spoke either English or Spanish, were not currently suicidal, had no marked cognitive impairment or life-threatening medical conditions, and had no diagnoses of bipolar I disorder or psychosis. With the exception of alcohol and marijuana abuse, substance abuse or dependence was also an exclusion factor. Over half of participants had comorbid anxiety disorders and two-thirds had comorbid major depression. Participants were referred through their primary care physician or nursing staff and were screened for eligibility by an Anxiety Clinical Specialist (ACS). Full details about recruitment are available in the primary outcome papers (Roy-Byrne et al. 2010; Craske et al. 2011). Participants averaged 43.5 years of age (SD = 13.4), and were primarily white (69.6%) and female (71.1%).
Intervention
Participants were randomized to either usual care (UC) or CALM intervention (ITV), comprised of CBT, medication recommendations, or both.
Intervention (ITV)
The CBT component was a computer-assisted program that guided the ACS and the patient, and included generic modules (self-monitoring, psychoeducation, fear hierarchies, breathing retraining, and relapse prevention) and modules that were tailored to the most distressing/disabling anxiety disorder (cognitive restructuring and exposure; Craske et al. 2009). Full details of the computer-assisted CBT are described by Craske et al. (2009) as are details of ACS training by Rose et al. (2011).
ACS relayed medication recommendations from study psychiatrists to the primary care providers, who prescribed medications. Medications were monitored by the ACS (56% in person, 43% over the phone). This included tracking adherence to medication, as well as providing counseling to avoid alcohol and caffeine and improve sleep quality. After 10-12 weeks in ITV, patients who remained symptomatic could opt to continue in the same modality (CBT or medication) or the alternative modality, for up to 12 months (although the majority completed active treatment within six months of baseline assessment). Following active treatment, participants received monthly follow-up phone calls to reinforce CBT concepts and/or medication adherence, again up to 12 months following baseline.
Usual Care (UC)
Participants (70.9% female, mean age 43.7, SD= 13.7, 57.7% white) who were randomized to UC received continued care with their PCP. Participants in this condition received medication, counseling as typically available based on the clinic, and referrals to mental health providers. Their only contact with study personnel was for assessment purposes.
Measures
For the current study, all measures of interest were completed at baseline, and 6, 12, and 18 monthsthereafter during telephone assessments conducted by interviewers at the RAND Corporation who were blind to treatment condition and the timing of the assessment. These include three measures of functioning from two different instruments, and three measures of symptoms.
Short-Form Health Survey (SF-12; Ware et al. 1996)
The SF-12 is a 12-item questionnaire about mental and physical health functioning with items that are particularly relevant to depression. The measure has demonstrated high reliability and construct validity (Ware et al. 1996). In the current study, the oblique subscales for physical health (PHS) and mental health (MHS) were calculated using weights derived from confirmatory factor analysis in Fleishman, Selim, and Kazis (2010). These subscales include items focused on the interference in activities of daily living caused by physical and mental health issues. The MHS and PHS were highly correlated with each other (.71, .74, .73, and .77 at baseline, 6, 12, and 18 months, respectively), but they represent distinct domains of functioning (see Appendices I & II for summary statistics and correlations for all variables). Therefore, they were analyzed separately.
Appendix I.
Summary Statistics
| Mean | Standard Deviation | |
|---|---|---|
| PHYS00 | 42.568 | 9.87 |
| MENT00 | 33.833 | 9.199 |
| SHEEN00 | 16.963 | 7.263 |
| BSI00 | 16.316 | 8.951 |
| ASI00 | 29.736 | 13.775 |
| PHQ00 | 12.536 | 6.048 |
| PHYS06 | 44.837 | 10.056 |
| MENT06 | 41.665 | 10.418 |
| SHEEN06 | 10.366 | 8.057 |
| BSI06 | 10.403 | 8.579 |
| ASI06 | 21.81 | 14.279 |
| PHQ06 | 8.273 | 6.177 |
| PHYS12 | 45.357 | 10.206 |
| MENT12 | 42.369 | 10.903 |
| SHEEN12 | 9.953 | 8.097 |
| BSI12 | 9.507 | 8.359 |
| ASI12 | 19.741 | 13.988 |
| PHQ12 | 7.77 | 6.374 |
| PHYS18 | 45.784 | 10.295 |
| MENT18 | 43.097 | 10.647 |
| SHEEN18 | 9.644 | 8.162 |
| BSI18 | 8.998 | 8.387 |
| ASI18 | 18.586 | 13.927 |
| PHQ18 | 7.214 | 6.068 |
Appendix II.
Part A: Correlation Matrix
| PHYS00 | MENT00 | SHEEN00 | BSI00 | ASI00 | PHQ00 | PHYS06 | MENT06 | SHEEN06 | BSI06 | ASI06 | PHQ06 | |
|---|---|---|---|---|---|---|---|---|---|---|---|---|
| PHYS00 | 1 | |||||||||||
| MENT00 | 0.712 | 1 | ||||||||||
| SHEEN00 | -0.422 | -0.712 | 1 | |||||||||
| BSI00 | -0.496 | -0.612 | 0.54 | 1 | ||||||||
| ASI00 | -0.39 | -0.488 | 0.471 | 0.652 | 1 | |||||||
| PHQ00 | -0.496 | -0.72 | 0.685 | 0.574 | 0.476 | 1 | ||||||
| PHYS06 | 0.699 | 0.501 | -0.28 | -0.322 | -0.234 | -0.392 | 1 | |||||
| MENT06 | 0.485 | 0.51 | -0.372 | -0.327 | -0.27 | -0.446 | 0.737 | 1 | ||||
| SHEEN06 | -0.289 | -0.384 | 0.417 | 0.301 | 0.279 | 0.395 | -0.483 | -0.774 | 1 | |||
| BSI06 | -0.421 | -0.409 | 0.295 | 0.496 | 0.377 | 0.39 | -0.573 | -0.731 | 0.691 | 1 | ||
| ASI06 | -0.298 | -0.327 | 0.297 | 0.395 | 0.591 | 0.339 | -0.385 | -0.543 | 0.566 | 0.662 | 1 | |
| PHQ06 | -0.339 | -0.446 | 0.413 | 0.349 | 0.32 | 0.537 | -0.523 | -0.76 | 0.772 | 0.717 | 0.585 | 1 |
| PHYS12 | 0.661 | 0.483 | -0.303 | -0.315 | -0.235 | -0.37 | 0.767 | 0.597 | -0.413 | -0.494 | -0.352 | -0.462 |
| MENT12 | 0.421 | 0.472 | -0.382 | -0.348 | -0.271 | -0.408 | 0.567 | 0.698 | -0.606 | -0.574 | -0.463 | -0.616 |
| SHEEN12 | -0.254 | -0.373 | 0.426 | 0.304 | 0.278 | 0.384 | -0.374 | -0.596 | 0.67 | 0.529 | 0.48 | 0.617 |
| BSI12 | -0.362 | -0.372 | 0.317 | 0.457 | 0.332 | 0.345 | -0.448 | -0.554 | 0.532 | 0.637 | 0.516 | 0.554 |
| ASI12 | -0.233 | -0.279 | 0.264 | 0.359 | 0.543 | 0.294 | -0.31 | -0.458 | 0.461 | 0.531 | 0.744 | 0.499 |
| PHQ12 | -0.302 | -0.402 | 0.392 | 0.328 | 0.278 | 0.479 | -0.436 | -0.598 | 0.608 | 0.555 | 0.482 | 0.702 |
| PHYS18 | 0.641 | 0.448 | -0.281 | -0.314 | -0.254 | -0.364 | 0.752 | 0.591 | -0.407 | -0.522 | -0.385 | -0.473 |
| MENT18 | 0.441 | 0.465 | -0.359 | -0.316 | -0.261 | -0.42 | 0.582 | 0.692 | -0.585 | -0.585 | -0.469 | -0.623 |
| SHEEN18 | -0.264 | -0.345 | 0.369 | 0.279 | 0.242 | 0.372 | -0.389 | -0.572 | 0.611 | 0.524 | 0.47 | 0.578 |
| BSI18 | -0.369 | -0.35 | 0.263 | 0.452 | 0.328 | 0.365 | -0.467 | -0.545 | 0.515 | 0.687 | 0.511 | 0.559 |
| ASI18 | -0.257 | -0.281 | 0.258 | 0.354 | 0.525 | 0.302 | -0.308 | -0.46 | 0.469 | 0.534 | 0.747 | 0.495 |
| PHQ18 | -0.277 | -0.377 | 0.335 | 0.311 | 0.252 | 0.467 | -0.403 | -0.559 | 0.547 | 0.524 | 0.448 | 0.649 |
| Part B: Correlation Matrix for the Primary Analyses Continued | ||||||||||||
| PHYS12 | MENT12 | SHEEN12 | BSI12 | ASI12 | PHQ12 | PHYS18 | MENT18 | SHEEN18 | BSI18 | ASI18 | PHQ18 | |
| PHYS12 | 1 | |||||||||||
| MENT12 | 0.734 | 1 | ||||||||||
| SHEEN12 | -0.478 | -0.792 | 1 | |||||||||
| BSI12 | -0.59 | -0.783 | 0.688 | 1 | ||||||||
| ASI12 | -0.407 | -0.574 | 0.568 | 0.651 | 1 | |||||||
| PHQ12 | -0.544 | -0.798 | 0.805 | 0.71 | 0.579 | 1 | ||||||
| PHYS18 | 0.787 | 0.612 | -0.416 | -0.523 | -0.419 | -0.504 | 1 | |||||
| MENT18 | 0.613 | 0.722 | -0.621 | -0.593 | -0.501 | -0.648 | 0.767 | 1 | ||||
| SHEEN18 | -0.424 | -0.63 | 0.65 | 0.541 | 0.502 | 0.626 | -0.531 | -0.797 | 1 | |||
| BSI18 | -0.509 | -0.586 | 0.521 | 0.652 | 0.515 | 0.56 | -0.614 | -0.736 | 0.716 | 1 | ||
| ASI18 | -0.355 | -0.487 | 0.485 | 0.524 | 0.758 | 0.476 | -0.412 | -0.561 | 0.596 | 0.652 | 1 | |
| PHQ18 | -0.437 | -0.606 | 0.573 | 0.537 | 0.474 | 0.672 | -0.551 | -0.791 | 0.789 | 0.719 | 0.557 | 1 |
Sheehan Disability Scale (SDS; Sheehan, 1983)
The SDS measures functional impairment with 3 items that are rated on a 0-10 point scale, where 0 = not at all and 10 = extremely. This measure queries patients about their functional impairment due to anxiety, tension, or worry. Specifically, it rates participants’ interference with work, school, social, or family obligations. It has demonstrated high internal consistency and construct validity (Leon et al. 1997).
Brief Symptom Inventory (BSI; Derogatis & Melisaratos, 1983)
The BSI-18 is a self-report measure of psychological symptoms. Examples of symptoms rated on this measure include nervousness, shakiness, and spells of panic. The current study used a 12-item version of the measure that included somatization and anxiety subscales, but excluded the depression subscale. Items are rated on 0 to 4 Likert scale, where 0 = not at all and 4 = extremely. The BSI has demonstrated good test-retest reliability, as well as high correlations with its parent measure, the Symptom Checklist-90R (Derogatis, 1994).
Anxiety Sensitivity Index (ASI; Reiss et al. 1986)
The ASI is a 16-item self-report measure of beliefs that anxiety is harmful, rated on a 0-4 point Likert scale, where 0 = very little and 4 = very much. Examples of cognitive symptoms on this measure include fears of heart racing and fears of feeling shaky. It has demonstrated good reliability and is factorally independent from other measures of anxiety (Peterson & Heilbronner, 1987).
Patient Health Questionnaire (PHQ-8; Spitzer et al. 1999)
The PHQ-8 is a measure of depression severity (the item assessing suicidal ideation and intent from the PHQ-9 was dropped), with each item rated on a 0-3 Likert scale, where 0 = not at all and 3 = nearly every day. Examples of depression symptoms rated on this measure include hopelessness and low energy. Given the high comorbidity with depression in this principal anxiety disorder sample (64.5% had comorbid major depression), this measure was included in the current study to examine the relationship between depression and functional impairment. The PHQ-9 has demonstrated adequate reliability and validity (Kroenke et al. 2001).
Procedure and Data analysis
This study examined four pairings of symptom and functioning measures. These include: 1) Mental Health Subscale of SF-12 (MHS; functioning) and Patient Health Questionnaire (PHQ; depression symptoms); 2) Physical Health Subscale of SF-12 (PHS; functioning) and Patient Health Questionnaire (PHQ; depression symptoms); 3) Sheehan Disability Scale (SDS; functioning) and Brief Symptom Inventory (BSI; anxiety symptoms); and 4) Sheehan Disability Scale (SDS; functioning) and Anxiety Sensitivity Index (ASI; beliefs about anxiety symptoms). Cross-lagged panel analyses were conducted for each of the 4 variable pairings based on procedures outlined in Martens & Haase (2006) using Mplus software version 6.2 (Muthén & Muthén, 2011).
The Martens and Haase (2006) procedure involves testing a series of four models to determine the form of the relationship between the two variables of interest. The first model is the base model and consists of the paths labeled “A” in Figure 1. These include autoregressive paths that represent stability over time across successive observations for each variable. Achieving adequate model fit for the base model in this dataset also required the addition of paths from each prior observation of a variable to each later observation of the same variable. This elaboration of the base model involves only paths between observations of the same construct and will make tests of cross-lagged paths between different constructs (described below) more conservative than the base model originally described by Martens and Haase (2006). The base model also includes time-specific residual variances. Initial observations of the 2 constructs were allowed to correlate in the base model and in all subsequent models, as were the error terms associated with the two variables at each of the later time-points. The second model adds prospective paths predicting symptoms at a given time point from functioning at the previous time point (the paths labeled “B” in Figure 1) to the base model. The third model adds paths predicting functioning from symptoms (the paths labeled “C” in Figure 1) to the base model. The final model contains all prospective paths outlined above (A, B, and C) simultaneously.
Figure 1.
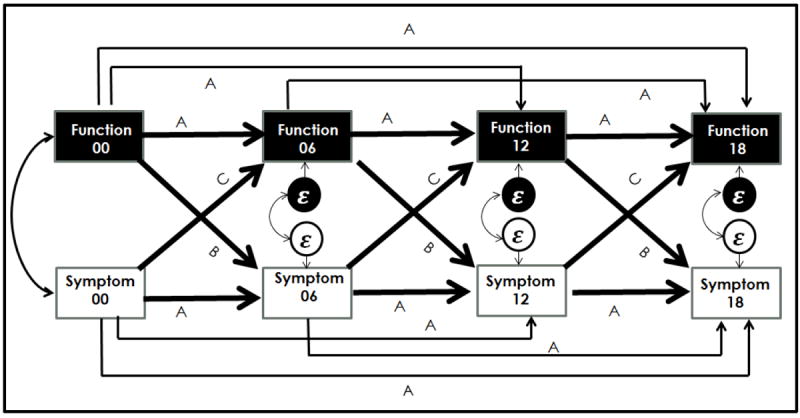
Diagram of the analytic approach based on the Martens & Haase (2006) cross-lagged panel design.
Note: The values 00, 06, 12, and 18 represent the measurements at baseline, 6,12, and 18 months respectively. The paths labeled “A” represent the regressions included in the base model, the paths labeled “A” and “B” represent the second model, the paths labeled “A” and “C” represent the third model, the paths labeled “A,” “B,” and “C” represent the fourth/full model. The ε’s represent error terms, and the error-terms were correlated, as were the baseline observations. Time-specific error variances were part of the base model.
A series of chi-square difference tests were conducted to compare the fit of the different models. Comparison of the base and second models indicates whether the addition of prospective paths from functioning to symptoms improves model fit, and comparison of the base and third models indicates whether the addition of prospective paths from symptoms to functioning improves model fit. Comparison of models two and three with the full model indicates whether the addition of a particular set of prospective paths improves model fit over and above the other.
Given that participants were randomized to the UC and ITV groups, a secondary series of analyses repeated the Martens and Haase (2006) procedure described above within each group to examine potential differences between treatment conditions. Because the primary purpose of this study was to focus on the effects of symptoms and functioning, not specific effects of treatment, results are reported separately by treatment group only when the Martens and Haase procedure (2006) indicated different forms of association between the symptoms and functioning variables in best-fitting models. When no such differences were found, the best-fitting model for the full sample is presented.
On average across all observations of all dependent variables, 13% of data was missing (range 0-20%). In addition, thevariables were generally not normally distributed, and skewness (absolute range =.044 to 1.364) and kurtosis (range -.94 to 1.688) increased at later time-points. Although these univariate skew/kurtosis measures do not exceed problematic thresholds (2 for skew and 7 for kurtosis; West et al. 1995) indices of multivariate non-normality were significant for each of the four variable combinations (Mardia skewness range= 5.85-10.51; Mardia kurtosis range= 94.84-108.49; Mardia, 1970). To adjust for these factors, maximum likelihood estimation with robust standard errors was employed using the MLR option in Mplus. MLR estimates of standard error use a sandwich estimator and is more accurate than maximum likelihood in the face of normality violations in terms of standard error and chi-square estimation (Maas & Hox, 2004). However, parameter estimates do not differ significantly regardless of whether MLR or traditional maximum likelihood estimates are used (Hox et al. 2010). Model fit comparisons are made usingthe Satorra-Bentler Scaled Chi Square (Satorra & Bentler, 2001), taking into account the degrees of freedom, chi-square value, and scaling factor for both models under comparison. In addition, the 1,004 subjects in this study were nested within 13 clinics, raising the potentially problematic issue of modeling within-clinic similarity in responses. Imposition of a multilevel structure on the analysis was not possible in Mplus because the number of parameters estimated in the model was greater than the number of clinics. However, univariate ICCs for the nine variables included in this study were relatively low (.0139-.0969) and multilevel random coefficient analyses conducted separately on each variable did not detect any significant between-clinic variance, which suggests that the results of this analysis are unlikely to be affected by the nested data structure.
Constrained analysis
After determining the best fitting model for each pair of constructs, a subsequent set of analyses was conducted to establish if there were differences in the relative strengths of the predictive associations. These analyses are referred to as “constrained analysis” below for simplicity. These analyses involve comparing the fit of models in which the standardized cross-lagged path coefficients (B and C in Figure 1) at each time-point are constrained to be equal versus when they are freely estimated. For example, the cross-lagged path predicting symptoms from functioning from 6 to 12 months was constrained to be equal to the cross-lagged path predicting functioning from symptoms within the same time period. These analyses were conducted by importing a correlation matrix into Mplus and fitting two models, one constraining the appropriate unstandardized paths to be equal, the other allowing all paths to be freely estimated. A significant difference between fit of the correlation-based models with constrained and unconstrained unstandardized paths from this correlation-based analysis would indicate a significant difference in the strength of the standardized paths in the default covariance-based analysis conducted on raw data. MLR estimates are not available in Mplus for correlation-based analyses, and the ML estimation that was used does not directly adjust for missing data or non-normality. However, the correlation matrix input to this procedure was calculated using full-information maximum likelihood to account for missing data using the corFiml function of the “psych” package in R (Revelle, 2013). Moreover, the extent to which chi-square values are overestimated due to non-normality should be similar for both the constrained and unconstrained models, and thus the difference between them should still provide a useful test of the equality between standardized path coefficients (albeit one that should be evaluated with some degree of caution).
Results
Model fit indices for all four combinations of functioning and symptomatology variables indicated good fit for the final models in terms of the (ranging from .996-1.0, compared to a recommended value greater than .95; Bentler & Bonett, 1980; Hu & Bentler, 1999) Comparative Fit Index (CFI, ranging from .994-1.000, compared to a recommended value greater than .95; Bentler, 1995; Hu & Bentler, 1999), standardized root mean squared residual (ranging from .008 to .038, compared to a recommended value less than .08; Hu & Bentler, 1999), root mean square error of approximation (RMSEA, ranging from .013-.05 for the final models, compared to a recommended value less than.06; Steiger & Lind, 1980; Hu & Bentler, 1999), and change in Akaike Information Criterion (AIC) from the base model to the final model (range of difference 26.106 to 163.496; Akaike, 1976).
PHQ and MHS analysis
There were no differences in the best-fitting model for the PHQ and MHS variables based on treatment condition, and therefore the results from the full sample are reported. The best fitting model for PHQ and MHS is the full model which includes prospective paths from depression to mental functioning and prospective paths from mental functioning to depression (see column 5 in Table 1 for tests of the various model comparisons; path coefficients are provided in Figure 2). The results of the constrained analysis indicated that there were no significant differences in the magnitude of the cross-lagged paths (see column 6 in Table 1). This is an indication that prospective paths predicting depression from mental functioning are equally important to model fit as those predicting mental functioning from depression.
Table 1.
Fit statistics of MHS and PHQ model including the full sample
| Model (df) | χ2 | Scale correction factor | Satorra-Bentler Scaled χ2 from base model | Satorra-Bentler Scaled χ2 from full model | Constrained vs freely estimated model difference (using correlation matrix) | CFI | AIC | AIC diff from base model | AIC diff from full model | SRMR | RMSEA |
|---|---|---|---|---|---|---|---|---|---|---|---|
| Base model(12) | 153.932 | 1.192 | -- | 142.526** | 0.958 | 43727.57 | -- | 163.496 | 0.13 | 0.109 | |
| MHS--> PHQ(9) | 51.544 | 1.199 | 103.916** | 41.645** | 0.987 | 43611.84 | 115.726 | 47.77 | 0.04 | 0.069 | |
| PHQ-->MHS (9) | 36.865 | 1.193 | 117.331** | 28.234** | 0.992 | 43594.02 | 133.552 | 29.944 | 0.04 | 0.056 | |
| Full Model (6) | 6.971 | 1.153 | 142.526** | -- | 0.911 | 1 | 43564.07 | 163.496 | -- | 0.008 | 0.013 |
Note: The correlation matrix was used in the constrained analyses, whereas the covariance matrix was used in all other comparisons.
indicates p<.01,
CFI=Comparative Fix Index, AIC = Akaike Information Criterion, SRMR= Standardized Root Mean Square Residual, RMSEA= Root Mean-Square Error of Approximation
Figure 2.
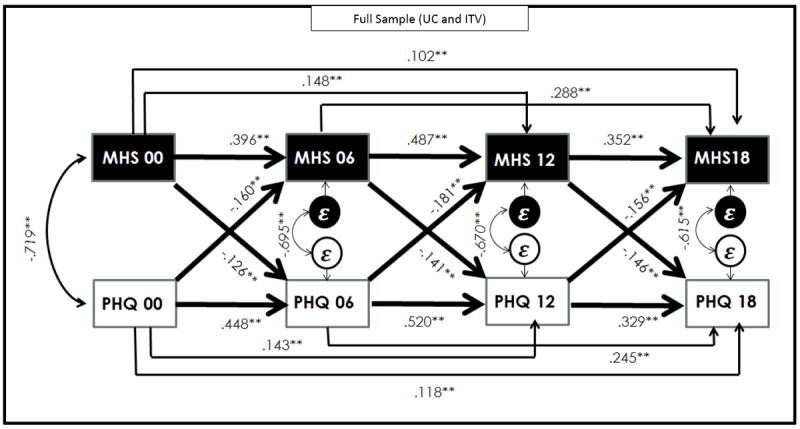
Comparison between PHQ and MHS in the Full Sample (UC and ITV)
Note: ** indicates p<.01
PHQ and PHS analysis
There were differences in the best-fitting model for the PHQ and PHS variables based on treatment condition, and therefore the 2 treatment conditions are discussed separately. In the UC sample, the third model, including only prospective paths from PHQ (functioning) to predict PHS (symptoms), was the best-fitting model (see column 5 in the upper panel of Table 2 and Figure 3B). Adding the paths from PHS to predict PHQ did not improve the fit of the model. The constrained analysis was not conducted on the UC group because the best fitting model was not the full model. In the ITV sample, the best-fitting model is the full model which includes prospective paths from depression to physical functioning and prospective paths from physical functioning to depression (see column 5 in the lower panel of Table 2 for tests of the various model comparisons; path coefficients are provided in Figure 3A). The results of the constrained analysis indicated that there were no significant differences in the magnitude of the cross-lagged paths (see column 6 in Table 2). This indicates that in the ITV sample, prospective paths predicting depression from physical functioning are equally important to model fit as those predicting physical functioning from depression.
Table 2.
Fit statistics of PHS and PHQ model including the full sample
| Model (df) | χ2 | Scale correction factor | Satorra-Bentler Scaled χ2 from base model | Satorra-Bentler Scaled χ2 from full model | Constrained vs freely estimated model difference (using correlation matrix) | CFI | AIC | AIC diff from base model | AIC diff from full model | SRMR | RMSEA |
|---|---|---|---|---|---|---|---|---|---|---|---|
| PHQ and PHS-UC Only | |||||||||||
| Base model(12) | 40.238 | 1.117 | -- | N/A | 0.981 | 21888.09 | -- | 26.638 | 0.076 | 0.069 | |
| PHS-->PHQ | 29.779 | 1.107 | 10.445+ | 23.240** | 0.986 | 21882.11 | 5.981 | 20.657 | 0.038 | 0.068 | |
| PHQ-->PHS | 11.65 | 1.102 | 27.631** | 5.768 | 0.998 | 21861.99 | 26.106 | 0.532 | 0.038 | 0.024 | |
| Full Model (6) | 5.804 | 1.087 | 33.685** | -- | 1 | 21861.46 | 26.638 | -- | 0.011 | 0 | |
| PHQ and PHS-ITV Only | |||||||||||
| Base model(12) | 31.108 | 1.175 | -- | 21.933* | 1.657 | 0.987 | 22528 | -- | 151.747 | 0.073 | 0.056 |
| PHS-->PHQ | 17.611 | 1.129 | 12.695* | 9.224+ | 0.994 | 22382.27 | 145.729 | 6.018 | 0.028 | 0.044 | |
| PHQ-->PHS | 16.59 | 1.136 | 13.704* | 8.295+ | 0.995 | 22381.24 | 146.764 | 4.983 | 0.044 | 0.041 | |
| Full Model (6) | 7.547 | 1.042 | 21.933* | -- | 0.999 | 22376.25 | 151.747 | -- | 0.011 | 0.023 | |
Note: The correlation matrix was used in the constrained analyses, whereas the covariance matrix was used in all other comparisons.
indicates p<.001,
indicates p<.01,
indicates p<.05,
CFI=Comparative Fix Index, AIC = Akaike Information Criterion, SRMR= Standardized Root Mean Square Residual, RMSEA= Root Mean-Square Error of Approximation
Figure 3.
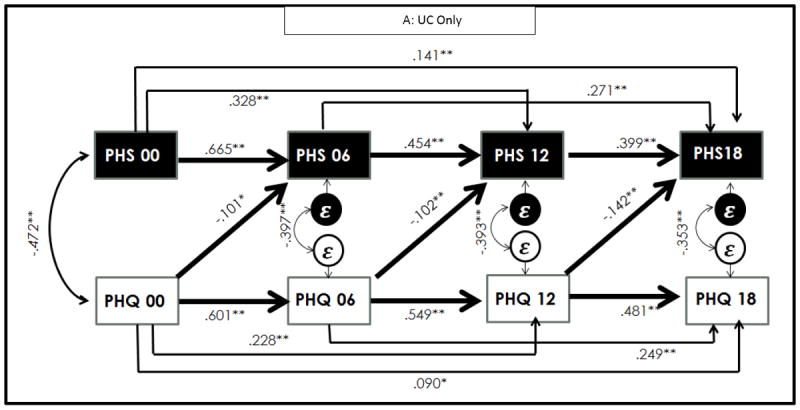
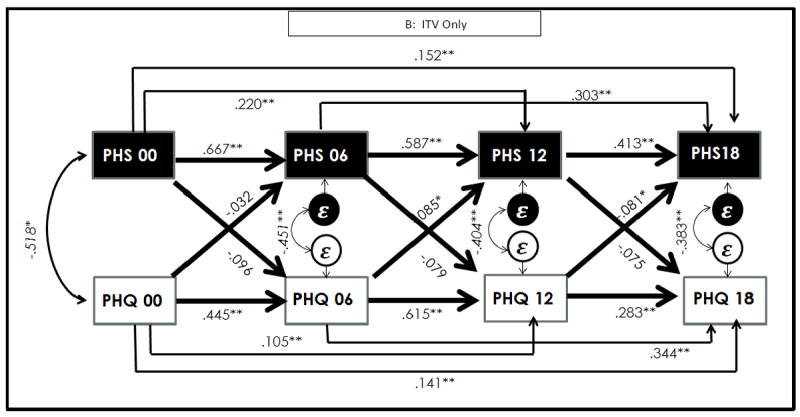
A: Comparison of PHQ and PHS in UC Group
B: Comparison of PHQ and PHS in ITV Only Group
Note: * p<.05, ** indicates p<.01 Figure 3A diagrams model 3 for the UC group and Figure 3B diagrams the full model for the ITV group given that these models were the best fitting models, respectively.
SDS and BSI analysis
There were no differences in the best-fitting model in the SDS and BSI variables based on treatment condition, and therefore results from the full sample are reported. The best fitting model for BSI and SDS is the full model which includes prospective paths predicting anxiety from functioning and predicting functioning from anxiety (see column 5 in Table 3 for tests of the various model comparisons; path coefficients are provided in Figure 4. As with the prior comparisons, the results of the constrained analysis indicated that there were no significant differences in the magnitude of the cross-lagged paths (see column 6 in Table 3). This is an indication that prospective paths predicting anxiety from functioning are equally important to model fit as those predicting functioning from anxiety.
Table 3.
Fit statistics of SDS and BSI model including the full sample
| Model (df) | χ2 | Scale correction factor | Satorra-Bentler Scaled χ2 from base model | Satorra-Bentler Scaled χ2 from full model | Constrained vs freely estimated model difference (using correlation matrix) | CFI | AIC | AIC diff from base model | AIC diff from full model | SRMR | RMSEA |
|---|---|---|---|---|---|---|---|---|---|---|---|
| Base model(12) | 99.97 | 1.242 | -- | 79.667** | 0.965 | 45385.76 | -- | 99.129 | 0.085 | 0.085 | |
| SDS--> BSI(9) | 42.79 | 1.209 | 54.0128** | 26.713** | 0.987 | 45319.35 | 66.406 | 32.723 | 0.042 | 0.061 | |
| BSI--> SDS(9) | 39.692 | 1.172 | 55.895** | 22.404** | 0.988 | 45314.14 | 71.621 | 27.508 | 0.031 | 0.058 | |
| Full Model (6) | 11.962 | 1.089 | 79.667** | -- | 4.729 | 0.998 | 45286.63 | 99.129 | -- | 0.011 | 0.031 |
Note: The correlation matrix was used in the constrained analyses, whereas the covariance matrix was used in all other comparisons.
indicates p<.01,
CFI=Comparative Fix Index, AIC = Akaike Information Criterion, SRMR= Standardized Root Mean Square Residual, RMSEA= Root Mean-Square Error of Approximation
Figure 4.
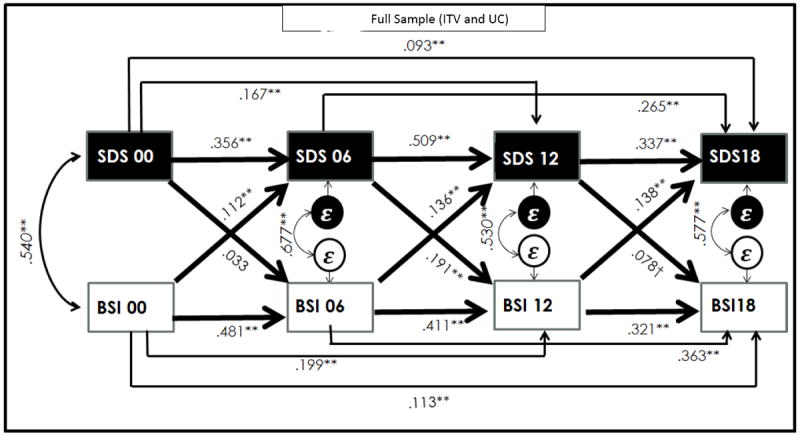
BSI and SDS in the Full Sample (UC and ITV)
Note: ** indicates p<.01, † indicates p=.05
SDS and ASI analysis
There were differences in the best-fitting model for the SDS and ASI variables based on treatment condition, and therefore the treatment conditions are discussed separately. In the UC sample, the third model, including only cross-lagged paths from beliefs about anxiety to functioning t, was the best-fitting model (see columns 4 and 5 in the upper panel of Table 4 for tests of the various model comparisons; path coefficients are provided in Figure 5A). The constrained analysis was not conducted on the UC group because the best fitting model was not the full model. In the ITV sample, the best fitting model was the full model (see column 5 in the lower panel of Table 4 for tests of the various model comparisons; path coefficients are provided in Figure 5B), and the constrained analysis did not reveal a significant difference in the magnitude of the paths (see column 6 in Table 4). This indicates that in the ITV sample, prospective paths predicting beliefs about anxiety from functioning are equally important to model fit as those predicting functioning from beliefs about anxiety. This suggests that for patients in ITV, prospective paths predicting beliefs about anxiety from functioning are equally important to model fit as those predicting functioning from beliefs about anxiety.
Table 4.
Fit statistics of ASI and SDS model including the full sample
| Model (df) | χ2 | Scale correction factor | Satorra-Bentler Scaled χ2 from base model | Satorra-Bentler Scaled χ2 from full model | Constrained vs freely estimated model difference (using correlation matrix) | CFI | AIC | AIC diff from base model | AIC diff from full model | SRMR | RMSEA |
|---|---|---|---|---|---|---|---|---|---|---|---|
| ASI and SDS-UC Only | |||||||||||
| Base model(12) | 47.242 | 1.089 | -- | 35.520** | N/A | 0.975 | 24200.43 | -- | 28.759 | 0.081 | 0.077 |
| SDS-->ASI | 44.652 | 1.082 | 2.823 | 33.532** | 0.975 | 24203.27 | -2.846 | 31.605 | 0.072 | 0.089 | |
| ASI-->SDS | 11.322 | 1.073 | 34.563** | 1.332 | 0.998 | 24167.13 | 33.301 | -4.542 | 0.017 | 0.023 | |
| Full Model (6) | 10.066 | 1.062 | 35.520** | -- | 0.997 | 24171.67 | 28.759 | -- | 0.015 | 0.037 | |
| ASI and SDS-ITV Only | |||||||||||
| Base model(12) | 56.017 | 1.172 | -- | 40.154** | 0.965 | 24602.93 | -- | 38.987 | 0.071 | 0.085 | |
| SDS-->ASI | 31.958 | 1.18 | 24.339** | 16.561* | 0.982 | 24581.01 | 21.921 | 17.066 | 0.037 | 0.071 | |
| ASI-->SDS | 28.954 | 1.11 | 24.678** | 14.790* | 0.984 | 24575.42 | 27.512 | 11.475 | 0.035 | 0.066 | |
| Full Model (6) | 13.647 | 1.074 | 40.154** | -- | 4.513 | 0.994 | 24563.95 | 38.987 | -- | 0.016 | 0.05 |
Note: The correlation matrix was used in the constrained analyses, whereas the covariance matrix was used in all other comparisons.
indicates p<.01,
indicates p<.05,
CFI=Comparative Fix Index, AIC = Akaike Information Criterion, SRMR= Standardized Root Mean Square Residual, RMSEA= Root Mean-Square Error of Approximation
Figure 5.
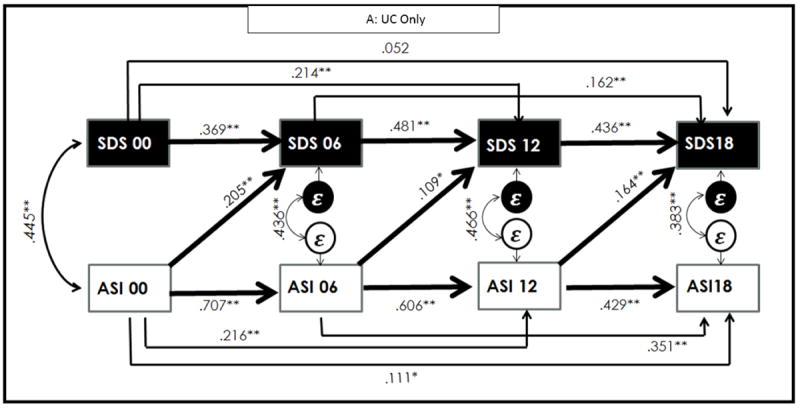
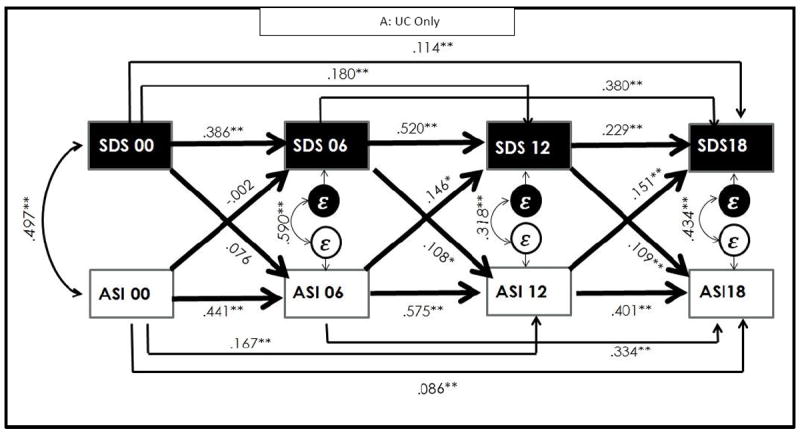
A: Comparison of ASI and SDS for UC group
B: Comparison of ASI and SDS for UC group
Note: *indicates p<.05, ** indicates p<.01. Figure 5A diagrams the full model for the UC group and Figure 5B diagrams model 3 for the ITV group given that these models were the best fitting models, respectively.
Discussion
The relationship between anxiety disorders and functional impairment has been clearly established, but the temporal relationship between symptom improvement and functional improvement has not been adequately studied to this point. This study fills this gap in the literature. The data indicate a bidirectional relation, with anxiety and depression symptom severity predicting functional impairment and conversely, functional impairment predicting anxiety and depression symptom severity.
Prior research has shown that changes in anxiety symptoms predict levels of functional impairment (Telch et al. 1995; Moritz et al. 2005). The results of the current study extend prior research by showing that changes in level of functioning are equally as predictive of symptoms of anxiety and depression as changes in symptom severity are predictive of functioning. This was the case for somatic and cognitive symptoms of anxiety (measured using the BSI), symptoms of depression (measured using the PHQ-8), and beliefs about anxiety (measured by the ASI). In sum, our study hypotheses were supported. Symptom severity at a particular time point predicted functioning at a subsequent time point while controlling for previous symptom severity, and functioning at a particular time point predicted symptom severity at a subsequent time point, while controlling for previous functioning levels.
This study also demonstrates that the relationship between functioning and beliefs about anxiety varies as a function of treatment condition. In particular, in the ITV condition, prospective prediction of functioning from beliefs about anxiety and beliefs about anxiety from functioning were both important in modeling these associations. However, in the UC group, only the prospective prediction of functioning from beliefs about anxiety was important for modeling the associations. This suggests that the relationship between functioning and beliefs about anxiety is not static, and a strong dose of evidence-based treatment can change the relationship between these constructs. Interestingly, in the UC group, beliefs about anxiety a baseline predicted functioning at six months, whereas this relation was not significant in the ITV group. One possibility is that the effect of the intervention overrode the impact of baseline beliefs about anxiety while treatment was ongoing. The relation between beliefs about anxiety and outcome may be dependent upon type of treatment. For instance, type of treatment moderates the relation between beliefs about anxiety and distress anxiety symptoms, with no clear relation between beliefs about anxiety and outcome in mindfulness-based treatments (Hayes et al. 1999; Wolitzky-Taylor et al. 2012; Arch & Ayers, 2013). Therefore, it is not entirely surprising that this difference emerged in the current study. A similar finding occurred in the comparison between physical health functioning and depression, in that in the UC group, only the prospective prediction of functioning from depression was important for modeling the associations. However, the fact that functioning predicts symptomatology in the ITV condition indicates the importance of focusing on functional impairment during evidence-based treatment.
Overall, these results highlight the importance of focusing on both functional impairment and symptom severity when treating patients with anxiety disorders and comorbid depression. A common approach to treatment is to wait until symptoms subside before encouraging participants to increase their functioning. That is, patients often are discouraged from engaging in behaviors aimed at improving relationship satisfaction, work performance, or other activities of daily living until symptoms have subsided. The underlying assumption is that patients are not capable of functional living until their symptoms have abated. In contrast, the current findings suggest that encouraging patients to engage in more functional behaviors may facilitate symptom stabilization. Behavioral therapies such as exposure therapy to feared situations and behavioral activation for depression target functioning by encouraging patients to engage in activities they are avoiding. The current findings reinforce this approach. The results of this study also indicate the importance of monitoring functioning levels over the course of treatment. This information will provide clinicians with an additional marker of patient progress, and may alert clinicians to those patients who require additional intervention to improve their functioning.
There are several strengths of this study, such as generalizable sample which was recruited from primary care centers throughout the United States. Another strength is the data-analytic approach which allows for an examination of the relationship between functioning and symptoms at multiple time-points simultaneously rather than including single time-points in separate analyses. Finally, this study included multiple measures (completed by blind assessors) of both functioning and symptoms and the results were largely consistent across the measures, indicating that they are robust and likely to hold across multiple measures of functioning and symptomatology.
There are also limitations of the study, including the possibility of an unidentified third variable which is accounting for the predictive power of both functioning and symptom levels that was not included in this analysis. Some possibilities include axis II disorders which may help explain disruption in both functioning and psychological symptoms. Additionally, functioning was measured by self-report scales rather than by objective data (e.g., number of work days missed as measured by a third party). Objective report may identify a greater degree of impairment (Maor et al. 2001). Furthermore, this sample is heterogeneous in terms of principal diagnosis. While the sample size is large enough to address the research questions proposed in this study with the pooled group, it is not sufficiently large to run separate models by diagnosis. Therefore, future studies should compare models based on principal diagnosis. In addition, future research needs to be conducted on other patient populations to determine the relevance of these findings to other psychiatric disorders. Further, the sample size in this particular study was not large enough to model more than two predictors in a given analysis, and future research with larger samples should address whether this pattern of findings holds when symptoms of anxiety and depression are combined in one model. Finally, this work merits replication to ensure the validity of the findings.
Overall, these results emphasize the importance of focusing on both symptom alleviation and improvement in functioning in patients with anxiety disorders. While prior research has demonstrated that symptom severity predicts functioning levels, to our knowledge, no other studies have parsed apart the bidirectional relationship between these two constructs. Although more research is needed in this area, particularly for replication beyond anxiety disorders, this research should guide clinicians to be mindful of their patient’s functioning in everyday activities in addition to their symptom severity, and to encourage functioning even in the presence of ongoing symptoms.
Acknowledgments
This work was supported by the following National Institute of Mental Health grants: U01 MH070018, U01 MH058915, U01 MH057835, UO1 MH057858, U01 MH070022, K24 MH64122, and K24 MH065324.
References
- Akaike H. An information criterion (AIC) Math Science. 1976;14:5–9. [Google Scholar]
- Arch JJ, Ayers CR. Which treatment worked better for whom? Moderators of group cognitive behavioral therapy versus adapted mindfulness based stress reduction for anxiety disorders. Behaviour Research and Therapy. 2013;51:434–442. doi: 10.1016/j.brat.2013.04.004. [DOI] [PubMed] [Google Scholar]
- Arch JJ, Eifert GH, Davies C, Plumb JC, Rose RD, Craske MG. Randomized trial of cognitive behavioral therapy versus acceptance and commitment therapy for the treatment of mixed anxiety disorders. Journal of Consulting and Clinical Psychology. 2012;80:750–765. doi: 10.1037/a0028310. [DOI] [PMC free article] [PubMed] [Google Scholar]
- American Psychiatric Association. Diagnostic and statistical manual of mental disorders. 5. American Psychiatric Publishing; Arlington, VA: 2013. [Google Scholar]
- Bentler PM. EQS: Structural equations program manual. Multivariate Software; Encino, CA: 1995. [Google Scholar]
- Bentler PM, Bonett DG. Significance tests and goodness of fit in the analysis of covariance structures. Psychological Bulletin. 1980;88:588–606. [Google Scholar]
- Chan S, Jia S, Chiu H, Chien W, Thompson DR, Hu Y, Lam L. Subjective health-related quality of life in Chinese older persons with depression in Shanghai and Hong Kong: relationship to clinical factors, level of functioning, and social support. International Journal of Geriatric Psychiatry. 2009;24:355–362. doi: 10.1002/gps.2129. [DOI] [PubMed] [Google Scholar]
- Craske MG, Rose RD, Lang AJ, Welch SS, Campbell-Sills L, Sullivan G, Sherbourne CD, Bystritsky A, Stein MB, Roy-Byrne P. Computer-assisted delivery of cognitive behavioral therapy for anxiety disorders in primary-care settings. Depression and Anxiety. 2009;26:235–242. doi: 10.1002/da.20542. [DOI] [PMC free article] [PubMed] [Google Scholar]
- Craske MG, Stein MB, Sullivan G, Sherbourne C, Bystritsky A, Rose RD, Lang AJ, Welch S, Campbell-Sills L, Golinelli D, Roy-Byrne P. Disorder-specific impact of coordinated anxiety learning and management treatment for anxiety disorders in primary care. Archives of General Psychiatry. 2011;68:378–388. doi: 10.1001/archgenpsychiatry.2011.25. [DOI] [PMC free article] [PubMed] [Google Scholar]
- Derogatis LR. Symptom Checklist-90-R (SCL-90-R): Administration, scoring, and procedures manual. NCS; Minneapolis, MN: 1994. [Google Scholar]
- Derogatis LR, Melisaratos N. The Brief Symptom Inventory: an introductory report. Psychological Medicine. 1983;13:595–605. [PubMed] [Google Scholar]
- DuPont RL, Rice DP, Miller LS. Economic costs of anxiety disorders. Anxiety. 1996;2:167–172. doi: 10.1002/(SICI)1522-7154(1996)2:4<167::AID-ANXI2>3.0.CO;2-L. [DOI] [PubMed] [Google Scholar]
- Fleishman J, Selim A, Kazis L. Deriving SF-12v2 physical and mental health summary scores: a comparison of different scoring algorithms. Quality of Life Research. 2010;19:231–241. doi: 10.1007/s11136-009-9582-z. [DOI] [PubMed] [Google Scholar]
- Hayes SC, Strosahl K, Wilson KG. Acceptance and Commitment Therapy: An experiential approach to behavior change. Guilford Press; New York: 1999. [Google Scholar]
- Hoehn-Saric R, McLeod DR, Hipsley PA. Effect of fluvoxamine on panic disorder. Journal of Clinical Psychopharmacology. 1993;13:321–326. [PubMed] [Google Scholar]
- Hox JJ, Maas CJM, Brinkhuis MJS. The effect of estimation method and sampling size in multileve structural equation modeling. Statistica Neerlandica. 2010;64:157–170. [Google Scholar]
- Hu L, Bentler PM. Cutoff criteria for fit indexes in covariance structure analysis: Conventional criteria versus new alternatives. Structural Equation Modeling: A Multidisciplinary Journal. 1999;6:1–55. [Google Scholar]
- Jacobs RJ, Davidson JR, Gupta S, Meyerhoff AS. The effects of clonazepam on quality of life and work productivity in panic disorder. American Journal of Managed Care. 1997;3:1187–1196. [PubMed] [Google Scholar]
- Katerndahl DA, Realini JP. Quality of Life and Panic-Related Work Disability in Subjects with Infrequent Panic and Panic Disorder. Journal of Clinical Psychiatry. 1997;58:153–158. doi: 10.4088/jcp.v58n0403. [DOI] [PubMed] [Google Scholar]
- Kroenke K, Spitzer RL, Williams JBW. The PHQ-9: Validity of a brief depression severity measure. Journal of General Internal Medicine. 2001;16:601–613. doi: 10.1046/j.1525-1497.2001.016009606.x. [DOI] [PMC free article] [PubMed] [Google Scholar]
- Lecrubier Y, Judge R. Long-term evaluation of paroxetine, clomipramine and placebo in panic disorder. Collaborative Paroxetine Panic Study Investigators. Acta Psychiatrica Scandinavica. 1997;95:153–160. doi: 10.1111/j.1600-0447.1997.tb00389.x. [DOI] [PubMed] [Google Scholar]
- Leon AC, Olfson M, Portera L, Farber L, Sheehan DV. Assessing psychiatric impairment in primary care with the sheehan disability scale. The international journal of psychiatry in medicine. 1997;27:93–105. doi: 10.2190/T8EM-C8YH-373N-1UWD. [DOI] [PubMed] [Google Scholar]
- Leon AC, Shear MK, Portera L, Klerman GL. Assessing impairment in patients with panic disorder: the Sheehan Disability Scale. Social Psychiatry and Psychiatric Epidemiology. 1992;27:78–82. doi: 10.1007/BF00788510. [DOI] [PubMed] [Google Scholar]
- Lochner C, Mogotsi M, du Toit PL, Kaminer D, Niehaus DJ, Stein DJ. Quality of Life in Anxiety Disorders: A Comparison of Obsessive-Compulsive Disorder, Social Anxiety Disorder, and Panic Disorder. Psychopathology. 2003;36:255–262. doi: 10.1159/000073451. [DOI] [PubMed] [Google Scholar]
- Maas CJM, Hox JJ. The influence of violations of assumptions on multilevel parameter estimates and their standard error. Computational Statistics & Data Analysis. 2004;46:427–440. [Google Scholar]
- Malik ML, Connor KM, Sutherland SM, Smith RD, Davison RM, Davidson JR. Quality of life and posttraumatic stress disorder: a pilot study assessing changes in SF-36 scores before and after treatment in a placebo-controlled trial of fluoxetine. Journal of Traumatic Stress. 1999;12:387–393. doi: 10.1023/A:1024745030140. [DOI] [PubMed] [Google Scholar]
- Maor Y, Olmer L, Mozes B. The relation between objective and subjective impairment in cognitive function among multiple sclerosis patients--the role of depression. Multiple Sclerosis. 2001;7:131–135. doi: 10.1177/135245850100700209. [DOI] [PubMed] [Google Scholar]
- Mardia KV. Measures of multivariate skewness and kurtosis with applications. Biometrika. 1970;57:519–530. [Google Scholar]
- Markowitz JS, Weissman MM, Ouellette R, Lish JD, Klerman GL. Quality of life in panic disorder. Archives of General Psychiatry. 1989;46:984–992. doi: 10.1001/archpsyc.1989.01810110026004. [DOI] [PubMed] [Google Scholar]
- Martens MP, Haase RH. Advanced applications of structural equation modeling in counseling psychology research. The Counseling Psychologist. 2006;34:806–838. [Google Scholar]
- Mavissakalian M, Perel J, Talbott-Green M, Sloan C. Gauging the Effectiveness of Extended Imipramine Treatment for Panic Disorder with Agoraphobia. Biological Psychiatry. 1998;43:848–854. doi: 10.1016/s0006-3223(97)00376-4. [DOI] [PubMed] [Google Scholar]
- Michelson D, Lydiard RB, Pollack MH, Tamura RN, Hoog SL, Tepner R, Demitrack MA, Tollefson GD. Outcome assessment and clinical improvement in panic disorder: evidence from a randomized controlled trial of fluoxetine and placebo. American Journal of Psychiatry. 1998;155:1570–1577. doi: 10.1176/ajp.155.11.1570. [DOI] [PubMed] [Google Scholar]
- Moritz S, Rufer M, Fricke S, Karow A, Morfeld M, Jelinek L, Jacobsen D. Quality of life in obsessive-compulsive disorder before and after treatment. Comprehensive Psychiatry. 2005;46:453–459. doi: 10.1016/j.comppsych.2005.04.002. [DOI] [PubMed] [Google Scholar]
- Muthén LK, Muthén BO. Mplus User’s Guide. Sixth Edition. Muthén & Muthén; Los Angeles, CA: 2011. [Google Scholar]
- Peterson RA, Heilbronner RL. The anxiety sensitivity index: Construct validity and factor analytic structure. Journal of Anxiety Disorders. 1987;1:117–121. [Google Scholar]
- Rapaport MH, Clary C, Fayyad R, Endicott J. Quality-of-life impairment in depressive and anxiety disorders. The American Journal of Psychiatry. 2005;162:1171–1178. doi: 10.1176/appi.ajp.162.6.1171. [DOI] [PubMed] [Google Scholar]
- Reiss S, Peterson RA, Gursky DM, McNally RJ. Anxiety sensitivity, anxiety frequency, and the prediction of fearfulness. Behavior research and therapy. 1986;24:1–8. doi: 10.1016/0005-7967(86)90143-9. [DOI] [PubMed] [Google Scholar]
- Revelle W. psych (Version 1.3.2) Evanston, Illinois: 2013. [July 15, 2014]. http://personality-project.org/revelle.html. [Google Scholar]
- Rose RD, Lang AJ, Welch SS, Campbell-Sills L, Chavira DA, Sullivan G, Sherbourne CD, Bystritsky A, Stein MB, Roy-Byrne P, Craske MG. Training primary care staff to deliver a computer-assisted cognitive-behavioral therapy program for anxiety disorders. General Hospital Psychiatry. 2011;33:336–342. doi: 10.1016/j.genhosppsych.2011.04.011. [DOI] [PMC free article] [PubMed] [Google Scholar]
- Roy-Byrne P, Craske MG, Sullivan G, Rose RD, Edlund MJ, Lang AJ, Bystritsky A, Welch SS, Chavira DA, Golinelli D, Campbell-Sills L, Sherbourne CD, Stein MB. Delivery of Evidence-Based Treatment for Multiple Anxiety Disorders in Primary Care. JAMA: The Journal of the American Medical Association. 2010;303:1921–1928. doi: 10.1001/jama.2010.608. [DOI] [PMC free article] [PubMed] [Google Scholar]
- Rubin HC, Rapaport MH, Levine B, Gladsjo JK, Rabin A, Auerbach M, Judd LL, Kaplan R. Quality of well being in panic disorder: the assessment of psychiatric and general disability. Journal of Affective Disorders. 2000;57:217–221. doi: 10.1016/s0165-0327(99)00030-0. [DOI] [PubMed] [Google Scholar]
- Safren SA, Heimberg RG, Brown EJ, Holle C. Quality of life in social phobia. Depression and Anxiety. 1996;4:126–133. doi: 10.1002/(SICI)1520-6394(1996)4:3<126::AID-DA5>3.0.CO;2-E. [DOI] [PubMed] [Google Scholar]
- Satorra A, Bentler PM. A scaled difference chi-square test statistic for moment structure analysis. Psychometrika. 2001;66:507–514. doi: 10.1007/s11336-009-9135-y. [DOI] [PMC free article] [PubMed] [Google Scholar]
- Sheehan DV. The anxiety disease. Scribner; New York: 1983. [Google Scholar]
- Spitzer RL, Kroenke K, Williams JBW. Validation and utility of a self-report version of PRIME-MD: The PHQ primary care study. Primary care evaluation of Mental Disorders. Patient Health Questionnaire. JAMA: The Journal of the American Medical Association. 1999;282:1737–1744. doi: 10.1001/jama.282.18.1737. [DOI] [PubMed] [Google Scholar]
- Steiger JH, Lind JC. Statistically based tests for the number of common factors; Paper presented at the Annual meeting of the Psychometric Society; Iowa City, IA. 1980. [Google Scholar]
- Stein MB, Fyer AJ, Davidson JRT, Pollac MH, Wiita B. Fluvoxamine treatment of social phobia (social anxiety disorder): a double-blind, placebo-controlled study. American Journal of Psychiatry. 1999;156:756–760. doi: 10.1176/ajp.156.5.756. [DOI] [PubMed] [Google Scholar]
- Stein MB, Walker JR, Hazen AL, Forde DR. Full and Partial Posttraumatic Stress Disorder: Findings From a Community Survey. American Journal of Psychiatry. 1997;154:1114–1119. doi: 10.1176/ajp.154.8.1114. [DOI] [PubMed] [Google Scholar]
- Telch MJ, Schmidt NB, Jaimez TL, Jacquin KM, Harrington PJ. Impact of cognitive-behavioral treatment on quality of life in panic disorder patients. Journal of Consulting and Clinical Psychology. 1995;63:823–830. doi: 10.1037//0022-006x.63.5.823. [DOI] [PubMed] [Google Scholar]
- Ware JE, Kosinski M, Keller SD. A 12-item short-form Health Survey: Construction of scales and preliminary tests of reliability and validity. Medical care. 1996;34:220–233. doi: 10.1097/00005650-199603000-00003. [DOI] [PubMed] [Google Scholar]
- West SG, Finch JF, Curran PJ. Structural equation models with non-normal variables: Problems and remedies. In: Hoyle R, editor. Structural equation modeling: Concepts, issues, and applications. Sage; Thousand Oaks, CA: 1995. pp. 56–75. [Google Scholar]
- Wittchen HU, Fuetsch M, Sonntag H, Muller N, Liebowitz M. Disability and quality of life in pure and comorbid social phobia. Findings from a controlled study. European Psychiatry. 2000;15:46–58. doi: 10.1016/s0924-9338(00)00211-x. [DOI] [PubMed] [Google Scholar]
- Wolitzky-Taylor KB, Arch JJ, Rosenfield D, Craske MG. Moderators and Non-Specific Predictors of Treatment Outcome for Anxiety Disorders: A Comparison of Cognitive Behavioral Therapy to Acceptance and Commitment Therapy. Journal of Consulting and Clinical Psychology. 2012;80:786–799. doi: 10.1037/a0029418. [DOI] [PubMed] [Google Scholar]