


Abstract
DBTMEE (http://dbtmee.hgc.jp/) is a searchable and browsable database designed to manipulate gene expression information from our ultralarge-scale whole-transcriptome analysis of mouse early embryos. Since integrative approaches with multiple public analytical data have become indispensable for studying embryogenesis due to technical challenges such as biological sample collection, we intend DBTMEE to be an integrated gateway for the research community. To do so, we combined the gene expression profile with various public resources. Thereby, users can extensively investigate molecular characteristics among totipotent, pluripotent and differentiated cells while taking genetic and epigenetic characteristics into consideration. We have also designed user friendly web interfaces that enable users to access the data quickly and easily. DBTMEE will help to promote our understanding of the enigmatic fertilization dynamics.
INTRODUCTION
Mammalian fertilization is a dynamically and precisely regulated developmental step, where both maternal and paternal genomes coordinate with each other to confer embryonic developmental competence on sperm-oocyte fusion cells. During fertilization, specialized gene regulatory programs that cause wave-like transitions of gene expression have to be tightly controlled (1,2). Deciphering mechanisms underlying such gene regulation programs is a fundamental challenge in human infertility and stem cell biology; that is, how embryos avoid abortive development and acquire totipotency.
Recent advances in high-throughput DNA sequencing technology leading to the rising influx of data have rapidly forwarded our understanding of the enigmatic fertilization dynamics; for example, a mechanism of epigenetic maintenance in germ cells analyzed by genome-wide DNA methylations (3) and histone modifications (4), temporal gene expression patterns detected by whole-transcriptome profile of single cells (5) and huge number of cells (6), a mechanism of zygotic reprogramming uncovered by identifying parental factors that also enhance the generation of induced pluripotent stem cells (iPSCs) (7). Integrating of these multiple resources makes it possible to extensively investigate the molecular basis at early embryogenesis.
Here, we present a novel database, DBTMEE (DataBase of Transcriptome in Mouse Early Embryos), which centralizes gene expression profile at early developmental stages (http://dbtmee.hgc.jp/). Aim of this database is to provide the gene catalog that was established by our ultralarge-scale RNA-seq analysis with high-quality 1.5 × 10⁵ oocytes (6). These oocytes were either used for in vitro fertilization or parthenogenetic activation in order to contribute to the functional characterization of parental genomes (6).
To provide an integrated gateway to the research community, DBTMEE combines our gene expression profile with various public resources, including RNA-seq data of embryonic stem cells (ESCs) and iPSCs (8). Since it has been reported that factors enriched in oocytes and zygotes are good candidates to enhance the reprogramming of somatic cells to iPSCs (7), the inclusion of pluripotent cells will promote stem cell biology. Users can explore (dis)similarly expressed genes across totipotent, pluripotent and differentiated cells while taking genetic and epigenetic characteristics into consideration.
DATA COLLECTION
Ultralarge-scale whole-transcriptome profile
DBTMEE provides a searchable gene expression profile during normal and parthenogenetic early embryo developments that were established previously (6). In brief, we extracted high-quality metaphase II oocytes (Oo) and one-cell stage (1C), two-cell (2C) and four-cell (4C) stage embryos by in vitro fertilization. In addition, we collected mouse embryonic fibroblast cells (MEFs) and parthenogenetic 1C (p1C) and 4C (p4C) embryos. Total RNAs from ≥104 × 2 cells per stage were sequenced by SOLiD system and analyzed by Bioinformatics tools, detecting 17 486 genes that exhibited intriguing expression patterns (Figures 1 and 2). The gene expression patterns categorized by hierarchical clustering are browsable from the front page of DBTMEE (Figure 3A-4).
Figure 1.
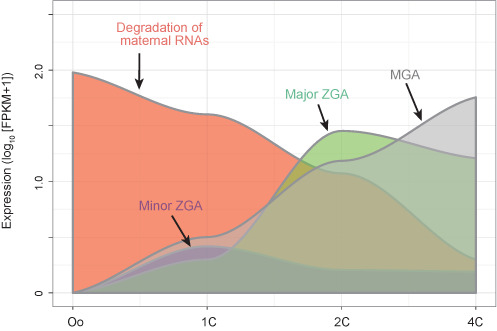
Gene expression patterns observed from RNA-seq data in DBTMEE. Oo, oocytes; 1C, one-cell; 2C, two-cell; 4C, four-cell stage embryos; ZGA, zygotic gene activation; MGA, mid-preimplantation gene activation; FPKM, fragments per kilobase of exon per million mapped reads.
Figure 2.
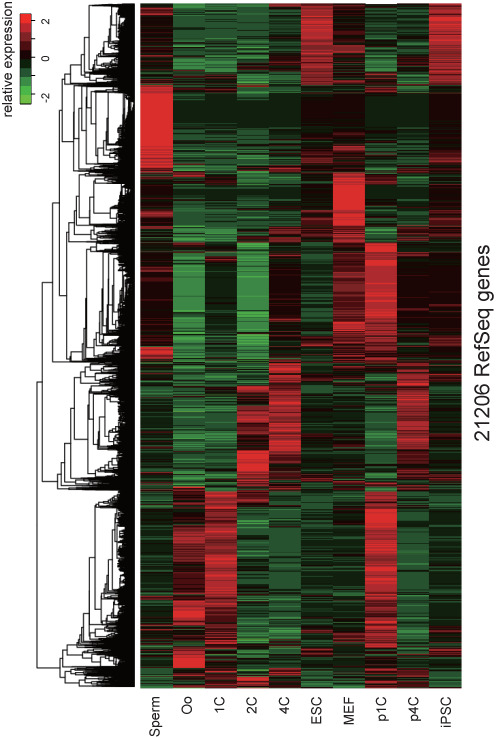
Gene expression profile in DBTMEE ver. 2.0 that contains 21 206 coding and non-coding RefSeq genes. MEF, mouse embryonic fibroblast; p1C, parthenogenetic 1C; p4C, parthenogenetic 4C; iPSC, induced pluripotent stem cell.
Figure 3.
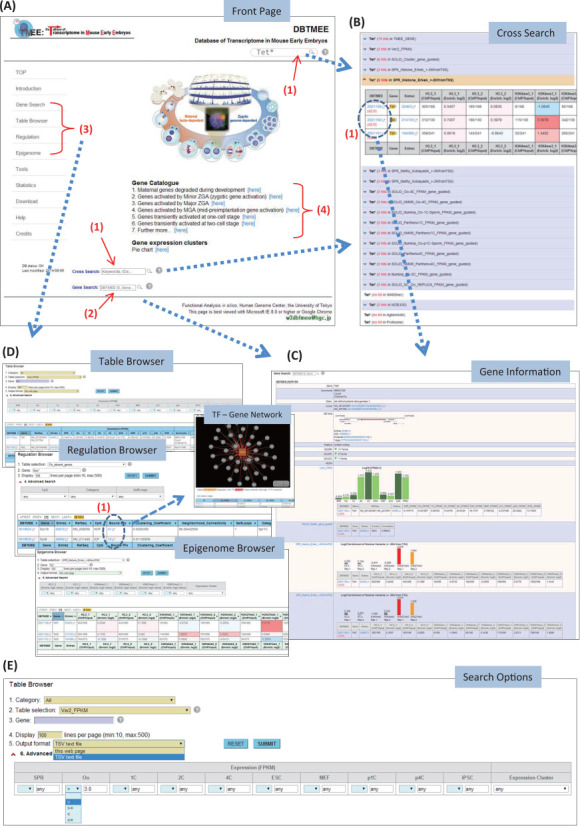
Screenshots of the web interfaces in DBTMEE. The front page (A) displays search boxes that handle a regular expression (A-1, 2) and gene catalog established by clustering of gene expression patterns (A-4). Users can access information of a gene or a set of genes on multiple tables in single web page (B) that contains hyperlinks (B-1) to each gene information page (C). Through the basic and advanced search options in browser interfaces (E) appearing to the left menu (A-3), users can handle more specific search results from a particular table (D).
Multiple public resources
Gene expression profiles established by heterogeneous platforms are valuable resources, giving complementary and extensive information to users. We downloaded three microarray profiles (9–11), and analyzed RNA-seq data sets that were prepared by different sequencing protocols at various embryonic stages and cell types, such as Oo and 2C embryos (12), spermatozoa (3), single-cell oocytes (5), ESCs (8) and iPSCs (8). Also, we downloaded mass spectrometry proteomic data that detected proteins in oocytes and zygotes to be used for linking mRNA to its products (13). In addition, we prepared DNA methylation data (3) and ChIP-seq data of histone variants (4) in spermatozoa, then profiled these epigenetic features for each gene promoter, ±2kbp and ±5kbp from transcription start site (TSS).
MANIPULATION OF DATABASE CONTENTS
We compiled tables from the above-mentioned collections, then built a database with these tables using MongoDB (Ver. 2.4.3, http://www.mongodb.com/) coupled with PHP language (http://php.net/). Since MongoDB offers high scalability, we can efficiently handle a wide range of collections as database tables. We assigned the unique identifiers to RefSeq genes (DBTMEE IDs) to manipulate the database efficiently. Genomic information was prepared from NCBI (http://www.ncbi.nlm.nih.gov/gene/) and MGI (http://www.informatics.jax.org/). The mouse reference genome, mm9 assembly, was downloaded from UCSC genome browser (http://genome.ucsc.edu/).
In our previously published paper (6), we analyzed RNA-seq data using the TopHat (ver. 1.4.1)-Cufflinks (ver. 2.0.2) pipeline (14) and RefSeq annotation (release 46, http://www.ncbi.nlm.nih.gov/refseq/). The quantification of RNA abundances in terms of FPKM, fragments per kilobase of exon per million fragments mapped reads, relies on given RNA-seq data sets. For this reason, we generated many FPKM tables in different combinations with developmental stages and annotations. More information can be found in the help web page of DBTMEE.
To provide the reproducibility of our original study, we have deposited these results into DBTMEE (ver. 1.0). Meanwhile, we have updated the database contents by utilizing the newly released Cufflinks package (ver. 2.2.1) and RefSeq annotation (release 65). Notably, as shown in Figure 2, we calculated FPKMs with whole sequenced reads from 10 embryo stages and cell types at a time, and generated an all-in-one table that contains 21 206 genes expressed at least one stage (DBTMEE ver. 2.0). This table presents not only gene expression transitions during early embryo development but (dis)similar gene expression levels among totipotent, parthenogenetic, pluripotent and differentiated cells.
WEB INTERFACES
Three ways of gene information search and access
To offer high accessibility and usability, we opened up three ways that guide users to searching and filtering records for a particular gene or a set of genes from all the tables.
First, users can enter case-insensitive keywords (i.e. gene names, RefSeq IDs, DBTMEE IDs) into the search field always appearing in the top-right corner (Figure 3A-1), returning records for them from all the tables on single web page (Figure 3B). The keywords highlighted in the result can contain space-delimited multiword and a wildcard ‘*’ that matches all possible strings (Table 1). This may be helpful when users want to find members of a certain gene family.
Table 1. Example of keywords used in the search options.
| Input | Implication |
|---|---|
| Tet1 | Exact match to gene names or aliases |
| DBTMEE:2021159 | Exact match to DBTMEE IDs |
| Tet1 Tet2 | Exact match for ‘Tet1’ or ‘Tet2’a |
| *Sox* | All gene names or aliases containing ‘Sox’ |
| NM_008242* | All RefSeq containing ‘NM_008242’ at the beginning |
| * | All records |
aOR search operator handles multiword
Alternatively, users can directly access gene information by entering an exact keyword into a search box (Figure 3A-2) or through ‘Gene Search’ of the left-side menu (Figure 3A-3). The search result includes genomic features, GO terms and hyperlinks to external databases. It further contains records found from the tables (Figure 3C). In any case, each one of found records contains the unique DBTMEE IDs linked to its gene information page (Figure 3B-1).
As another option to access DBTMEE data, we installed ‘Table Browser’, ‘Regulation’ and ‘Epigenome’ interfaces, which can be found from the left-side menu (Figure 3A-3). The tutorial and help web pages contain detailed information on how to use the interfaces. Through this way, users can browse a particular table by setting basic search fields and advanced search options, then download the results as TSV (tab-separated values) file (Figure 3E). In the regulation browser, we installed Cytoscape Web (http://cytoscapeweb.cytoscape.org/) for visualizing TF-bindings to a gene promoter we inferred (Figure 3D-1).
Basic and advanced search options
In the browser interfaces (Figure 3D), we equipped the basic and advanced search options that enable users to handle more specific search results. For example, in the ‘Table Browser’ (Figure 3E), users must enter a simple regular expression (Table 1) into the ‘3. Gene’ field after selecting a table from the ‘2. Table selection’ field. The ‘1. Category’ field helps to focus the search on tables in a particular category. To download the search result, users have to select ‘TSV text file’ from the ‘5. Output format’ field. In the epigenome browser, this field contains an extra option ‘TSV+Gene expression (V2.0)’ that serves both epigenetic features and gene expression levels in one text file.
The content of advanced options that is combined by AND search operator is dynamically changed corresponding to a table user selected. For example, in the case of tables for gene expression profiles, users can set thresholds for FPKMs and confine genes that exhibit a specific expression pattern.
WORKING EXAMPLE
As an example of DBTMEE usage, we analyzed zygotic gene expression changes that might be associated with paternal histone bivalent marks of H3 lysine 4 trimethylation (H3K4me3) and H3 lysine 27 trimethylation (H3K27me3).
In the web interface of epigenome browser, we chose ‘SPR_Histone_Erkek_+-2KfromTSS’, implying the histone enrichment within ±2kbp from TSS in spermatozoa that was established by Erkek et al. (4), and ‘TSV+Gene expression (V2.0)’ options. Then, we entered ‘*’ into the ‘2. Gene’ field, and set the advanced search options with >1.0 for four fields: H3K4me_1, H3K4me_2, H3K27me_1 and H3K27me_2. Since the advanced search utilizes AND operator, this setting implies that gene promoters are marked by all four ChIP replications of the histones in sperm (i.e. 2-fold enrichment in ChIP against input). This returned 3543 genes as a TSV file that contained their FPKMs. In addition, by setting the options with ≤1.0 for the four fields, we downloaded 3686 genes that were marked by neither histones.
Although we have not installed any analytical tools, users can further analyze the downloaded file as desired. For example, after gathering genes that were not expressed at both p1C and p4C (≤1.0 in FPKM) but were expressed at least one stage, we could prepare 658 and 901 genes that were marked by both histones and by neither histones, respectively (Supplementary Tables S1 and S2). These genes belong to one of the zygotic expression patterns shown in Figure 3A-4. To investigate the influence of paternal histone bivalent marks on early development, we plotted FPKM distributions along the stages in each of the zygotic expression patterns (Figure 4). Interestingly, after fertilization, the bivalently marked genes categorized into 4-cell transient, maternal RNA and minor ZGA patterns are likely to be actively transcribed. Although experimental validations are required, this result might be helpful to identify genes that are affected by sperm transmission and to determine the roles of epigenetic inheritance from sperm.
Figure 4.
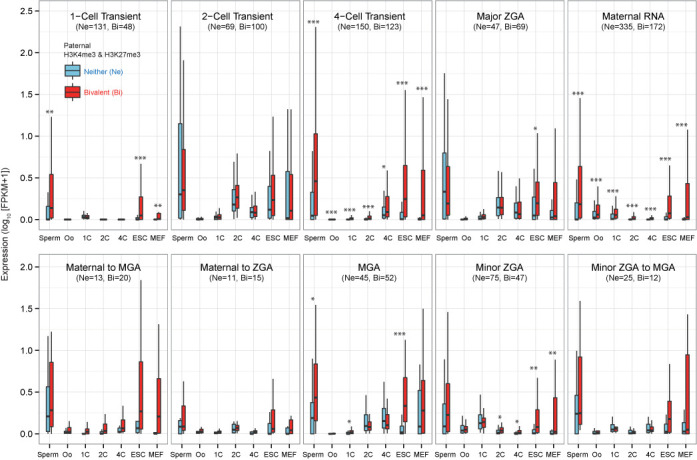
Working example of the analysis of paternal histone bivalent marks with DBTMEE. 658 genes marked by both H3K4me3 and H3K27me3 in sperm and not expressed in parthenogenesis belong to one of 10 zygotic expression patterns. These genes that particularly exhibit 4-cell transient, maternal RNA and minor ZGA patterns are preferentially up-regulated after fertilization. Asterisks represent the level of statistical significance (P-value of Wilcoxon test): *P < 0.01, **P < 0.001, ***P < 0.0001. Ne, genes marked by neither histones; Bi, genes marked by both histones.
Users can find more introductory working examples from the tutorial web page (http://dbtmee.hgc.jp/tutorial/tutorial.php).
CONCLUSIONS
DBTMEE provides the transcriptome profile that we established from mouse early embryos in an unprecedented scale of experiment. To make our ultralarge-scale transcriptome profile more useful, we built the database with not only the results of downstream analyses of the profile but also the deposition of related public resources. We have also designed the user friendly web interfaces that enable users to access the data quickly. Because the high-scalable system manipulates information on the database, we can cover a wide range of collections that will help shed light on the enigmatic fertilization dynamics; e.g. high-resolution single-cell transcriptome data of embryos, allelic-specific gene expression, asymmetric genetic and epigenetic features in blastomeres. We aim to further improve and update the data in future releases, and will implement additional web utilities.
SUPPLEMENTARY DATA
Supplementary Data are available at NAR Online.
Acknowledgments
We thank Drs Yoshinori Makino and Yuki Okada for helpful discussions. The database was developed on the supercomputer system at Human Genome Center, The Institute of Medical Science, The University of Tokyo.
FUNDING
Research Program of Innovative Cell Biology by Innovative Technology, Ministry of Education, Culture, Sports, Science, and Technology, Japan [to DBTMEE]. Research on Regenerative Medicine for Clinical Application, Health and Labour Sciences Research Grants, Japan [to DBTMEE]. Funding for open access charge: Research on Regenerative Medicine for Clinical Application, Health and Labour Sciences Research Grants, Japan.
Conflict of interest statement. None declared.
REFERENCES
- 1.Shultz R.M. The molecular foundations of the maternal to zygotic transition in the preimplantation embryo. Hum. Reprod. Update. 2002;8:323–331. doi: 10.1093/humupd/8.4.323. [DOI] [PubMed] [Google Scholar]
- 2.Wang H., Dey S.K. Roadmap to embryo implantation: clues from mouse models. Nat. Rev. Genet. 2006;7:185–199. doi: 10.1038/nrg1808. [DOI] [PubMed] [Google Scholar]
- 3.Kobayashi H., Sakurai T., Imai M., Takahashi N., Fukuda A., Yayoi O., Sato S., Nakabayashi K., Hata K., Sotomaru Y., et al. Contribution of intragenic DNA methylation in mouse gametic DNA methylomes to establish oocyte-specific heritable marks. PLoS Genet. 2012;8:e1002440. doi: 10.1371/journal.pgen.1002440. [DOI] [PMC free article] [PubMed] [Google Scholar]
- 4.Erkek S., Hisano M., Liang C.Y., Gill M., Murr R., Dieker J., Schubeler D., Vlag J.V., Stadler M.B., Peters A.H. Molecular determinants of nucleosome retention at CpG-rich sequences in mouse spermatozoa. Nat. Struct. Mol. Biol. 2013;20:868–875. doi: 10.1038/nsmb.2599. [DOI] [PubMed] [Google Scholar]
- 5.Tang F., Barbacioru C., Wang Y., Nordman E., Lee C., Xu N., Wang X., Bodeau J., Tuch B.B., Siddiqui A., et al. mRNA-Seq whole-transcriptome analysis of a single cell. Nat. Methods. 2009;6:377–382. doi: 10.1038/nmeth.1315. [DOI] [PubMed] [Google Scholar]
- 6.Park S.J., Komata M., Inoue F., Yamada K., Nakai K., Ohsugi M., Shirahige K. Inferring the choreography of parental genomes during fertilization from ultralarge-scale whole-transcriptome analysis. Genes Dev. 2013;27:2736–2748. doi: 10.1101/gad.227926.113. [DOI] [PMC free article] [PubMed] [Google Scholar]
- 7.Shinagawa T., Takagi T., Tsukamoto D., Tomaru C., Huynh L.M., Sivaraman P., Kumarevel T., Inoue K., Nakato R., Katou Y., et al. Histone variants enriched in oocytes enhance reprogramming to induced pluripotent stem cells. Cell Stem Cell. 2014;14:217–227. doi: 10.1016/j.stem.2013.12.015. [DOI] [PubMed] [Google Scholar]
- 8.Carter A.C., Davis-Dusenbery B.N., Koszka K., Ichida J.K., Eggan K. Nanog-independent reprogramming to iPSCs with canonical factors. Stem Cell Rep. 2014;2:119–126. doi: 10.1016/j.stemcr.2013.12.010. [DOI] [PMC free article] [PubMed] [Google Scholar]
- 9.Hamatani T., Carter M.G., Sharov A.A., Ko M.S. Dynamics of global gene expression changes during mouse preimplantation development. Dev. Cell. 2004;6:117–131. doi: 10.1016/s1534-5807(03)00373-3. [DOI] [PubMed] [Google Scholar]
- 10.Zeng F., Baldwin D.A., Schultz R.M. Transcript profiling during preimplantation mouse development. Dev. Biol. 2004;272:483–496. doi: 10.1016/j.ydbio.2004.05.018. [DOI] [PubMed] [Google Scholar]
- 11.Pfeiffer M.J., Siatkowski M., Paudel Y., Balbach S.T., Baeumer N., Crosetto N., Drexler H.C., Fuellen G., Boiani M. Proteomic analysis of mouse oocytes reveals 28 candidate factors of the ‘reprogrammome’. J. Proteome Res. 2011;10:2140–2153. doi: 10.1021/pr100706k. [DOI] [PubMed] [Google Scholar]
- 12.Macfarlan T.S., Gifford W.D., Driscoll S., Lettieri K., Rowe H.M., Bonanomi D., Firth A., Singer O., Trono D., Pfaff S.L., et al. Embryonic stem cell potency fluctuates with endogenous retrovirus activity. Nature. 2012;487:57–63. doi: 10.1038/nature11244. [DOI] [PMC free article] [PubMed] [Google Scholar]
- 13.Wang S., Kou Z., Jing Z., Zhang Y., Guo X., Dong M., Wilmut I., Gao S. Proteome of mouse oocytes at different developmental stages. Proc. Natl Acad. Sci. 2010;107:17639–17644. doi: 10.1073/pnas.1013185107. [DOI] [PMC free article] [PubMed] [Google Scholar]
- 14.Trapnell C., Roberts A., Goff L., Pertea G., Kim D., Kelley D.R., Pimentel H., Salzberg S.L., Rinn J.L., Pachter L., et al. Differential gene and transcript expression analysis of RNA-seq experiments with TopHat and Cufflinks. Nat. Protoc. 2012;7:562–578. doi: 10.1038/nprot.2012.016. [DOI] [PMC free article] [PubMed] [Google Scholar]