


Abstract
The post-translational regulation of proteins is mainly driven by two molecular events, their modification by several types of moieties and their interaction with other proteins. These two processes are interdependent and together are responsible for the function of the protein in a particular cell state. Several databases focus on the prediction and compilation of protein–protein interactions (PPIs) and no less on the collection and analysis of protein post-translational modifications (PTMs), however, there are no resources that concentrate on describing the regulatory role of PTMs in PPIs. We developed several methods based on residue co-evolution and proximity to predict the functional associations of pairs of PTMs that we apply to modifications in the same protein and between two interacting proteins. In order to make data available for understudied organisms, PTMcode v2 (http://ptmcode.embl.de) includes a new strategy to propagate PTMs from validated modified sites through orthologous proteins. The second release of PTMcode covers 19 eukaryotic species from which we collected more than 300 000 experimentally verified PTMs (>1 300 000 propagated) of 69 types extracting the post-translational regulation of >100 000 proteins and >100 000 interactions. In total, we report 8 million associations of PTMs regulating single proteins and over 9.4 million interplays tuning PPIs.
INTRODUCTION
The complexity of the eukaryotic cell cannot be explained only by the number of genes and proteins but by their complex degree of regulation which includes several levels and mechanisms. Thus, one of the biggest challenges of the new molecular biology is to understand these systems globally in order to extract the active part of the regulation landscape from one or correlated snapshots of a cell state. One important step of this regulation is performed after translation where protein function is defined by the interplay between protein–protein interactions (PPIs) and post-translational modifications (PTMs). These two mechanisms are interdependent since PPIs are described to be regulated by PTMs (1,2) and intermediate enzymes are also subject of modification.
PTMs are indeed an abundant (3) and widely spread (4) source of protein regulation. They are involved in a vast number of functions, from protein stabilizing factors (5) to regulators of molecular switches (6). Their outcome on the proteins depends on the type of the modification, several hundreds are described, and on their possible combinations, PTMs may not act alone but coupled to others by their cooperation or competition (7). A few well-studied examples of functions defined by these types of combinatorial patterns are described in particular protein families, such as the regulation of histones (8) or the regulation of the family of transcription factors Fox0 (9). Some universal PTM combinations also have a known role, as phosphorylation coupled to ubiquitination in the protein degradation pathway (10), and there are several cases of PTM types modifying the same residue in a competitive manner (11). These and other evidences suggest the existence of a universal molecular barcode, dubbed the PTM code, that would encrypt the signal for the regulation of protein location and function including their interaction with other proteins.
Here we present the second release of the PTMcode database, a resource for known and predicted PTM functional associations. For this update we have tripled the number of compiled experimentally verified PTMs (up to ∼300 000) and spread their signal through conserved sites in orthologous proteins of 19 eukaryotic species augmenting this number to 1.3 million. In total, we provide PTM functional annotation for more than 100 000 proteins. For each of them, PTMcode outlines its known and predicted post-translational regulatory landscape which includes the functional links between its modified residues and from this second release also the functional associations between PTMs that may regulate its interaction with other proteins. PTMcode v2 is accessible through the url http://ptmcode.embl.de.
METHODS SUMMARY
Relative Residue Conservation Score (rRCS) calculation
The rRCS measures the conservation of an amino acid within a multiple sequence alignment (MSA) from an orthologous group of proteins. It takes into account the occurrence of the amino acid in the exact position and the maximum branch distance between the species of the proteins with the amino acid conserved, for more details see (12). For this release we used orthologous groups from eggNOG 4.0 (13) and a species tree generated out of marker genes. ETE (14) and treeKO (15) python libraries where used to manipulate trees. DisEMBL algorithm was used for the calculation of protein disordered regions (16).
Co-evolution algorithm
We use mutual information (MI; 17–19) to measure co-evolution of two modified residues. MI is calculated for every pair of PTMs in a protein using the MSA of its most ancient orthologous group. A background distribution of MI values is calculated from non-modified residues of the same protein, type of amino acid and located in similar protein regions (ordered or disordered). Pairs of PTMs with a MI value higher than 95% of the background distribution are selected as co-evolving. For the residues where MI cannot be calculated (for restriction of MI calculation see 12), we calculate the ratio of the conserved site and compared to the distribution of the non-modified sites with the same limitation taken as background, pairs with a ratio above 95% of the background distribution are selected as co-evolving.
Co-evolution algorithm for PPIs
The two proteins of the PPI are mapped to their most ancient orthologous groups. The MSAs from these two orthologous groups are pruned to keep only proteins of their common species. Thus, we guarantee a fair comparison between the conservation of the modified residues over the organisms present in both alignments. After this, the algorithm behaves as described in previous section.
RESULTS
Mapping PTMs from various sources into a single framework
PTMcode v2 provides a highly curated data set of PTMs collected from six public databases: UniProt (20), PHOSIDA (21), PhosphoSite (22), PhosphoELM (23), dbPTM (24) and HPRD (25) and from nine high-throughput experiments reported in papers (11,26–33). Our input data set has tripled the previous release numbers and now consists of 316 546 experimentally verified PTMs of 69 different types spread over 45 361 proteins from 19 eukaryotes (Figure 1A). Modified residues were mapped into reference protein sequences from the eggNOG 4.0 database and each source validated for every protein requiring all its PTMs matching the correct amino acid. Besides the extensive exercise of PTM compilation, the value of our data set relies on the framework built for its collection, mapping, annotation and finally its visualization and data retrieval. PTMcode uses the same protein repertoire and synonyms dictionary as the databases eggNOG (13) and STRING (34), a powerful tool that allows us to easily include orthologs and network neighborhood information. We use the protein orthologous groups provided by eggNOG 4.0 to calculate our rRCS (12, Methods Summary), that evaluates every PTM conservation. For a user tip, a rRCS >95 means that the modified residue is more conserved than the 95% of the same type of amino acids in the same type of region of the protein, still some caution must be taken when filtering the most conserved PTMs in a protein since fast-evolving PTMs may also have functional roles as shown in phosphorylation sites (35).
Figure 1.
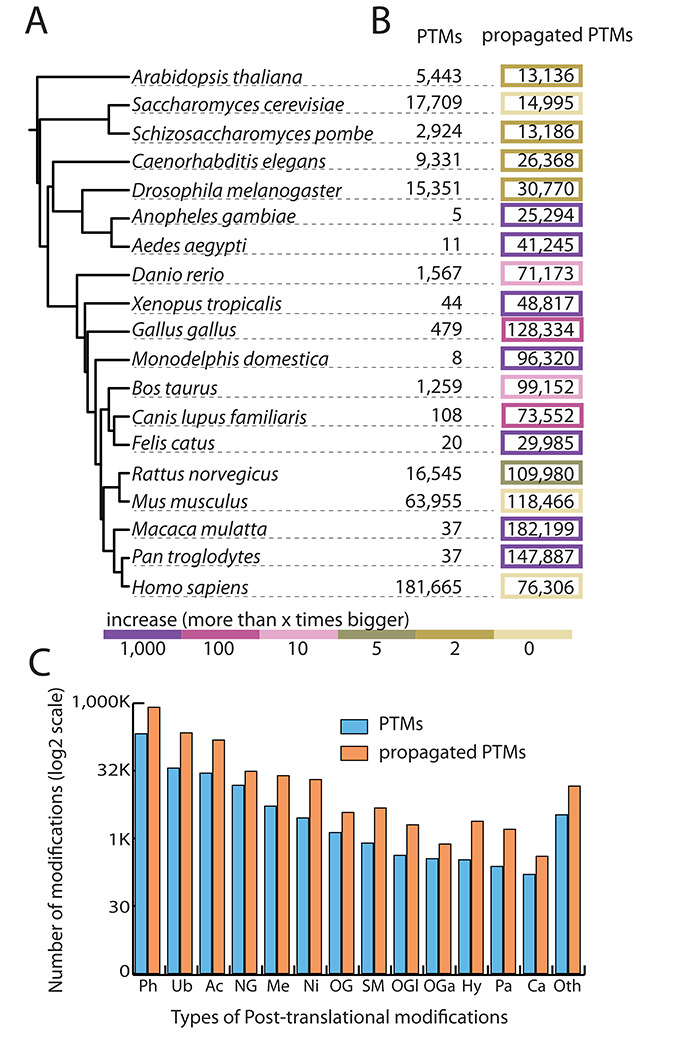
The PTMcode data set. We collected experimentally verified PTMs from 19 eukaryotes (A) and spread their annotation through conserved sites in orthologs tagging the new annotated sites as ‘propagated PTMs’. (B) Shows the increase on the size of available post-translational information per species. Organisms with fewer validated PTMs are the ones showing a higher increase as shown by the color code. (C) Shows the increment of the most abundant PTM types.
PTMcode also offers functional annotation of PTMs. First, they are mapped into highly curated protein domains and unstructured regions provided by the SMART database (36), another resource of reference that allows us to show the modifications in the functional context of the protein. We also provide when available the responsible enzymes for the modifications and a simple description of their potential role as regulators or structural stabilizers depending on the nature of the PTM. As a novelty in this new release we display the number of Pubmed articles in which a PTM has been originally described (extracted directly from the annotation in the sources). This information represents an additional tip for the functionality assessment of a modified site. Indeed, the PTMs described in more Pubmed articles are generally more conserved and have a higher co-evolution rate than those described in few articles (Supplementary Figure S1) which suggests a higher probability to be functional. Finally, PTMcode's main contribution to the field is to provide known and predicted functional associations between PTMs. All these features together make PTMcode an integrative framework for the study of protein post-translational regulation.
Propagating PTM sites to orthologs in other organisms
The new technical advances on the identification of protein-modified sites (37) have drastically increased the availability of PTMs. However, we are still far from having complete PTM repertoires (3) partly due to the condition-specificity of most PTMs (28). The cascade of data production has just started in this field and there are still many organisms with no available high-throughput studies. In addition, although hundreds of different PTM types are described, only a few have been subject of proteome-wide screenings (e.g. phosphorylation, acetylation or glycosylation). Based on these two needs, to cover more species and to amplify the number of modifications of understudied PTM types, PTMcode v2 spreads the signal from experimental validated PTMs to the conserved sites in orthologs from other species, we tag them as ‘propagated PTMs’ (Figure 1B and C).
Indeed, conservation has been widely used as a proxy for functionality (38–40) so it is fair to consider those conserved residues as potentially modified residues with the same constraints that are applied to the use of conservation to the functional assessment of experimentally verified PTMs (35). For example, for a total of 69 875 phosphoserines that could be propagated to human proteins, we obtained 15 914 PTMs matching already known human phosphorylations. This represents a 22.7% of overlap (still a big underestimation since specially the other species phosphoproteome is far from being complete) while the random expectation of hitting the correct residue is 15% taking into account the different distribution of phosphorylations in ordered and disordered regions (8038 known phosphoserines in 172 678 serines in ordered regions and 60 095 known phosphoserines in 577 025 serines in disordered).
Thus, although propagated PTMs should be taken with much caution and used only for exploratory analyses, they exhibit a reasonable overlap with known PTMs as a good indicator for their reliability. By this simple exercise we obtained 1 347 165 sites with a modification signal propagated from verified PTMs allowing us to produce post-translational information for species that otherwise count with almost none experimental data (Figure 2).
Figure 2.
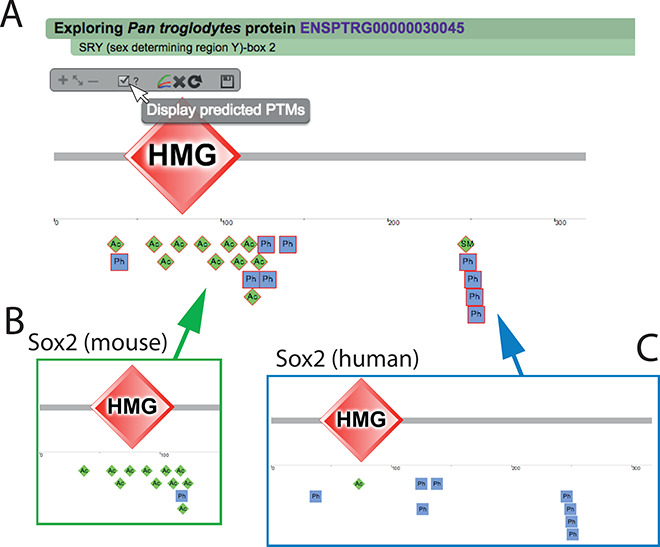
Propagated PTMs. Users can choose to display the propagated PTMs by clicking in the checkbox in the display menu (A). Here, we show the protein Sox2 in Pan troglodytes (A) which had no PTMs experimentally validated while several are predicted from orthologs, mainly acetylations from the mouse copy of the protein (B) and phosphorylations from human (C). Those PTMs were also propagated between mouse and human (not displayed in the figure).
The aim is to bring the number of PTMs of organisms with no large-scale PTM surveys closer to the reality, thus, for Pan troglodytes from which we only could map 10 experimentally verified phosphorylations, we are able to report almost 100 000 propagated phosphorylations, definitely a closer number to the 122 000 validated phosphosites that we have in human. The percentage of increase in the number of PTMs differs among the PTM types, while types with no high-throughput screenings, such as malonylation, nitration, glycation or neddylation, have a high increment (12.1%, 9.8%, 9% and 9.1%, respectively), the most studied PTM types, such as phosphorylation, ubiquitination and acetylation, have an increase of 3.8%, 6% and 5.4%.
Predicting functional links between PTMs within proteins
The main focus of the PTMcode database is the study of PTMs that are functionally linked. Several types of associations are possible (41): PTMs mutually exclusive that compete for the same residue (11), PTMs that are required for others to take place in a signaling cascade (42), PTMs that are close enough to influence each other (1) or even modifications involved in concerted allosteric conformational changes (43). In order to cover this broad spectrum of possible scenarios PTMcode counts on five evidence channels that explore different properties of the coupled PTMs: (i) the ‘co-evolution’ channel (Figure 3A) that extracts pairs of PTMs with a similar evolutionary history (see Methods Summary); (ii) the ‘structural distance’ channel (Figure 3B) that reports close modified residues in 3D structures; (iii) the ‘competition’ channel which highlights residues modified by several PTM types; (iv) the ‘manual annotation’ channel that offers associated PTM pairs described in the literature; and (v) finally, the ‘hotspots’ channel that calculates high-density modified protein regions.
Figure 3.
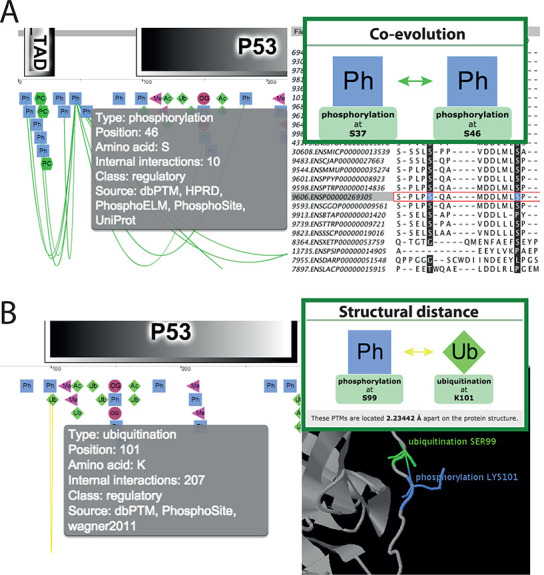
Co-evolution and structural distance channels. The majority of the functional associations between PTM pairs are found by these two types of evidences. (A) The ‘co-evolution’ channel extracts pairs of PTMs that have a common evolutionary history. The protein MSA used to calculate the co-evolution score is displayed using the Jalview plugin where the two modified residues are highlighted for their closer analysis. (B) The ‘structural distance’ channels extracts PTM pairs that are close in PDB protein structures. The Jmol plugin offers further possibilities for their analysis.
We applied our previously described five methodologies (44) to the new data set which includes the propagated PTMs. Thus, PTMcode v2 has now more than 1.2 million functional links of PTMs within the same protein formed of 205 571 PTMs in 21 713 proteins (∼8 million pairs of 1.2 million PTMs in 100K proteins including the propagated PTMs) representing an increase of ∼3.2 times of reported PTM associations (20 times including propagated) compared to previous release.
The ‘co-evolution’ channel is the one that provides the majority of our predictions. In a previous work (12) we showed that co-evolution of PTM pairs can be used as a proxy for their functional association. Indeed, co-evolving PTM pairs were shown to be associated with protein short-linear motifs and globular domains as well as to be closer in sequence and space. Moreover, sets of proteins with particular types of co-evolving PTMs were enriched in certain functions, locations and PPI clusters compared to proteins with non-co-evolving PTMs of the same type. On the other hand, co-evolution is also the evidence channel harder to interpret in terms of mechanism as it may point to very broad functional associations. In this release we have fine-tuned our co-evolution algorithm taking extra controls as we extract pairs of PTMs with a higher co-evolution rate than pairs of non-modified residues in the same protein with the same type of amino acid and placed on similar protein regions (Methods Summary) while before we used the random expectation as background. For instance, a protein ubiquitinated in a disordered region and with a phosphoserine in an ordered region would have as background distribution the co-evolution values of the pairs formed by all non-modified lysines in disordered regions and non-modified serines in ordered regions.
Thus, in PTMcode v2 we report over 1.2 million co-evolving PTM pairs within more than 20 000 proteins (almost 8 million interplays in ∼98 000 proteins if we include the propagated PTMs). Co-evolving PTM pairs with a co-evolution score higher than 95% of the background distribution are reported within the ‘co-evolution’ channel and they may be further explored using the Jalview plugin (45), that visualizes the protein sequence alignment of the orthologous group used for the calculation. The common species where the residues are conserved are also reported in the co-evolution pop-up window.
Predicting functional links between PTMs in interacting proteins
Probably the most ambitious aim for this second PTMcode release is to extract associations between PTMs placed on interacting proteins. These functional links would be candidates to regulate the interaction although several other indirect associations are possible. Several computational approaches have shown enrichments in PTMs clusters in proteins complexes (46) and a higher number of interaction partners in modified proteins compared to non-modified (47). PPIs are indeed subject of this type of regulation mostly due to the activity of PTMs located in protein interfaces (1) although allosteric regulation has also been reported (48). PTMcode v2 provides two channels for the extraction of associated PTMs in the regulation of two interacting proteins, a ‘co-evolution’ and a ‘structural distance’ channel.
We adapted our co-evolution algorithm to measure the interplay between two modified residues from different proteins (see Methods Summary) and applied it to PTMs in physically interacting proteins taken from the STRING 9.1 database (34) with a score over 700. In total, PTMcode v2 provides over 3.6 million predicted PTM associated pairs (∼9.2 million considering propagated PTMs) through the ‘co-evolution’ channel covering ∼11 000 proteins (∼31 000 including propagated PTMs) in ∼44 000 PPIs (∼102 000 adding the propagated PTMs).
In order to assess the accuracy of our co-evolution algorithm catching pairs of associated PTMs within interacting proteins, we compared the results in the PPI data set with the co-evolution scores calculated from pairs of PTMs placed on experimentally proved non-interacting proteins extracted from the Negatome database (49). Although we used the most stringent data set available, Negatome cannot guarantee that the protein pairs do not have another functional association rather than their binding. Still, we found that PPIs show a higher rate of PTMs pairs selected as co-evolving (with our usual threshold of 95) than the non-interacting proteins, compared using a fisher test (P-value < 0.001).
The nature of this ‘co-evolution’ channel allows us to catch not only PTMs that show a direct regulation but also those that would have more broadly defined interplays, such as PTMs, contributing to the same functionality not necessarily at the same stage. Thus, as in the case of co-evolving pairs of PTMs within the same protein users should interpret them from a broad perspective.
The ‘structural distance’ channel aims to collect the PTM pairs that may be in physical contact (if both are present at the same time) by means of their proximity. This does not exclude that distant PTMs in protein interfaces may be co-regulating the interaction. Here, we measure the distance of every two modified residues in protein interfaces that are available over Protein Data Bank (PDB) complex structures (50). We classify as ‘close enough’ the PTM pairs with residues below a separation of 4.69 Å, a threshold extracted from manually curated cross-talking modifications described in our first release (44). A total of 65 000 possible cross-talking PTM pairs (∼79 000 if we add propagated PTMs) are reported. The details of these predicted physical associations can be visualized and further analyzed by the Jmol plugin integrated in PTMcode.
Visualizing PTMs associated with PPIs
PTMcode is a protein-oriented database in which users can search for their favorite protein and get information about its PTMs including their conservation assessment, an overview of the whole protein functional context and the functional associations between them (known and predicted). From this second release it also includes the analysis of the regulation of the PPIs in which the protein is involved. The entry point to the database is either a browser facility to obtain all associations of two particular PTM types or a powerful search engine that now includes the option to search for interacting proteins and jump directly to our ‘PPI view’ mode. Still from a single protein search, users are guided to the ‘single protein view’ mode that now also includes, if PPIs are available for that particular protein, basic information about how many interaction partners it has and the predictions for the PTM associations that may regulate them.
As the main novelty in visualization we have implemented a flash-based network view integrated into our interactive graphic interface where users can explore the network neighborhood centered on their favorite protein and jump to the ‘PPI view’ (Figure 4). There, the two proteins are shown facing each other and every pair of known or predicted associated PTMs may be further analyzed clicking on the channels pop-ups where extra information about every source of evidence is displayed.
Figure 4.
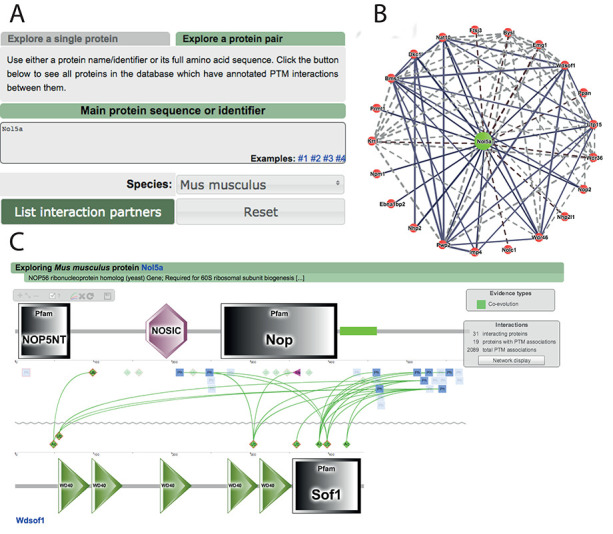
Visualization of functional associations between PTMs in interacting proteins. Users can explore the regulation of the interactions where their favorite protein is involved (A). We implemented a network viewer where all its interactions are displayed (B). Every partner in the network opens the ‘PPI view’, a framework to explore the functional associations found between PTMs from both proteins (C).
CONCLUSIONS
The PTMcode database is imbued by systems biology philosophy in the sense of being a resource that aims to provide a global picture of the post-translational regulatory landscape of eukaryotic proteins. We offer a unique environment where PTMs are shown as active players into the whole functional context of the protein, from its domain architecture to its interaction network neighborhood. Within this framework, in addition to the extra value given to the data taken from other resources, the main contribution of PTMcode to the field is to supply known and predicted functional associations between PTMs. Those associations are extracted using in-house implemented methodologies that measure (i) the co-evolution between two protein residues and (ii) different types of PTMs proximity (close in space or part of highly modified protein regions).
In this second release we have tripled the size of our PTM collection and implemented a simple algorithm for the propagation of the modifications through orthologs making available for the first time a predicted post-translational regulatory scheme for thousands of proteins that had no information available.
Another major update is the analysis of associated PTM pairs in interacting proteins which may contain tips for the regulation of PPIs. This places PTMcode as a bridge of information between databases of PPIs (34,51) and those dedicated to collect and analyze PTMs (21,22).
As the chosen name for the database suggests our final aim is to contribute to the understanding of the so-called PTM code, a molecular barcode composed by function-specific combinations of PTMs. This challenge entails significant limitations. First, we are far from having a complete PTM repertoire even for a single organism and many PTM types are still vastly understudied so their functional impact might be being underestimated. On top of that, both PTMs and PPIs are indeed dependent on particular cell states while they are normally provided as a collage with no condition specificity information. These and others are the challenges for future studies, the new release for our PTMcode database that we report herein comes to add a step forward into this objective since it produces new knowledge out of the collected data feeding the scientific community with more information and more hypothesis.
SUPPLEMENTARY DATA
Supplementary Data are available at NAR Online.
Acknowledgments
We thank Yan Yuan for all his help and support on all technical and infrastructure issues we encountered during this project.
FUNDING
EMBL. Funding for open access charge: EMBL, Meyerhofstrasse 1, 69117 Heidelberg, Germany.
Conflict of interest statement. None declared.
REFERENCES
- 1.Beltrao P., Albanèse V., Kenner L.R., Swaney D.L., Burlingame A., Villén J., Lim W.A., Fraser J.S., Frydman J., Krogan N.J. Systematic functional prioritization of protein posttranslational modifications. Cell. 2012;150:413–425. doi: 10.1016/j.cell.2012.05.036. [DOI] [PMC free article] [PubMed] [Google Scholar]
- 2.Li X., Foley E.A., Kawashima S.A., Molloy K.R., Li Y., Chait B.T., Kapoor T.M. Examining post-translational modification-mediated protein-protein interactions using a chemical proteomics approach. Protein Sci. 2013;22:287–95. doi: 10.1002/pro.2210. [DOI] [PMC free article] [PubMed] [Google Scholar]
- 3.Khoury G.A., Baliban R.C., Floudas C.A. Proteome-wide post-translational modification statistics: frequency analysis and curation of the swiss-prot database. Sci. Rep. 2011;1:90. doi: 10.1038/srep00090. [DOI] [PMC free article] [PubMed] [Google Scholar]
- 4.Beltrao P., Bork P., Krogan N.J., van Noort V. Evolution and functional cross-talk of protein post-translational modifications. Mol. Syst. Biol. 2013;9:714. doi: 10.1002/msb.201304521. [DOI] [PMC free article] [PubMed] [Google Scholar]
- 5.Yamauchi M., Shiiba M. Lysine hydroxylation and cross-linking of collagen. Methods Mol. Biol. 2008;446:95–108. doi: 10.1007/978-1-60327-084-7_7. [DOI] [PubMed] [Google Scholar]
- 6.Van Roey K., Dinkel H., Weatheritt R.J., Gibson T.J., Davey N.E. The switches.ELM resource: a compendium of conditional regulatory interaction interfaces. Sci. Signal. 2013;6:rs7. doi: 10.1126/scisignal.2003345. [DOI] [PubMed] [Google Scholar]
- 7.Hunter T. The age of crosstalk: phosphorylation, ubiquitination, and beyond. Mol. Cell. 2007;28:730–738. doi: 10.1016/j.molcel.2007.11.019. [DOI] [PubMed] [Google Scholar]
- 8.Latham J.A., Dent S.Y.R. Cross-regulation of histone modifications. Nat. Struct. Mol. Biol. 2007;14:1017–1024. doi: 10.1038/nsmb1307. [DOI] [PubMed] [Google Scholar]
- 9.Calnan D.R., Brunet A. The FoxO code. Oncogene. 2008;27:2276–2288. doi: 10.1038/onc.2008.21. [DOI] [PubMed] [Google Scholar]
- 10.Swaney D.L., Beltrao P., Starita L., Guo A., Rush J., Fields S., Krogan N.J., Villén J. Global analysis of phosphorylation and ubiquitylation cross-talk in protein degradation. Nat. Methods. 2013;10:676–682. doi: 10.1038/nmeth.2519. [DOI] [PMC free article] [PubMed] [Google Scholar]
- 11.Danielsen J.M.R., Sylvestersen K.B., Bekker-Jensen S., Szklarczyk D., Poulsen J.W., Horn H., Jensen L.J., Mailand N., Nielsen M.L. Mass spectrometric analysis of lysine ubiquitylation reveals promiscuity at site level. Mol. Cell. Proteom. 2011;10 doi: 10.1074/mcp.M110.003590. doi:10.1074/mcp.M110.003590. [DOI] [PMC free article] [PubMed] [Google Scholar]
- 12.Minguez P., Parca L., Diella F., Mende D., Kumar R., Helmer-Citterich M., Gavin A., van Noort V., Bork P. Deciphering a global network of functionally associated post-translational modifications. Mol. Syst. Biol. 2012;8:599. doi: 10.1038/msb.2012.31. [DOI] [PMC free article] [PubMed] [Google Scholar]
- 13.Powell S., Forslund K., Szklarczyk D., Trachana K., Roth A., Huerta-Cepas J., Gabaldón T., Rattei T., Creevey C., Kuhn M., et al. eggNOG v4.0: nested orthology inference across 3686 organisms. Nucleic Acids Res. 2014;42:D231–D239. doi: 10.1093/nar/gkt1253. [DOI] [PMC free article] [PubMed] [Google Scholar]
- 14.Huerta-Cepas J., Dopazo J., Gabaldón T. ETE: a python Environment for Tree Exploration. BMC Bioinformat. 2010;11:24. doi: 10.1186/1471-2105-11-24. [DOI] [PMC free article] [PubMed] [Google Scholar]
- 15.Marcet-Houben M., Gabaldón T. treeKO a duplication aware algorithm for the comparison of phylogenetic trees. Nucleic Acids Res. 2011;39:e66. doi: 10.1093/nar/gkr087. [DOI] [PMC free article] [PubMed] [Google Scholar]
- 16.Linding R., Jensen L.J., Diella F., Bork P., Gibson T.J., Russell R.B. Protein disorder prediction: implications for structural proteomics. Structure. 2003;11:1453–1459. doi: 10.1016/j.str.2003.10.002. [DOI] [PubMed] [Google Scholar]
- 17.Yip K.Y., Patel P., Kim P.M., Engelman D.M., McDermott D., Gerstein M. An integrated system for studying residue coevolution in proteins. Bioinformatics. 2008;24:290–292. doi: 10.1093/bioinformatics/btm584. [DOI] [PubMed] [Google Scholar]
- 18.Simonetti F.L., Teppa E., Chernomoretz A., Nielsen M., Buslje C. MISTIC: mutual information server to infer coevolution. Nucleic Acids Res. 2013;41:W8–W14. doi: 10.1093/nar/gkt427. [DOI] [PMC free article] [PubMed] [Google Scholar]
- 19.Korber B., Farber R., Wolpert D., Lapedes AS. Covariation of mutations in the V3 loop of human immunodeficiency virus type 1 envelope protein: an information theoretic analysis. Proc. Natl. Acad. Sci. 1993;90:7176–7180. doi: 10.1073/pnas.90.15.7176. [DOI] [PMC free article] [PubMed] [Google Scholar]
- 20.The UniProt Consortium. Activities at the Universal Protein Resource (UniProt) Nucleic Acids Res. 2014;42:D191–D198. doi: 10.1093/nar/gkt1140. [DOI] [PMC free article] [PubMed] [Google Scholar]
- 21.Gnad F., Gunawardena J., Mann M. PHOSIDA 2011: the posttranslational modification database. Nucleic Acids Res. 2010;39:D253–D260. doi: 10.1093/nar/gkq1159. [DOI] [PMC free article] [PubMed] [Google Scholar]
- 22.Hornbeck P.V., Kornhauser J.M., Tkachev S., Zhang B., Skrzypek E., Murray B., Latham V., Sullivan M. PhosphoSitePlus: a comprehensive resource for investigating the structure and function of experimentally determined post-translational modifications in man and mouse. Nucleic Acids Res. 2012;40:D261–D270. doi: 10.1093/nar/gkr1122. [DOI] [PMC free article] [PubMed] [Google Scholar]
- 23.Dinkel H., Chica C., Via A., Gould C.M., Jensen L.J., Gibson T.J., Diella F. Phospho.ELM: a database of phosphorylation sites–update 2011. Nucleic Acids Res. 2011;39:D261–D267. doi: 10.1093/nar/gkq1104. [DOI] [PMC free article] [PubMed] [Google Scholar]
- 24.Lu C.-T., Huang K.-Y., Su M.-G., Lee T.-Y., Bretaña N.A., Chang W.-C., Chen Y.-J., Chen Y.-J., Huang H.-D. dbPTM 3.0: an informative resource for investigating substrate site specificity and functional association of protein post-translational modifications. Nucleic Acids Res. 2012;41:D295–D305. doi: 10.1093/nar/gks1229. [DOI] [PMC free article] [PubMed] [Google Scholar]
- 25.Keshava Prasad T.S., Goel R., Kandasamy K., Keerthikumar S., Kumar S., Mathivanan S., Telikicherla D., Raju R., Shafreen B., Venugopal A., et al. Human Protein Reference Database–2009 update. Nucleic Acids Res. 2009;37:D767–D772. doi: 10.1093/nar/gkn892. [DOI] [PMC free article] [PubMed] [Google Scholar]
- 26.Choudhary C., Kumar C., Gnad F., Nielsen M.L., Rehman M., Walther T.C., Olsen J.V, Mann M. Lysine acetylation targets protein complexes and co-regulates major cellular functions. Science. 2009;325:834–840. doi: 10.1126/science.1175371. [DOI] [PubMed] [Google Scholar]
- 27.Henriksen P., Wagner S.A., Weinert B.T., Sharma S., Bacinskaja G., Rehman M., Juffer A.H., Walther T.C., Lisby M., Choudhary C. Proteome-wide analysis of lysine acetylation suggests its broad regulatory scope in Saccharomyces cerevisiae. Mol. Cell. Proteomics. 2012;11:1510–1522. doi: 10.1074/mcp.M112.017251. [DOI] [PMC free article] [PubMed] [Google Scholar]
- 28.Lundby A., Secher A., Lage K., Nordsborg N.B., Dmytriyev A., Lundby C., Olsen J.V. Quantitative maps of protein phosphorylation sites across 14 different rat organs and tissues. Nat. Commun. 2012;3:876. doi: 10.1038/ncomms1871. [DOI] [PMC free article] [PubMed] [Google Scholar]
- 29.Matic I., Schimmel J., Hendriks I.A., van Santen M.A., van de Rijke F., van Dam H., Gnad F., Mann M., Vertegaal A.C.O. Site-specific identification of SUMO-2 targets in cells reveals an inverted SUMOylation motif and a hydrophobic cluster SUMOylation motif. Mol. Cell. 2010;39:641–652. doi: 10.1016/j.molcel.2010.07.026. [DOI] [PubMed] [Google Scholar]
- 30.Murray C.I., Kane L.A., Uhrigshardt H., Wang S.-B., Van Eyk J.E. Site-mapping of in vitro S-nitrosation in cardiac mitochondria: implications for cardioprotection. Mol. Cell. Proteomics. 2011;10 doi: 10.1074/mcp.M110.004721. doi:10.1074/mcp.M110.004721. [DOI] [PMC free article] [PubMed] [Google Scholar]
- 31.Wagner S.A., Beli P., Weinert B.T., Nielsen M.L., Cox J., Mann M., Choudhary C. A proteome-wide, quantitative survey of in vivo ubiquitylation sites reveals widespread regulatory roles. Mol. Cell. Proteomics. 2011;10 doi: 10.1074/mcp.M111.013284. doi:10.1074/mcp.M111.013284. [DOI] [PMC free article] [PubMed] [Google Scholar]
- 32.Weinert B.T., Wagner S.A., Horn H., Henriksen P., Liu W.R., Olsen J. V., Jensen L.J., Choudhary C. Proteome-wide mapping of the Drosophila acetylome demonstrates a high degree of conservation of lysine acetylation. Sci. Signal. 2011;4:ra48–ra48. doi: 10.1126/scisignal.2001902. [DOI] [PubMed] [Google Scholar]
- 33.Zielinska D.F., Gnad F., Schropp K., Wiśniewski J.R., Mann M. Mapping N-glycosylation sites across seven evolutionarily distant species reveals a divergent substrate proteome despite a common core machinery. Mol. Cell. 2012;46:542–548. doi: 10.1016/j.molcel.2012.04.031. [DOI] [PubMed] [Google Scholar]
- 34.Franceschini A., Szklarczyk D., Frankild S., Kuhn M., Simonovic M., Roth A., Lin J., Minguez P., Bork P., von Mering C., et al. STRING v9.1: protein-protein interaction networks, with increased coverage and integration. Nucleic Acids Res. 2013;41:D808–D815. doi: 10.1093/nar/gks1094. [DOI] [PMC free article] [PubMed] [Google Scholar]
- 35.Tan C.S.H., Bodenmiller B., Pasculescu A., Jovanovic M., Hengartner M.O., Jørgensen C., Bader G.D., Aebersold R., Pawson T., Linding R. Comparative analysis reveals conserved protein phosphorylation networks implicated in multiple diseases. Sci. Signal. 2009;2:ra39. doi: 10.1126/scisignal.2000316. [DOI] [PubMed] [Google Scholar]
- 36.Letunic I., Doerks T., Bork P. SMART 7: recent updates to the protein domain annotation resource. Nucleic Acids Res. 2012;40:D302–D305. doi: 10.1093/nar/gkr931. [DOI] [PMC free article] [PubMed] [Google Scholar]
- 37.Choudhary C., Mann M. Decoding signalling networks by mass spectrometry-based proteomics. Nat. Rev. Mol. Cell Biol. 2010;11:427–439. doi: 10.1038/nrm2900. [DOI] [PubMed] [Google Scholar]
- 38.Boekhorst J., van Breukelen B., Heck A., Snel B. Comparative phosphoproteomics reveals evolutionary and functional conservation of phosphorylation across eukaryotes. Genome Biol. 2008;9:R144. doi: 10.1186/gb-2008-9-10-r144. [DOI] [PMC free article] [PubMed] [Google Scholar]
- 39.Landry C.R., Levy E.D., Michnick S.W. Weak functional constraints on phosphoproteomes. Trends Genet. 2009;25:193–197. doi: 10.1016/j.tig.2009.03.003. [DOI] [PubMed] [Google Scholar]
- 40.Chen S.C.-C., Chen F.-C., Li W.-H. Phosphorylated and nonphosphorylated serine and threonine residues evolve at different rates in mammals. Mol. Biol. Evol. 2010;27:2548–2554. doi: 10.1093/molbev/msq142. [DOI] [PMC free article] [PubMed] [Google Scholar]
- 41.Venne A.S., Kollipara L., Zahedi R.P. The next level of complexity: crosstalk of posttranslational modifications. Proteomics. 2014;14:513–524. doi: 10.1002/pmic.201300344. [DOI] [PubMed] [Google Scholar]
- 42.Lyons N.A., Fonslow B.R., Diedrich J.K., Yates J.R., Morgan D.O. Sequential primed kinases create a damage-responsive phosphodegron on Eco1. Nat. Struct. Mol. Biol. 2013;20:194–201. doi: 10.1038/nsmb.2478. [DOI] [PMC free article] [PubMed] [Google Scholar]
- 43.Nussinov R., Tsai C.-J., Xin F., Radivojac P. Allosteric post-translational modification codes. Trends Biochem. Sci. 2012;37:447–455. doi: 10.1016/j.tibs.2012.07.001. [DOI] [PubMed] [Google Scholar]
- 44.Minguez P., Letunic I., Parca L., Bork P. PTMcode: a database of known and predicted functional associations between post-translational modifications in proteins. Nucleic Acids Res. 2013;41:D306–D311. doi: 10.1093/nar/gks1230. [DOI] [PMC free article] [PubMed] [Google Scholar]
- 45.Waterhouse A.M., Procter J.B., Martin D.M.A., Clamp M., Barton G.J. Jalview Version 2–a multiple sequence alignment editor and analysis workbench. Bioinformatics. 2009;25:1189–1191. doi: 10.1093/bioinformatics/btp033. [DOI] [PMC free article] [PubMed] [Google Scholar]
- 46.Woodsmith J., Kamburov A., Stelzl U. Dual coordination of post translational modifications in Human Protein Networks. PLoS Comput. Biol. 2013;9:e1002933. doi: 10.1371/journal.pcbi.1002933. [DOI] [PMC free article] [PubMed] [Google Scholar]
- 47.Yachie N., Saito R., Sugiyama N., Tomita M., Ishihama Y. Integrative features of the yeast phosphoproteome and protein–protein interaction map. PLoS Comput. Biol. 2011;7:e1001064. doi: 10.1371/journal.pcbi.1001064. [DOI] [PMC free article] [PubMed] [Google Scholar]
- 48.Nussinov R., Ma B., Tsai C.-J., Csermely P. Allosteric conformational barcodes direct signaling in the cell. Structure. 2013;21:1509–1521. doi: 10.1016/j.str.2013.06.002. [DOI] [PMC free article] [PubMed] [Google Scholar]
- 49.Blohm P., Frishman G., Smialowski P., Goebels F., Wachinger B., Ruepp A., Frishman D. Negatome 2.0: a database of non-interacting proteins derived by literature mining, manual annotation and protein structure analysis. Nucleic Acids Res. 2014;42:D396–D400. doi: 10.1093/nar/gkt1079. [DOI] [PMC free article] [PubMed] [Google Scholar]
- 50.Berman H.M., Kleywegt G.J., Nakamura H., Markley J.L. The future of the protein data bank. Biopolymers. 2012;99:218–222. doi: 10.1002/bip.22132. [DOI] [PMC free article] [PubMed] [Google Scholar]
- 51.Orchard S., Ammari M., Aranda B., Breuza L., Briganti L., Broackes-Carter F., Campbell N.H., Chavali G., Chen C., del-Toro N., et al. The MIntAct project–IntAct as a common curation platform for 11 molecular interaction databases. Nucleic Acids Res. 2014;42:D358–D363. doi: 10.1093/nar/gkt1115. [DOI] [PMC free article] [PubMed] [Google Scholar]