


Abstract
CATdb (http://urgv.evry.inra.fr/CATdb) is a database providing a public access to a large collection of transcriptomic data, mainly for Arabidopsis but also for other plants. This resource has the rare advantage to contain several thousands of microarray experiments obtained with the same technical protocol and analyzed by the same statistical pipelines. In this paper, we present GEM2Net, a new module of CATdb that takes advantage of this homogeneous dataset to mine co-expression units and decipher Arabidopsis gene functions. GEM2Net explores 387 stress conditions organized into 18 biotic and abiotic stress categories. For each one, a model-based clustering is applied on expression differences to identify clusters of co-expressed genes. To characterize functions associated with these clusters, various resources are analyzed and integrated: Gene Ontology, subcellular localization of proteins, Hormone Families, Transcription Factor Families and a refined stress-related gene list associated to publications. Exploiting protein–protein interactions and transcription factors-targets interactions enables to display gene networks. GEM2Net presents the analysis of the 18 stress categories, in which 17 264 genes are involved and organized within 681 co-expression clusters. The meta-data analyses were stored and organized to compose a dynamic Web resource.
INTRODUCTION
Although complete genome sequences are available for various organisms and despite the fact that it is now relatively easy to sequence a whole new genome and then to localize its genes, the functional annotation of these genes remains a big challenge. Hanson et al. (1) estimated that for eukaryotic organisms, whose genomes were completely sequenced, 20–40% of predicted genes do not have an assigned function. Even for the Arabidopsis thaliana, the first plant genome to be sequenced in 2000 (2) and for which a wealth of gene annotation is available, only 16% of all genes have a validated function and in fact 5105 genes are still orphan i.e. without any annotation about their function (see ‘Orphan gene definition’ in Materials and Methods). Arguably, the first functional annotation procedures, based on sequence similarities, have reached their limit due to the high complexity and heterogeneity of genomes activity. For the last 20 years, high-throughput technologies have made it possible to assess the behaviors of genes in a broader context and co-expression studies based on transcriptomic data are now considered to be a relevant approach to characterize and decipher the function of genes (3–6).
CATdb (7) can now contribute to take up this challenge. Originally CATdb was developed to manage the Arabidopsis microarrays data generated by the URGV transcriptomic platform (http://www-urgv.versailles.inra.fr/microarray/). CATdb provides access to a large collection of transcriptomic data for A. thaliana, which were all obtained with the two-color CATMA (Complete Arabidopsis Transcriptome Micro Array) microarrays (8). The design of the CATMA microarrays has been regularly updated and includes almost all the annotated genes of Arabidopsis, combining the official annotation of TAIR (The Arabidopsis Information Resource (9)) with gene predictions from the EuGene software tool (10). Thus, the ‘home made’ CATMA microarrays are distinct from other Arabidopsis microarrays, for example CATMA includes 5095 genes that are not targeted by the commonly used ATH1 GeneChip® microarray from Affymetrix and this specificity has been successfully exploited in the past to discover new genes (11). The latest version of CATMA (CATMAv7) targets 35 656 genes. Finally, since its first release, the information system of CATdb has been upgraded to follow the technological developments of the platform. Currently, CATdb stores transcriptomic data for 20 distinct species obtained with four DNA chip technologies and totalizing 4838 CATMA, 1464 Affymetrix, 1208 NimbleGen and 48 Agilent microarrays. At present, the database includes 282 projects (231 for Arabidopsis and 51 for other species) and contains almost 10 000 hybridized samples (five times more than in 2008 for the first CATdb publication (1)), which are publicly accessible at http://urgv.evry.inra.fr/CATdb. For each project, a complete description going from the experimental design to the detailed features of the samples, the normalized intensity ratios and the results of differential expression analysis are available. The 4613 distinct samples represent 28 organs of the plant harvested at 132 development stages. Out of all samples, 1657 are extracted from plants treated with one of the 186 factors described in CATdb. Hence, the CATdb content increases regularly and includes a large range of experiments around the transcriptomic data for various plants.
In this article, we present a new module of CATdb called GEM2Net. Its main objective is to provide a global and comprehensive overview of the co-expression units of genes responding to a panel of stress stimuli. Our approach relies on a model-based clustering method applied to a carefully selected set of CATMA experiments dealing with the transcriptome of Arabidopsis under various stress conditions. Compared to other Arabidopsis resources like Genevestigator (12), the Stanford Microarray Database (13), GeneMania (14), MapMan (15) or ATTED-II (16,17), GEM2Net contains complementary and original features. As pointed out by Horan et al. (18), the results of such studies might suffer from the heterogeneous origins of the data. Moreover, in these latter resources, the co-expression is measured by computing the correlation between all pairs of gene across microarray datasets. In contrast our model-based clustering approach is meant to detect groups of genes and not only pairs. Besides, the discovery of new genes involved in plant response to biotic and abiotic stresses constitutes an important challenge in plant biology with relevance to agriculture and ecology since it could represent a potential starting point for plant breeding. To date, few databases related to plant stresses have been developed: the Stress-Responsive Transcription Factor Database (19), Arabidopsis Stress Responsive Gene Database (20) or Plant Stress Gene Database (21). These databases provide access to a list of curated stress genes extracted from literature, but this quality of information is incompatible with a global analysis. At a genome scale, Lan et al. (22) predicted new stress response genes by combining machine learning methods on genes with known functions and described by transcriptome data.
In this article, we developed the main original features of GEM2Net: (i) the global analysis of a homogeneous and dedicated transcriptomic dataset, (ii) the use of a model-based clustering approach to study gene co-expression and (iii) a set of bioinformatic developments and tools to integrate, analyze and visualize the meta-data that characterize each gene co-expression unit.
MATERIALS AND METHODS
Gene annotations from various resources are described in Supplementary Table S1.
Orphan gene definition
A Perl script was developed to identify genes that are orphan of function using TAIR (genome release R10) functional description of the 33 602 genes. A gene was considered as orphan of function if its description complies with these criteria: (i) no Gene Ontology (GO) annotation, or (ii) the terms ‘unknown protein’ or ‘hypothetical protein’ are set in biological process and molecular function from Gene Ontology and (iii) no known protein motif as defined by InterPro is associated. Following these criteria, 5105 genes have been determined as orphan of function in the Arabidopsis Reference set. We point out that this definition of orphans is restrictive and focuses on genes that are completely unknown.
Gene set enrichment tests
The enrichments of clusters in GO Slim terms, subcellular localization terms, orphan genes, transcription factors (TFs), hormones or stress-triggered genes in literature were assessed using a hypergeometric test to compare the number of genes in each cluster associated to the studied meta-data to its expected value in the genome (34 042 genes). Over-representation was declared statistically significant when the P-value was lower than 0.01. In the case of protein–protein interactions (PPI), we used a permutation approach to assess the significance of the number of PPI in a cluster. In brief, for every cluster, we counted the number of PPI and denoted this number k. Then we randomly sampled 1000 clusters of the same size and counted the number of PPI in each of those random clusters. We retrieved a P-value by computing the proportion of random clusters having a number of PPI larger than or equal to k. We considered P-values smaller than 5% to be significant.
Database and web implementation
CATdb was implemented using the PostgreSQL (v9.1.2) RDBMS. Attention was brought to the normalization process during conception, whereas pertinent indexes were created to improve performances with tables that need to be intensively queried. A Web interface for accessing GEM2Net content was developed with the PHP (release 5.3.3) language to benefit from its integration as a module of Apache HTTP server (https://httpd.apache.org/). Object-oriented programming concepts were applied to take advantage of the easy maintainability qualities in development of a complex interface. Dynamic rendering was added using Javascript libraries (Jquery, Json) and functions, in order to facilitate the navigation between pages and then improve the user experience. The Cytoscape Web software tool (v1.0.4) was downloaded from http://cytoscapeweb.cytoscape.org and was integrated to the interface. It provides the useful interactivity for the visualization of networks obtained from PPI data or target genes links to TF data.
RESULTS
Transcriptomic dataset
To provide a global insight into the plant response to an environmental change or biological attack, a set of CATMA microarrays (387 dye-swaps) dedicated to biotic or abiotic stresses were extracted from CATdb. Their normalized expression differences were the starting point of this meta-analysis project. All these data have the rare advantage to have been generated with the same technical protocols and the same statistical pipelines including the normalization and the differential analysis (refer to Gagnot et al. (1) for details). Overall, GEM2Net explores 18 stress categories (Figure 1) describing nine biotic and nine abiotic stresses.
Figure 1.
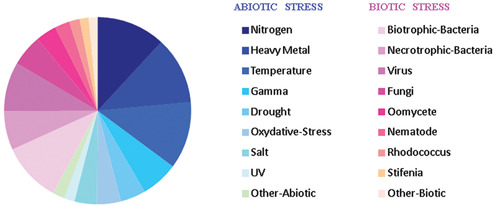
Stress categories. Pie chart representing the classification of the CATdb experimental comparisons into 18 stress categories, nine biotic and nine abiotic stresses.
To define the set of genes to be considered in each stress category, some criteria were taken into account: (i) only genes for which a probe with a good specificity and without missing values were mined, (ii) raw P-values of these genes for each comparison were adjusted to control a global FWER (corrective term equals the number of genes by 387) and only genes for which at least one of the adjusted P-values was lower than 0.05 were kept, (iii) genes were removed if they were declared differentially expressed only once when the transcriptome comparison was made on two or more biological replicates. Finally a total of 17 264 genes were found to be differentially expressed in at least one stress experiment. By stress category, this number ranges from 1565 to 13 807.
Co-expression analysis
To directly identify co-expression units of several genes, the co-expression analysis was performed with a model-based clustering approach. The idea is that there exist unknown subpopulations that are observable through the expression differences. Model-based clustering aims at identifying this underlying structure in modeling the unknown distribution of transcription profiles by a mixture of parametric distributions, each one representing a subpopulation of genes. Since observations are the expression differences, a subpopulation represents a cluster of genes having the same dynamic of response across all the comparisons. Practically, multidimensional Gaussian mixtures of 2–100 subpopulations with unequal proportions were estimated with the MIXMOD software (23). Covariance matrices were constrained so that their volumes were differing and their orientation and shape were equal. Among this collection of mixtures, the Bayesian Information Criterion (BIC) curve as a convex function of the number of subpopulations was checked to guarantee that the modeling fitted well the data. This assessment of the BIC behavior was the origin of the definition of the stress categories, since an analysis based on the 387 comparisons considered together led to an unstable behavior of BIC, proof of an issue of modeling. The best mixture according to BIC was selected to find the number of co-expression units and to perform the classification task. Two classification rules were applied: (i) all genes were classified according to the Maximum A Posteriori (MAP) rule by assigning each gene into the cluster for which the conditional probability is the highest and (ii) only genes with a highest conditional probability greater than a threshold were classified. This threshold was fixed for each analysis so that as many genes as possible were classified, under the constraint that the proportion of misclassified genes is controlled at a level of 5%. This classification rule is called Multi-class False Discovery Rate (MFDR) (24) and is an extension of the previously described BFDR (25).
Following this procedure, a total of 681 clusters equal to co-expression units were identified for the 18 stress categories. According to the MFDR rule, the percentage of classified genes with high confidence ranged from 20 to 67% and out of the 17 264 analyzed genes, only 8% of them (1469 genes) were never classified with high confidence. An example of a co-expression profile is presented in Supplementary Figure S1 and all the co-expression profiles are accessible in GEM2Net module. The quality of a cluster can be evaluated through the size of the boxplots: a boxplot with a reasonably small size means that all the genes have the same dynamic of response. Although the biological replicates are coherent at the level of the whole set of genes, the clustering method highlights that some biological comparisons may behave differently for a given subset of genes. Aubourg et al. (11) have already observed this phenomenon. On the top of the profile, the percentage of genes differentially expressed is indicated for each comparison. It can be useful to identify the comparisons that are relevant for the cluster under study.
From cluster annotation to gene function
Clustering of gene expression profiles has long been considered a fruitful approach to gain insight into gene function (26,27). It is based on the ‘guilt by association’ concept, which assumed that genes with similar expression profiles are likely to have similar functions. Once a cluster has been identified, it is common to perform an enrichment analysis to detect whether annotated genes share the same characteristics to give more clues about function of orphan genes of this cluster (28). Our model-based clusters were annotated with meta-data gained from multiple resources dedicated to Arabidopsis (see Supplementary Table S1 for more details on resources), the main one being TAIR, which is the reference site for the Arabidopsis genome. The latest release of Arabidopsis genome (TAIR version 10) was used in addition to the Plant Slim Gene Ontology (29), which gives a broad overview of the ontology content without the detail of the specific fine grained terms (40 terms). From this classification, we extracted a list of genes known to be involved in stress response and having an associated publication (we named this list Bibliostress). Afterward, the meta-data were refined by considering databases specialized in families of Arabidopsis genes for both significant functional groups involved in stress, i.e. the TFs from the Regulators project (30) and the hormone-related genes from the Arabidopsis Hormone Database (AHD 2.0) (31). Whatever the source of annotation chosen, a cluster was qualified as ‘enriched for an annotation’ if the result of a hypergeometric test was significant for this cluster (P-value < 0.01). The main steps of the analyses workflow are described in Figure 2. A global view of the numbers of annotated genes regarding a series of meta-data is summarized in Table 1, and highlights some characteristics of the GEM2Net dataset compared to the Arabidopsis genome (the Reference). Out of the 5105 orphan genes from the Reference, 2165 (42%) were found to be impacted by stress in the GEM2Net dataset; this was close to the expected value of 50% in view of the proportion in all genes (17 264/34 042). Moreover, an equivalent distribution of orphan genes was found in biotic, abiotic and the individual 18 stress categories (Supplementary Table S2). The stability of the number of orphan genes points out a regular distribution of the knowledge level throughout stress categories, even if the number of experiments was not equivalent. In regard to the gene annotation related to stress, an expected enrichment is found for the GEM2Net dataset with 23% of genes annotated with GO terms linked to stress (BP stress column) against 15% in the Reference set, and 12% against 7.5% for the Bibliostress meta-data. An original characteristic of the GEM2Net gene set, which is visible in Table 1, is the enrichment in TFs (9 against 6.5% for the Reference), a class of genes that are essential to regulate transcription of other genes, especially in the response to stress.
Figure 2.
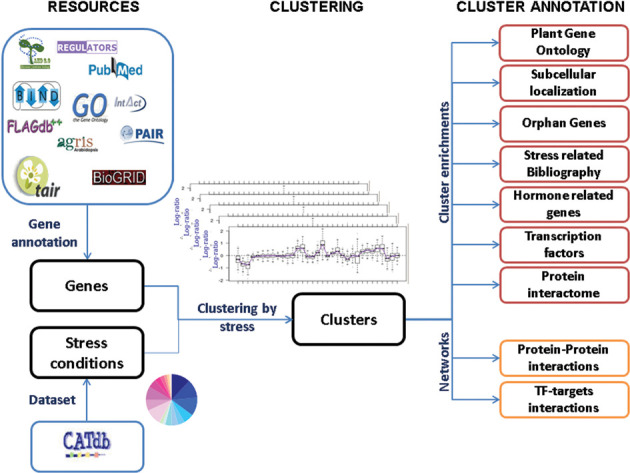
Workflow of GEM2Net. This workflow describes the bioinformatics steps required from the classification of CATdb experimental comparisons toward cluster annotation and gene interaction networks, with integration of the various meta-data.
Table 1. Number of genes by meta-data in GEM2Net gene set and Arabidopsis genome Reference.
| Total | Orphan | BP stress | Bibliostress | TF | Hormone | |
|---|---|---|---|---|---|---|
| Arabidopsis Reference | 34 042 | 5105 (15%) | 5106 (15%) | 2580 (7.5%) | 2260 (6.5%) | 695 (2%) |
| GEM2Net dataset | 17 264 | 2165 (13%) | 4003 (23%) | 2064 (12%) | 1578 (9%) | 487 (3%) |
Comparison of the number of genes between Reference (all Arabidopsis genes) and GEM2Net dataset for the following meta-data: Orphan genes; BP stress gathers two terms of Biological Process from GO (‘response to stress’ and ‘response to abiotic or biotic stress’); Bibliostress lists the stress-responsive genes with related bibliography extracted from GO; TF is a list of genes characterized as TFs in the Regulators project; Hormone is a list of genes having a link with hormone response as annotated in the AHD2.0 database. Numbers in bold highlight significant gene set enrichments of the GEM2Net compared to the Reference datasets (binomial test with P-value < 0.05).
Concerning the cluster annotation enrichment analyses, 98% of the clusters have a functional bias in at least one GO term and 80% are associated to the stress term ‘response to stress’ or ‘response to abiotic or biotic stress’. Despite the expected bias in stress category, other biases are found and make it possible to decipher the functions of orphan genes. For instance, 63% of the clusters are enriched in the GO term ‘transport’ and 39% are enriched in ‘plastid’ as a prediction of the subcellular localization of proteins. These numerous enrichments indicate that our large-scale co-expression study generates biologically meaningful clusters and performs favorably as compared to those obtained with correlation-based approaches by Heyndrickx et al. (32).
Visualization of meta-data
The GEM2Net Web interface (http://urgv.evry.inra.fr/GEM2NET) allows users to query the database by stress category or to submit a list of genes of interest to retrieve the stress categories they are implicated in. It is possible to answer questions like ‘are my genes of interest involved in the same co-expression unit?’ by exploring graphically the results of meta-data analyses. To identify at a glance and summarize the potential functional biases of each cluster, GEM2Net proposes an original representation and interactive visualization, using pie charts and graphs. For each stress category, cluster annotation analyses are divided into several tabs, one per meta-data type, which allow the organization of complex and abundant results. In such tabs, a central panel displays every cluster as a pie chart whose diameter is directly related to the total number of genes in the cluster. Colored sections within a pie chart materialize the numbers of genes of the corresponding meta-data when over-represented. For example, Figure 3 presents a view of clusters enrichment analyses for the GO Slim branch ‘Biological Process’ of the ‘Virus’ stress category. Complementary information related to each cluster is also available in a table nearby the central panel, which appears when moving the mouse over a given cluster. In Figure 4, a synthetic view of one cluster, the cluster_49 from the ‘Virus’ stress category, shows a summary of all the meta-data analyses done for this cluster. In each pie chart, significant enrichments are seen in color for few meta-data analyses, e.g. in the GO terms ‘cell organization and biogenesis’ and ‘response to stress’ of the ‘Biological Process’ ontology. The complete list of 213 genes of cluster_49 appears in a table sorted by gene roles in the selected meta-data type and highlights their implication in other biases by colored circles.
Figure 3.
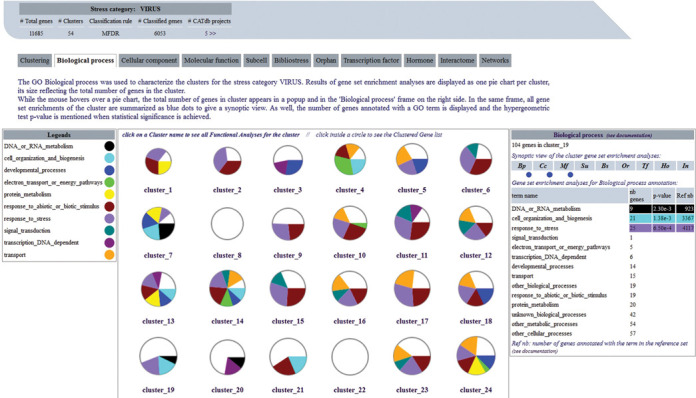
GO Biological Process analyses for the ‘Virus’ stress category. The GEM2Net web page representing the GO ‘Biological Process’ pie charts for all the clusters of Virus stress category. Statistically significant results of gene set enrichment tests are displayed with colored sections, and gene counts and P-values are mentioned in the information frame on the right side. In the same frame, all analysis results are summarized with blue points for the cluster being hovered over with the mouse.
Figure 4.
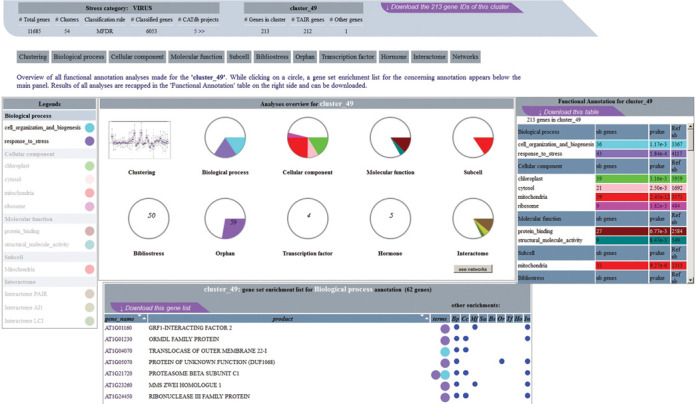
Meta-analyses overview for Cluster_49 of the ‘Virus’ stress category. Synoptic view of the meta-data analyses performed on the cluster_49 is shown in the central panel and results of all analyses are summarized in the frame table on the upper right side. Part list of the genes involved in the Biological Process bias is seen below the central panel. In this table, each gene accession is tagged with colored circle(s) (legend table on the left) and other meta-data enrichments are indicated on the right with blue points when appropriate.
GEM2Net integrates protein interactomes and targets of TF data from external resources (Supplementary Table S1), so gene clusters can be viewed as interactive biological networks (Figure 5), thanks to the embedded Cytoscape Web software tool (33). Adding gene annotation, e.g. TFs families, GO terms or choosing experimentally confirmed PPI, makes it easier to predict regulatory networks of biological relevance and to identify new functional partners. Therefore, by combining gene annotation corresponding to relevant meta-analyses with the available interaction networks in GEM2Net, it is possible to gather clues to infer the biological functions of some orphan genes in a co-expression unit.
Figure 5.
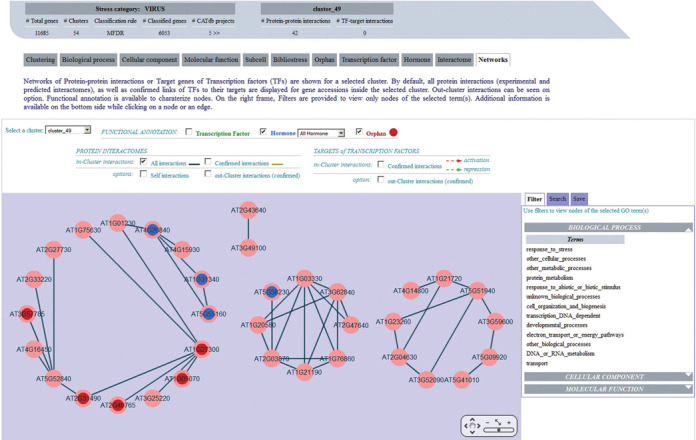
Protein Interactome Network for Cluster_49 of the ‘Virus’ stress category. In the central panel, all PPI (edges) between gene accessions (nodes) within the cluster_49 are represented with dark blue lines, using the Cytoscape Web software tool. Functional annotation is superimposed on nodes by selecting the corresponding checkbox above, hormone families (in blue) and orphans (in red) here. On the right frame, filters on GO categories can be applied to the network to view only nodes of the selected annotation. In addition, a ‘Targets of Transcription Factors’ option is available to display this type of interaction in the same network.
DISCUSSION
The new CATdb module, GEM2Net, was developed to summarize the transcriptomic responses of Arabidopsis to various stress conditions. The goal is to provide new information that will give new insights into plant stress responses and orphan genes involved in these responses when they are crossed with other experimental data or knowledge. The major outputs of GEM2Net are (i) the classification of several CATdb projects in biotic and abiotic stress categories, (ii) a global co-expression analysis using a model-based clustering approach that is not so often used in genomic analyses, (iii) a visualization system that summarizes rapidly the cluster annotation enrichments in terms of Gene Ontology, genes cross-referenced in stress-related bibliography, hormone and TF families, (iv) the gene interaction networks constructed with protein interactome data or TF-target interactions that are involved in each cluster. To progress further, we plan to integrate other types of meta-data, such as the cis-regulatory motifs detected in promoters of genes belonging to a same cluster (34). This may give the possibility to associate a cis-regulatory motif to a particular stress stimulus, thus providing a valuable resource to complete interactions between TFs and their targets. To refine the co-expression units, we would update data with new transcriptome comparisons in each stress category. Thanks to the model-based clustering approach, it does not necessitate restarting completely the co-expression analysis. For instance, it was recently applied to investigate the roles of MAP kinases in Arabidopsis immune response to a microbial stress (35). Therefore, GEM2Net is an ongoing project and new meta-analyses will be released in the future to share the results with a large scientific community.
To conclude, GEM2Net aims at taking advantage of using controlled data associated to consistent meta-data to define relevant co-expression clusters, to improve their annotation and, thus to enhance the predictive power of assigning the right functions to orphan genes. Besides, since the plant responses to abiotic and biotic stresses are regulated by complex signaling networks and are associated with massive changes in gene expression, the GEM2Net results also allow building new hypotheses that might be the starting points for future biological projects.
SUPPLEMENTARY DATA
Supplementary Data are available at NAR Online.
Acknowledgments
The authors thank G. Celeux (INRIA), C. Maugis-Rabusseau (INSA Toulouse), S. Huet (INRA), C. Keribin (University of Paris-Sud), N. Verzelen (INRA) and C. Giraud (University of Paris-Sud) for helpful discussions within the working group SONATAStat. The authors thank Philippe Grevet for computer system administration and PostgreSQL management at URGV.
Footnotes
The authors wish it to be known that, in their opinion, the first three authors should be regarded as Joint First Authors.
Present address: Jean-Pierre Renou, IRHS, INRA, Beaucouze F-49071, France.
FUNDING
Funding for open access charge: National Institute of Agricultural Research (INRA): Plant Biology and Breeding division and Applied Mathematics and Informatics division.
Conflict of interest statement. None declared.
REFERENCES
- 1.Hanson A.D., Pribat A., Waller J.C., de Crécy-Lagard V. ‘Unknown’ proteins and ‘orphan’ enzymes: the missing half of the engineering parts list—and how to find it. Biochem. J. 2009;425:1–11. doi: 10.1042/BJ20091328. [DOI] [PMC free article] [PubMed] [Google Scholar]
- 2.Genome Initiative Arabidopsis. Analysis of the genome sequence of the flowering plant Arabidopsis thaliana. Nature. 2000;408:796–815. doi: 10.1038/35048692. [DOI] [PubMed] [Google Scholar]
- 3.Shaik R., Ramakrishna W. Genes and co-expression modules common to drought and bacterial stress responses in Arabidopsis and rice. PLoS One. 2013;8:e77261. doi: 10.1371/journal.pone.0077261. [DOI] [PMC free article] [PubMed] [Google Scholar]
- 4.Dozmorov M.G., Giles C.B., Wren J.D. Predicting gene ontology from a global meta-analysis of 1-color microarray experiments. BMC Bioinformatics. 2011;12:S14. doi: 10.1186/1471-2105-12-S10-S14. [DOI] [PMC free article] [PubMed] [Google Scholar]
- 5.Wren J.D. A global meta-analysis of microarray expression data to predict unknown gene functions and estimate the literature-data divide. Bioinformatics. 2009;25:1694–1701. doi: 10.1093/bioinformatics/btp290. [DOI] [PMC free article] [PubMed] [Google Scholar]
- 6.Usadel B., Obayashi T., Mutwil M., Giorgi F.M., Bassel G.W., Tanimoto M., Chow A., Steinhauser D., Persson S., Provart N.J. Co-expression tools for plant biology: opportunities for hypothesis generation and caveats. Plant Cell Environ. 2009;32:1633–1651. doi: 10.1111/j.1365-3040.2009.02040.x. [DOI] [PubMed] [Google Scholar]
- 7.Gagnot S., Tamby J.P., Martin-Magniette M.L., Bitton F., Taconnat L., Balzergue S., Aubourg S., Renou J.P., Lecharny A., Brunaud V. CATdb: a public access to Arabidopsis transcriptome data from the URGV-CATMA platform. Nucleic Acids Res. 2008;36:D986–D990. doi: 10.1093/nar/gkm757. [DOI] [PMC free article] [PubMed] [Google Scholar]
- 8.Crowe M.L., Serizet C., Thareau V., Aubourg S., Rouzé P., Hilson P., Beynon J., Weisbeek P., van Hummelen P., Reymond P., et al. CATMA—a complete Arabidopsis GST database. Nucleic Acids Res. 2003;31:156–158. doi: 10.1093/nar/gkg071. [DOI] [PMC free article] [PubMed] [Google Scholar]
- 9.Lamesch P., Berardini T.Z., Li D., Swarbreck D., Wilks C., Sasidharan R., Muller R., Dreher K., Alexander D.L., Garcia-Hernandez M., et al. The Arabidopsis Information Resource (TAIR): improved gene annotation and new tools. Nucleic Acids Res. 2012;40:D1202–D1210. doi: 10.1093/nar/gkr1090. [DOI] [PMC free article] [PubMed] [Google Scholar]
- 10.Foissac S., Gouzy J., Rombauts S., Mathe C., Amselem J., Sterck L., Van de Peer Y., Rouzé P., Schiex T. Genome annotation in plants and fungi: EuGene as a model platform. Curr. Bioinformatics. 2008;3:87–97. [Google Scholar]
- 11.Aubourg S., Martin-Magniette M.L., Brunaud V., Taconnat L., Bitton F., Balzergue S., Jullien P.E., Ingouff M., Thareau V., Schiex T., et al. Analysis of CATMA transcriptome data identifies hundreds of novel functional genes and improves gene models in the Arabidopsis genome. BMC Genomics. 2007;8:401–410. doi: 10.1186/1471-2164-8-401. [DOI] [PMC free article] [PubMed] [Google Scholar]
- 12.Hruz T., Laule O., Szabo G., Wessendorp F., Bleuler S., Oertle L., Widmayer P., Gruissem W., Zimmermann P. Genevestigator v3: a reference expression database for the meta-analysis of transcriptomes. Adv. Bioinformatics. 2008;2008:420747. doi: 10.1155/2008/420747. [DOI] [PMC free article] [PubMed] [Google Scholar]
- 13.Hubble J., Demeter J., Jin H., Mao M., Nitzberg M., Reddy T.B., Wymore F., Zachariah Z.K., Sherlock G., Ball C.A. Implementation of GenePattern within the Stanford Microarray Database. Nucleic Acids Res. 2009;37:D898–D901. doi: 10.1093/nar/gkn786. [DOI] [PMC free article] [PubMed] [Google Scholar]
- 14.Zuberi K., Franz M., Rodriguez H., Montojo J., Lopes C.T., Bader G.D., Morris Q. GeneMANIA prediction server 2013 update. Nucleic Acids Res. 2013;41:W115–W122. doi: 10.1093/nar/gkt533. [DOI] [PMC free article] [PubMed] [Google Scholar]
- 15.Klie S., Nikoloski Z. The choice between MapMan and Gene Ontology for automated gene function prediction in plant science. Front Genet. 2012;3:115. doi: 10.3389/fgene.2012.00115. [DOI] [PMC free article] [PubMed] [Google Scholar]
- 16.Obayashi T., Kinoshita K., Nakai K., Shibaoka M., Hayashi S., Saeki M., Shibata D., Saito K., Ohta H. ATTED-II: a database of co-expressed genes and cis elements for identifying co-regulated gene groups in Arabidopsis. Nucleic Acids Res. 2007;35:D863–D869. doi: 10.1093/nar/gkl783. [DOI] [PMC free article] [PubMed] [Google Scholar]
- 17.Obayashi T., Nishida K., Kasahara K., Kinoshita K. ATTED-II updates: condition-specific gene coexpression to extend coexpression analyses and applications to a broad range of flowering plants. Plant Cell Physiol. 2011;52:213–219. doi: 10.1093/pcp/pcq203. [DOI] [PMC free article] [PubMed] [Google Scholar]
- 18.Horan K., Jang C., Bailey-Serres J., Mittler R., Shelton C., Harper J.F., Zhu J.K., Cushman J.J.C., Gollery M., Girke T. Annotating genes of known and unknown function by large-scale co-expression analysis. Plant Physiol. 2008;147:41–57. doi: 10.1104/pp.108.117366. [DOI] [PMC free article] [PubMed] [Google Scholar]
- 19.Naika M., Shameer K., Mathew O.K., Gowda R., Sowdhamini R. STIFDB2: an updated version of plant stress-responsive transcription factor database with additional stress-signals, stress-responsive transcription factor binding sites and stress-responsive genes in Arabidopsis and rice. Plant Cell Physiol. 2013;54:e8. doi: 10.1093/pcp/pcs185. [DOI] [PMC free article] [PubMed] [Google Scholar]
- 20.Borkotoky S., Saravanan V., Jaiswal A., Das B., Selvaraj S., Murali A., Lakshmi P.T. The Arabidopsis Stress Responsive Gene Database. Int. J. Plant Genomics. 2013;2013:949564. doi: 10.1155/2013/949564. [DOI] [PMC free article] [PubMed] [Google Scholar]
- 21.Prabha R., Ghosh I., Singh D.S. Plant Stress Gene Database: a collection of plant genes responding to stress condition. ARPN J. Sci. Technol. 2011;1:28–31. [Google Scholar]
- 22.Lan H., Carson R., Provart N.J., Bonner A.J. Combining classifiers to predict gene function in Arabidopsis thaliana using large-scale gene expression measurements. BMC Bioinformatics. 2007;8:358–374. doi: 10.1186/1471-2105-8-358. [DOI] [PMC free article] [PubMed] [Google Scholar]
- 23.Biernacki C., Celeux G., Govaert G., Langrognet F. Model-based cluster and discriminant analysis with the MIXMOD software. Comput. Stat. Data Anal. 2006;51:587–600. [Google Scholar]
- 24.Mary-Huard T., Perduca V., Martin-Magniette M.L., Blanchard G. 45e, J. Statistique, SFDS Proceedings. Toulouse: 2013. Error rate control for classification rules in multi-class mixture models. [DOI] [PubMed] [Google Scholar]
- 25.Efron B., Tibshirani R. Empirical Bayes methods and false discovery rates for microarrays. Genet. Epidemiol. 2002;23:70–86. doi: 10.1002/gepi.1124. [DOI] [PubMed] [Google Scholar]
- 26.Eisen M.B., Spellman P.T., Brown P.O., Botstein D. Cluster analysis and display of genome-wide expression patterns. Proc. Natl Acad. Sci. U.S.A. 1998;95:14863–14868. doi: 10.1073/pnas.95.25.14863. [DOI] [PMC free article] [PubMed] [Google Scholar]
- 27.Schöner D., Barkow S., Bleuler S., Wille A., Zimmermann P., Bühlmann P., Gruissem W., Zitzler E. Network analysis of systems elements. EXS. 2007;97:331–351. doi: 10.1007/978-3-7643-7439-6_14. [DOI] [PubMed] [Google Scholar]
- 28.Atias O., Chor B., Chamovitz D.A. Large-scale analysis of Arabidopsis transcription reveals a basal co-regulation network. BMC Syst. Biol. 2009;3:86–107. doi: 10.1186/1752-0509-3-86. [DOI] [PMC free article] [PubMed] [Google Scholar]
- 29.Berardini T.Z., Mundodi S., Reiser R., Huala E., Garcia-Hernandez M., Zhang P., Mueller L.M., Yoon J., Doyle A., Lander G., et al. Functional annotation of the Arabidopsis genome using controlled vocabularies. Plant Physiol. 2004;135:1–11. doi: 10.1104/pp.104.040071. [DOI] [PMC free article] [PubMed] [Google Scholar]
- 30.Castrillo G., Turck F., Leveugle M., Lecharny A., Carbonero P., Coupland G., Paz-Ares J., Oñate-Sanchez L. Speeding cis-trans regulation discovery by phylogenomic analyses coupled with screenings of an arrayed library of Arabidopsis transcription factors. PLoS One. 2011;6:e21524. doi: 10.1371/journal.pone.0021524. [DOI] [PMC free article] [PubMed] [Google Scholar]
- 31.Jiang Z., Liu X., Peng Z., Wan Y., Ji Y., He W., Wan W., Luo J., Guo H. AHD2.0: an update version of Arabidopsis Hormone Database for plant systematic studies. Nucleic Acids Res. 2011;39:D1123–D1129. doi: 10.1093/nar/gkq1066. [DOI] [PMC free article] [PubMed] [Google Scholar]
- 32.Heyndrickx K.S., Vandepoele K. Systematic identification of functional plant modules through the integration of complementary data sources. Plant Physiol. 2012;159:884–901. doi: 10.1104/pp.112.196725. [DOI] [PMC free article] [PubMed] [Google Scholar]
- 33.Lopes C.T., Franz M., Kazi F., Donaldson S.L., Morris Q., Bader G.D. Cytoscape Web: an interactive web-based network browser. Bioinformatics. 2010;26:2347–2348. doi: 10.1093/bioinformatics/btq430. [DOI] [PMC free article] [PubMed] [Google Scholar]
- 34.Bernard V., Lecharny A., Brunaud V. Improved detection of motifs with preferential location in promoters. Genome. 2010;9:739–752. doi: 10.1139/g10-042. [DOI] [PubMed] [Google Scholar]
- 35.Frei Dit Frey N., Garcia A.V., Bigeard J., Zaag R., Bueso E., Garmier M., Pateyron S., de Tauzia-Moreau M.L., Brunaud V., Balzergue S., et al. Functional analysis of Arabidopsis immune-related MAPKs uncovers a role for MPK3 as negative regulator of inducible defenses. Genome Biol. 2014;15:R87. doi: 10.1186/gb-2014-15-6-r87. [DOI] [PMC free article] [PubMed] [Google Scholar]