


Abstract
Identification of cancer driver gene mutations is crucial for advancing cancer therapeutics. Due to the overwhelming number of passenger mutations in the human tumor genome, it is difficult to pinpoint causative driver genes. Using transposon mutagenesis in mice many laboratories have conducted forward genetic screens and identified thousands of candidate driver genes that are highly relevant to human cancer. Unfortunately, this information is difficult to access and utilize because it is scattered across multiple publications using different mouse genome builds and strength metrics. To improve access to these findings and facilitate meta-analyses, we developed the Candidate Cancer Gene Database (CCGD, http://ccgd-starrlab.oit.umn.edu/). The CCGD is a manually curated database containing a unified description of all identified candidate driver genes and the genomic location of transposon common insertion sites (CISs) from all currently published transposon-based screens. To demonstrate relevance to human cancer, we performed a modified gene set enrichment analysis using KEGG pathways and show that human cancer pathways are highly enriched in the database. We also used hierarchical clustering to identify pathways enriched in blood cancers compared to solid cancers. The CCGD is a novel resource available to scientists interested in the identification of genetic drivers of cancer.
INTRODUCTION
New technologies such as next generation sequencing and array-based methods for detecting genome-wide methylation and single nucleotide polymorphisms have created an avalanche of data on cancer biology. Large-scale efforts like the International Cancer Genome Consortium (ICGC) and The Cancer Genome Atlas (TCGA) have used these technologies to systematically interrogate a large number of human cancers along with matched normal tissue samples. The rationale behind these expensive undertakings is that an increased understanding of the genetic basis of cancer will lead to improved therapies and survival. These large datasets have unquestionably improved our understanding of the genetic basis of individual cancers and have led to the discovery of new biomarkers and therapeutic targets. Unfortunately, even with the stated goal of whole genome sequencing of 1000 cancers combined with whole exome sequencing of 10 000 cancers, it will still be difficult, if not impossible, to identify the majority of the genetic drivers of human cancer due to the low penetrance of most of these drivers (1).
To address this problem, we developed a novel forward genetic screen in mice capable of identifying both high- and low-penetrance drivers (2,3). This technique has been used by our lab and others to identify over 6000 candidate genetic drivers of cancer in eight different cancer types to date. The relevance of these findings has been confirmed in studies of human cancer. For example, both RSPO2 and CDK8 were initially identified in our forward genetic screen for intestinal cancer (4) and these two genes were subsequently confirmed to be oncogenes in human cancer (5–7). The gene lists identified by our screens can be used to interpret the vast amount of data produced by TCGA and others, enabling cancer researchers to hone in on bona fide low-penetrance drivers that are hidden among the vastly larger background of passenger mutations. This information will aid in the development of new biomarkers and treatment modalities targeting these rare genetic events.
To facilitate analysis of driver genes we created the Candidate Cancer Gene Database (CCGD), which catalogs all common insertion sites (CISs) and their corresponding genes identified in published studies using transposon insertional mutagenesis. The current version includes data and results from 28 publications covering 40 individual screens. All data have been manually curated and genomic loci have been updated to the current genome build. Queries can use mouse, human, rat, fly, zebrafish, or yeast symbols or EntrezID # and searches can be by gene, study or cancer type. This allows users to determine if a gene of interest is a putative cancer driver gene and quickly generate a list of driver genes that have been identified in a particular tumor type. The data can be downloaded and links are provided for accessing external databases. This database will facilitate the search for new targets and biomarkers in human cancer and the data can be mined for pathway disruptions in individual cancers and common disruptions in all cancers. To demonstrate the usefulness of the database for analysis of human driver genes, we performed a modified gene set enrichment analysis (GSEA) using KEGG pathways and show that human cancer pathways are highly enriched in the database. We also used hierarchical clustering to identify pathways enriched in blood cancers compared to solid cancers.
DATABASE AND SOURCE DATA
Published studies
The CCGD contains data from all published transposon-based forward genetic screens for cancer (Supplementary Table S1). The current version of this list can be automatically generated in PubMed using the CCGD by selecting the bibliography link on the Help page. The database also contains a ‘Study Explanation’ for each study, which includes a summary paragraph describing the study's purpose and a description of the genetically engineered mice, and a description of the specific tables that were incorporated into the CCGD along with any notes pertinent to the data. This information is accessible from several links on various pages in the CCGD, including a full list that can be accessed by selecting ‘How were studies interpreted for this database?’ from the Help page. Each study was assigned a unique identifier consisting of the first author and publication year. We added a number to the end of this identifier to account for multiple publications in the same year by the same author (e.g. ‘Starr 2009-01’).
Data curation
Cancer type
There are more than 200 different types of cancers affecting over 60 different organs in the body. To simplify this complexity and make the CCGD more user friendly, we placed the published studies into eight broad categories (Supplementary Table S1). As more transposon-based screens are published, this list will expand. We chose to consolidate cancers into broad groups in order to facilitate queries by cancer type. Alternatively, the user can manually select a subset of studies if they desire a different grouping.
Gene symbol conversions and homology determination
We used official gene symbols and IDs from NCBI Gene (http://www.ncbi.nlm.nih.gov/gene). We converted unofficial gene symbols and aliases to official NCBI gene symbols and IDs. When combined with IDs from NCBI HomoloGene (http://www.ncbi.nlm.nih.gov/homologene), the official symbols and IDs allowed us to create CIS homology data for Homo sapiens, Rattus norvegicus, Danio rerio, Drosophila melanogaster, and Saccharomyces cerevisiae. The use of official symbols also allowed us to associate records with genes present in the Cancer Gene Census (CGC) (http://www.sanger.ac.uk/research/projects/cancergenome/census.html) and the COSMIC database (http://cancer.sanger.ac.uk/cancergenome/projects/census/) maintained by the Wellcome Trust Sanger Institute. To ensure that all user queried genes are valid, the CCGD pipeline confirms the presence of the gene symbol in the list of official gene symbols. If the gene symbol is not recognized, a Warning screen appears. To reduce curation burden, we automated many tasks involving processing of downloads from NCBI Gene, NCBI HomoloGene, Sanger CGC, and Sanger COSMIC (Code available upon request).
CIS genomic coordinates
Transposon screens identify candidate cancer genes based on an analysis of the frequency of transposon insertions into any location in the mouse genome. If the frequency of transposon insertions in a given genomic region is higher than expected by chance, the region is called a CIS and the genes within or near this region are identified as candidate cancer genes. Multiple methods have been used to identify CISs, including the Poisson distribution, Monte Carlo simulations, and Gaussian kernel convolution. The CCGD reports the CIS coordinates and genes identified by the authors of each study. CIS genome coordinates reported in studies using older versions of the mouse genome build were updated to the current genome build using the UCSC LiftOver tool (http://genome.ucsc.edu/cgi-bin/hgLiftOver). A subset of studies used a gene-centric analysis and did not report genome coordinates. For these studies we used the gene start and end coordinates as the CIS start and end coordinates. If a study identified a CIS using a peak location method, we used the peak location as both the start and end CIS genome coordinate.
CIS candidate genes
The candidate gene(s) associated with a CIS were based on each individual study. We did not alter the authors’ original interpretations. If multiple genes were associated with a single CIS, each gene was entered as a separate CIS. All unofficial gene symbols listed in the publications were converted to the official NCBI symbol. If a CIS was not associated with any annotated gene, the CIS genomic coordinate was assigned as the candidate gene for that CIS.
Relative rank
We assigned each CIS a letter grade corresponding to the relative rank of the CIS in the study. Depending upon the study, the relative rank was based either on the number of insertions in a given CIS or the P-value associated with the given CIS. In a few studies neither of these values were reported and these CISs were labeled as ‘Not Ranked’. The ranking is based on the individual study and cannot be used to compare between studies. The relative rank was calculated by ranking all CISs in a given study and then assigning grades. We assigned a letter grade of A for the top 10%, B for the top 11–25%, C for the top 26–50% and D for the bottom 50%. For example, if a study identified 100 CISs, the first 10 would receive an A ranking.
WEBSITE
Search page
We designed a Search page (http://ccgd-starrlab.oit.umn.edu/search.php) to allow cancer researchers to quickly identify if one or more genes have been identified as potential cancer drivers. The Search page default allows a user to simultaneously query by cancer type, study and gene. The cancer and study fields both support multiple selections. Each entry in the gene field must be separated by a space. The gene field accepts a minus character (‘−’) as an exclusion operator and an asterisk character (‘*’) as a wildcard at the end of a partial word. The gene field accepts pasted text from a user's operating system clipboard. The dropdowns below the gene field allow a user to search by human, rat, mouse, fly, yeast, or zebrafish gene symbols or gene IDs.
Search Results page
A query from the Search page returns a table of genes on the Search Results page (Figure 1). The table shows mouse gene symbol, mouse gene ID, human gene symbol and relative rank for each gene. Very long records are shown truncated with an ellipsis. Above the table an Export button can be used to generate and download a comma-separated file or a BED formatted file of all results. Below the table are navigation arrows that allow the user to review 25 records at a time. The bottom of the page contains an area that shows query terms and indicates whether any query terms were not matched to a known NCBI gene symbol or ID. Each row hyperlinks to a Gene Detail page.
Figure 1.
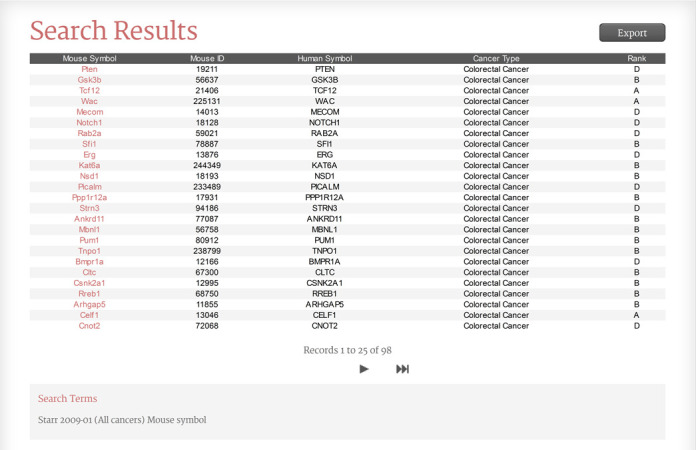
The Candidate Cancer Gene Database Search Results page.
Gene Detail page
The Gene Detail page contains information that does not reliably fit on the Search Results page (Figure 2). This includes the orthologous gene in Homo sapiens, Rattus norvegicus, Drosophila melanogaster, Danio rerio and Saccharomyces cerevisiae genomes. The page contains other information such as CIS coordinates, study, cancer type, relative rank and predicted effect. In addition, the page shows the total number of studies finding the gene as a CIS and notes whether the gene appears in the Sanger COSMIC database or the Sanger CGC list. The page has hyperlinks to NCBI Gene, NCBI HomoloGene, NCBI PubMed, Sanger COSMIC and GeneCards (http://www.genecards.org/). If the database record contains complete CIS information, the page also provides hyperlinks to genome browsers at UCSC (http://genome.ucsc.edu/) and Ensembl (http://www.ensembl.org/). The study title hyperlinks to an explanation of study interpretation and each field title hyperlinks to an explanation of field meaning.
Figure 2.
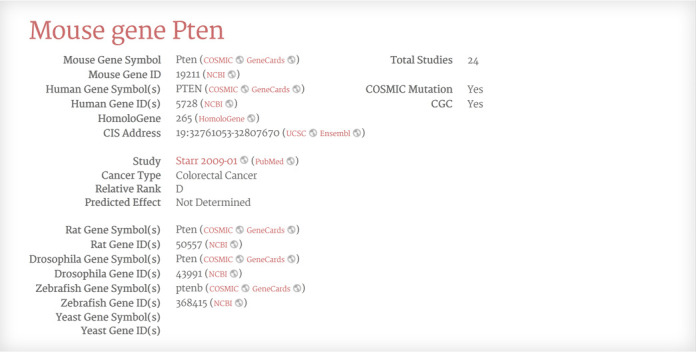
The Candidate Cancer Gene Database Gene Detail page.
Other pages
The website contains other pages to improve its usability. These include an About page that explains database function, a Download page that sends the user a complete list of CIS records, a Help page that offers answers to common questions, a step-by-step tutorial, a Links page of external resources and a Contact page with an email address (ccgd@umn.edu) for questions and feedback.
PATHWAY ANALYSIS
The genes in the CCGD were identified in mouse models. To ascertain the relevance of the genes in the CCGD to human cancer, we applied case-oriented GSEA (8) using the CIS gene lists from each study; and to identify 94 out of 285 KEGG human pathways (9,10) that were enriched with genes from the CCGD (Supplementary Table S2 and Supplemental Methods). KEGG pathways are divided into six categories, of which 69 are annotated as ‘human disease’ pathways; 20 of these are cancer-specific (Supplementary Table S3). If the CCGD were enriched for human disease genes, and especially cancer genes, we would expect these pathways to be identified more frequently by GSEA. Supporting this hypothesis, 39 out of 94 pathways (41.5%) identified were in the human disease category, which is higher than would be expected by chance (69/285 = 24.2%; P-value = 0.001, one-sided t test). We also found that of the 39 human disease pathways identified by GSEA, 19 of them (48.7%) were cancer-specific, which is also higher than would be expected by chance (20/69 = 29%; P-value = 0.03, one-sided t test). These results indicate the CCGD is identifying human disease genes, especially relating to cancer pathways.
Twenty of the top 32 pathways (FDR <0.00001) identified by GSEA were human disease pathways. Of the remaining 12 pathways, the majority were pathways well known to be involved in cancer including ErbB, Jak-STAT, mTOR, Notch, PI3K-Akt and p53 signaling pathways. As more studies are added to the CCGD, the database will be useful for identifying pathways specific to subsets of cancer based on organ site or other variables. To test this hypothesis, we analyzed blood cancers compared to non-blood cancers by performing unsupervised hierarchical clustering of studies and pathways (Supplementary Figure S1 and Supplemental Methods). We chose blood cancers because there are large numbers of blood cancers represented in the studies in the CCGD (12 out of 28) (Supplementary Table S4). Except for three outliers, all blood cancers and all non-blood cancer studies clustered together (Supplementary Figure S1). Using logistic regression, we identified 60 pathways strongly associated (P <0.05) with blood cancers (Supplementary Table S5 and Supplemental Methods). The top three signaling pathways associated with blood cancers were Ras, Jak-STAT and PI3k-Akt. In addition to identifying pathways, the CCGD can be used to identify potential therapeutic targets that could be pursued. For example, there were six genes that were mutated in at least six of the 12 blood cancer studies (AKT2, ERG, STAT5B, FOXP1, NOTCH1, RASGRP1) and several clinical trials are currently testing agents that target some of these genes.
DISCUSSION
The CCGD improves accessibility and usability of forward genetic screen data. Most importantly, the database provides a central access point for retrieving candidate cancer driver genes identified in all published transposon-based forward genetic screens for cancer. Researchers can quickly answer the question, ‘Is my favorite gene a candidate cancer gene?’. Alternatively, users can quickly retrieve the answer to the question, ‘What candidate cancer genes have been identified in liver cancer?’. Accessibility is greatly enhanced because the data have been manually curated and converted to the current genome builds and official gene symbols. In addition, using automatic downloads of HomoloGene, the data can be queried seamlessly using gene lists from multiple species including human, mouse, rat, fly, zebrafish and yeast. In addition to the presence or absence of the gene, our manual curation of the relative rank allows researchers to gauge the relative importance of the identified gene. We will continue adding to the CCGD as new studies are published.
The CCGD will complement existing databases such as TCGA and the Retroviral Tagged Cancer Gene Database (11) in the search for cancer drivers. The quality of the data contained in mouse forward genetic screens continues to be validated as genes discovered in these screens are subsequently proven to be human cancer drivers. Our brief analysis of the contents of the CCGD using GSEA indicates that the genes present in the CCGD are highly relevant to human cancer drivers. The main use of this database will be to help cancer researchers focus on genes and pathways that are causing cancer, in order to develop novel targeted therapeutics that are more effective than our current arsenal.
AVAILABILITY
The CCGD is accessible at http://ccgd-starrlab.oit.umn.edu/.
SUPPLEMENTARY DATA
Supplementary Data are available at NAR Online.
Acknowledgments
The authors would like to thank David Largaespada, Vincent Keng and Robert Cormier for their assistance in developing the CCGD. The authors would also like to thank the Minnesota Supercomputing Institute for use of their supercomputers.
FUNDING
National Cancer Institute of the National Institutes of Health [5R00CA151672-03 to T.S., P30-CA77598 to D.Y., Y.-Y.H., P50CA101955 to D.Y, Y.-Y.H., UL1TR000114 to R.I.V., Y.-Y.H., 1U19CA157345-01A1, U54-MD008620 to Y.-Y.H.]; Masonic Cancer Center, University of Minnesota SP3 grant and startup funds [to T.S., J.A.]; Office of Information Technology, University of Minnesota. Funding for open access charge: Office of Information Technology, University of Minnesota.
Conflict of interest statement. None declared.
REFERENCES
- 1.Chin L., Hahn W.C., Getz G., Meyerson M. Making sense of cancer genomic data. Genes Dev. 2011;25:534–555. doi: 10.1101/gad.2017311. [DOI] [PMC free article] [PubMed] [Google Scholar]
- 2.Starr T.K., Largaespada D.A. Cancer Gene Discovery using the Sleeping Beauty transposon. Cell Cycle. 2005;4:1744–1748. doi: 10.4161/cc.4.12.2223. [DOI] [PubMed] [Google Scholar]
- 3.Copeland N.G., Jenkins N.A. Harnessing transposons for cancer gene discovery. Nat. Rev. Cancer. 2010;10:696–706. doi: 10.1038/nrc2916. [DOI] [PubMed] [Google Scholar]
- 4.Starr T.K., Allaei R., Silverstein K.A., Staggs R.A., Sarver A.L., Bergemann T.L., Gupta M., O'Sullivan M.G., Matise I., Dupuy A.J., et al. A transposon-based genetic screen in mice identifies genes altered in colorectal cancer. Science. 2009;323:1747–1750. doi: 10.1126/science.1163040. [DOI] [PMC free article] [PubMed] [Google Scholar]
- 5.Seshagiri S., Stawiski E.W., Durinck S., Modrusan Z., Storm E.E., Conboy C.B., Chaudhuri S., Guan Y., Janakiraman V., Jaiswal B.S., et al. Recurrent R-spondin fusions in colon cancer. Nature. 2012;488:660–664. doi: 10.1038/nature11282. [DOI] [PMC free article] [PubMed] [Google Scholar]
- 6.Wu C., Qiu S., Lu L., Zou J., Li W.F., Wang O., Zhao H., Wang H., Tang J., Chen L., et al. RSPO2-LGR5 signaling has tumour-suppressive activity in colorectal cancer. Nat. Commun. 2014;5:1–13. doi: 10.1038/ncomms4149. [DOI] [PubMed] [Google Scholar]
- 7.Firestein R., Bass A.J., Kim S.Y., Dunn I.F., Silver S.J., Guney I., Freed E., Ligon A.H., Vena N., Ogino S., et al. CDK8 is a colorectal cancer oncogene that regulates beta-catenin activity. Nature. 2008;455:547–551. doi: 10.1038/nature07179. [DOI] [PMC free article] [PubMed] [Google Scholar]
- 8.Boca S.M., Kinzler K.W., Velculescu V.E., Vogelstein B., Parmigiani G. Patient-oriented gene set analysis for cancer mutation data. Genome Biol. 2010;11:1–10. doi: 10.1186/gb-2010-11-11-r112. [DOI] [PMC free article] [PubMed] [Google Scholar]
- 9.Kanehisa M., Goto S. KEGG: Kyoto encyclopedia of genes and genomes. Nucleic Acids Res. 2000;28:27–30. doi: 10.1093/nar/28.1.27. [DOI] [PMC free article] [PubMed] [Google Scholar]
- 10.Kanehisa M., Goto S., Sato Y., Kawashima M., Furumichi M., Tanabe M. Data, information, knowledge and principle: back to metabolism in KEGG. Nucleic Acids Res. 2014;42:D199–D205. doi: 10.1093/nar/gkt1076. [DOI] [PMC free article] [PubMed] [Google Scholar]
- 11.Akagi K., Suzuki T., Stephens R.M., Jenkins N.A., Copeland N.G. RTCGD: retroviral tagged cancer gene database. Nucleic Acids Res. 2004;32:D523–D527. doi: 10.1093/nar/gkh013. [DOI] [PMC free article] [PubMed] [Google Scholar]