

Abstract
Ligand-receptor interactions represent essential biological triggers which regulate many diverse and important cellular processes. We have developed a discovery-based proteomic biochemical protocol which couples affinity purification with multidimensional liquid chromatographic tandem mass spectrometry (LCLC-MS/MS) and bioinformatic analysis. Compared to previous approaches, our analysis increases sensitivity, shortens analysis duration, and boosts comprehensiveness. In this protocol, receptor extracellular domains are fused with the Fc region of IgG to generate fusion proteins that are purified from transfected HEK293T cells. These “ecto-Fcs” are coupled to protein A beads and serve as baits for binding assays with prey proteins extracted from rodent brain. After capture, the affinity purified proteins are digested into peptides and comprehensively analyzed by LCLC-MS/MS with ion trap mass spectrometers. In four working days, this protocol can generate shortlists of candidate ligand-receptor protein-protein interactions. Our “Ecto-Fc MS” approach outperforms antibody-based approaches and provides a reproducible and robust framework to identify extracellular ligand – receptor interactions.
Keywords: Ligand-receptor interaction, ligand identification, extracellular domain, IgG Fc region, ecto-Fcs, liquid chromatography, mass spectrometry, multidimensional liquid chromatography, protein expression in mammalian cells
INTRODUCTION
Ligand – receptor interactions play essential roles in a plethora of biological processes and are active targets of drug development. Ligand binding on the surface of the cell transduces pro-survival, death-inducing, and many other signals across the cell membrane into cells. The most successful approaches to identify ligand – receptor interactions have been affinity chromatography and, for weak interactions, ecto-domain alkaline phosphatase fusion protein binding and labeling in combination with expression cloning1-4. However, the many technical difficulties associated with producing and analyzing transmembrane protein receptors have limited the rate of the identification of their binding partners 5. Further, antibody-based purification of intact ligand – receptor pairs from tissue extracts is challenging and can be problematic for many interactions. Even when antibody-based approaches work, there is often massive background, which makes data analysis challenging.
There have been many recent technological developments towards the efficient identification of intracellular protein – protein interactions such as recombinant epitope tags and yeast two-hybrid assays. However, little progress has been made in the development of well-accepted procedures for the identification of extracellular protein – protein interactions. Protein identification by MS facilitates efficient analysis and identification of co-purifying interacting proteins6,7. MS based approaches also show further progress as highlighted by a recent chemoproteomic approach which successfully identified several diverse classes of cell surface protein – protein interactions8. However, nearly all previous attempts to identify ligand-receptor interactions have been limited by their abundance and interaction affinities since the eluted material is inspected by SDS-PAGE followed by gel slicing and MS analysis9. For these reasons the identification of ligand – receptors has been biased towards abundant proteins with high binding affinities.
We developed a straightforward discovery-based MS workflow to circumvent the previous challenges associated with the identification of ligand – receptor interactions. We have successfully used our ecto-Fc MS approach to identify multiple synaptic ligand – receptor interactions, which have proven to be excellent starting points for the discovery of new and unexpected biology10–12.
Overview of the protocol
Our approach starts with the generation of recombinant protein baits, which contain receptor extracellular domains fused to the Fc region of human IgG. These recombinant proteins or “ecto-Fcs” are produced by transient or stable transfection of HEK293T cells and purified from the culture medium by gravity flow chromatography with protein A resin. Subsequently, the ecto-Fcs are eluted, concentrated, and characterized by standard SDS-PAGE and MS analyses.
The ecto-Fcs proteins then serve as baits for batch binding assays with prey proteins extracted from rodent tissues. The bait proteins bound to interaction partners are re-captured with protein A resin, washed extensively and eluted. Because Ecto-Fc MS requires artificially large quantities of the bait Fc protein in the binding reaction there are potential concerns regarding the effect on binding competition. Thus a high affinity interaction maybe out competed by one with a lower affinity due to the high concentration of the bait protein available for binding. Purified proteins are precipitated and processed into peptides in solution, and peptide mixtures are then pressure-loaded directly onto multidimensional LC columns and analyzed by LCLC-MS/MS with ion or orbi trap mass spectrometers. Since these samples have relatively low complexity they can be deeply analyzed to generate confident semi-quantitative measures of abundance based on normalized spectral counts for nearly all the proteins present.
Once a candidate receptor is identified we generate the corresponding “ecto-Fc” and perform reciprocal Ecto-Fc MS. Further, we confirm direct protein-protein interactions with the same purified proteins with in vitro binding experiments. We have also shown that we can identify multimeric ligand-receptor networks containing more than 2 proteins. We use bioinformatics to probe the protein lists by examining the abundance of potential interacting proteins relative to the amount of bait and negative control Fc alone purifications. Through these efforts we have found that this protocol provides a robust, straightforward method to identify ligand-receptor interactions (Fig. 1).
FIGURE 1.

Schematic representation of Ecto-Fc MS approach to identify ligand-receptor interactions. Ecto-Fc baits are produced in HEK293T cells and bound to rodent tissue extracts. The purified material is digested to peptides in solution and loaded onto LCLC columns and analyzed deeply by MS. By incorporating replicate purifications and dataset comparison to negative control Fc purifications ligand – receptors interactions can be revealed. Blue arrow heads indicate bait proteins, red circles represent potential prey, and asterisks indicate non-specific background proteins.
Advantages of the method
The major advantages of the Ecto-Fc MS protocol to those previously published is speed, sensitivity, and comprehensiveness of the analysis:
Production of ecto-Fc proteins by DNA transfection of HEK293T cells is an accessible approach to generate ample recombinant extracellular domain protein baits which are properly folded, and post-translationally modified by Cys bonding and glycosylation13. Purification of ecto-Fcs by gravity flow chromatography is inexpensive, simple, and compatible with assessment by SDS-PAGE and MS.
Prey proteins are extracted from tissues that represent the most relevant biological source, including native post-translational modifications (PTMs).
Fc baits provide a key negative control to identify non-specific binding proteins.
Gel-free MS workflow aids comprehensive detection of low-abundance proteins, low-affinity interactions, plus surmounts the challenges associated when bait and prey proteins are of similar molecular weight.
Side-by-side comparison of replicate ecto-Fc analyses and Fc negative controls reveal potential endogenous ligands. Reciprocal experiments with “bait” / “prey” swapping validates interactions.
Ecto-Fc MS is compatible with quantitative proteomic work-flows (such as tandem mass tags or TMT) and custom protein databases.
Limitations of the approach
Ecto-Fc MS will fail to identify interactions for transmembrane ligands (i) if they cannot be recombinantly expressed, or if the binding site is spread across multiple loops of a multi-pass membrane protein, (iii) if their receptor is not expressed in the tissue context under investigation, (iv) if binding does not occur under the experimental conditions, affinity is too low, or stringency of the washes is too high, (v) if the receptor does not yield any peptides in the accessible m/z range (after proteases digestion), (vi) if the receptor protein’s amino acid sequence is not present in the protein database, (vii) if over expression of the fusion protein alters the surface exposed amino acids such that false positive interactions dominate the binding activity, (viii) if the PTMs required for interaction are not recapitulated in HEK293T cells, or lastly (ix) if the ecto-Fc is not properly folded after the low pH elution and renaturation used in the preparation of the pure bait protein.
Application and future use of the method
Ecto-FC MS can be applied to explore the binding repertoire of nearly any single pass membrane-associated ligand in discovery mode. Ecto-FC MS was initially applied to the investigation of trans-synaptic ligand - receptor interactions in rodent brain10-12. Now it can be applied to ligand – receptor systems at work in other tissue types beyond the brain. The only requirement is an efficient extraction protocol for the prey proteins from the tissue of interest. Specialized conditions may include the use of specific detergents, extended extraction durations, or the use of heat. By further refining the source of the prey proteins through dissection (such as brain regions), proteins with restricted expression could be explored. If the experimental scope is developmental, then rodent tissues could be harvested from the appropriate prenatal or postnatal age. To explore human ligand – receptor interactions, human tissue can be used as a valuable source of prey proteins. The use of post mortem human tissues from disease patients could be a promising potential source of prey proteins for disease relevant interactions.
We have successfully scaled down Ecto-Fc MS to require only a single rat brain. An extended goal is to use small brain regions easily identified by known morphological structural landmarks or complete voxelation of the brain based on uniform x, y, and z, coordinates (3-D grid) as the tissue source for the prey proteins. The MS analysis suggested here provides semi-quantitative measures of protein abundance within single purification. One way to increase the throughput of our system could be to multiplex the MS analysis with isotopic peptide tags which would allow affinity purifications to be analyzed simultaneously 14.
Experimental design
Ecto-Fc DNA cloning
For those investigators who are interested in specific membrane associated proteins it is potentially very insightful to know their protein binding partners. The candidate receptor should contain a transmembrane domain, be membrane anchored, or could be a secreted protein. A second criterion that will aid in the prioritization of the candidate binding proteins is that the receptor-ligand pair should be expressed at the appropriate time and brain region. The Allen Brain atlas is a good resource for this type of information.
Extracellular domains of candidate ligands are defined with standard protein sequence analysis tools. We have focused mostly on single pass transmembrane proteins and glycosylphosphatidylinisotol (GPI) anchored proteins. We have modified the original vector to contain the following features: 3C protease cleavage site (LEVLFQ/GP) between the last residue of the protein of interest and beginning of the hIgG sequence, bovine Prolactin signal peptide (MDSKGSSQKGSRLLLLLVVSNLLLCQGVVS), Kozac sequence around Met1, FLAG sequence (DYKDDDDK) between the signal sequence and beginning of the mature protein of interest 15,16. Note that the FLAG sequence is also cleavable as DDDDK is the enterokinase recognition sequence. A variety of Fc vectors such as the pFUSE-Fc family, pCMV6-AN-FC, or Ig/pEG-BOS are available commercially or through Addgene.
Ecto-Fc bait protein production
The efficiency and yield of Fc protein production varies depending on the sequence and protein of interest. We tend to scale up the number of HEK293T dishes transfected to surmount this hurdle. We have found that for most ecto-Fcs, transient transfection of HEK293T cells with cationic polymer polyethylenimine (PEI) is a productive approach. Typically, 20–50 15cm plates will yield protein in a range from 100ug to several mgs (volumetrically 0.1 to 5 mg/L of media). The amount of bait protein produced may be limited due to the steric hindrance from the dimeric nature of the Fc fragment. We have also found that generating stable cell lines or using suspension-adapted cells can significantly improve yield but in general are not necessary 17.
Ecto-Fc protein assessment
The final ecto-Fc yield is determined by standard Bradford assay. The integrity of the recombinant proteins is assessed by SDS-PAGE with Coomassie blue staining (Fig. 2a and b). If further characterization of the ecto-Fc is needed, we directly analyzed the purified baits by LCLC-MS/MS. MS analysis of the purified ecto-Fc bait alone aids in the determination of the exact amino terminus (Fig. 2c).
FIGURE 2.

Purification and assessment of ecto-Fc bait proteins. (a) Ecto-Fc gravity flow purification set up from conditioned media. White arrowhead is reservoir where media is loaded, blue arrowhead indicates protein A beads, black arrowhead is flow through. (b) Example SDS-PAGE coomassie stained gel of 4 purified ecto-Fcs. (c) Representative Nrxn1 ecto domain sequence from MS characterization of a bait protein. Note: Red box is endogenous signal peptide sequence, which has been replaced (See Experimental design - Ecto-Fc DNA cloning section for details). Yellow highlight indicates sequences identified and black arrowhead shows potential Fc fusion location, typically near the TM region.
It may be helpful to qualitatively examine the binding activities of the ecto-Fc on the surface of cultured cells from the tissue of interests. Strong binding suggests the existence of a high affinity interaction and the identity of this receptor(s) may be revealed by ecto-Fc MS.
Prey protein preparation
Biochemical preparation of the “prey” extract is one of the most critical steps in this protocol. If the receptor protein of interest is not sufficiently extracted and solubilized from the tissue, it will not be available for binding or identification by MS. We suggest several different approaches to surmounting this potential issue (Step 26 PROCEDURE).
Binding reaction
50 -100ug of ecto-Fc bait protein was found to be the optimal starting point. It is not necessary to determine the precise prey protein concentration. Proper binding conditions (buffer components etc.) should be worked out empirically since protein binding activity from tissue extracts will vary. For many candidate ligands it will be necessary to perform replicate analysis to reveal confident candidate receptors (Fig. 1).
Sample preparation for MS
The purified proteins can be precipitated with 2,2,2-trichloroacetic acid (TCA) / acetone or methanol / chloroform with standard protocols. The precipitated proteins are solubilized, denatured, reduced, and alkylated in solution12. We have found over-night digestion with 2ug of sequence grade trypsin at 37°C with shaking to be the most reliable option to ensure complete digestion. It is critical that the samples are acidified to a final concentration of 5% formic acid prior to centrifugation and loading onto the LCLC column.
Multidimensional LCLC chromatography with online tandem MS analysis
Multidimensional protein identification technology is a straightforward method to deeply analyze complex protein mixtures and has been previously described in detail 18,19,20,21,22. The necessary equipment includes an ion trap mass spectrometer and a quaternary HPLC pump.
We show that multidimensional LC separation is a powerful approach for the comprehensive analysis of the affinity-purified material. We also acknowledge that single phase LC separations with fast scanning MSs should also be comparable in regards to the number of protein identifications. To effectively identify low abundance or low affinity interactions it is critical that the MS analysis be near comprehensive. Deep analytical sampling of the purified material by MS/MS will significantly boost the confidence of the semi-quantitative measures of the affinity-purified material.
Controls
The suggested negative control for ecto-Fc MS is simply an IgG Fc protein without any ecto domain fused. This is a straightforward and inexpensive control, which should be performed in parallel for every ecto-Fc purification. We have found that dissimilar ecto-Fcs, especially if their domains belong to the same fold family, can also serve as excellent negative controls for one another. For example, prey proteins abundantly identified in all or nearly all ecto-Fc experiments are not likely to be true ligands and should be ignored or manually validated in other experiments (Fig.1).
Protein database search, data filtering, and dataset comparisons
Bioinformatics plays an essential role in the analysis and interpretation of MS data. There are multiple software packages which bundle protein database search, filtering, and dataset comparisons, however we are most familiar with those described here. Many informatics tools can lead users to the correct answers, however the most important consideration is that the users understand how the tools are working and how to interpret the datasets 23. The protein database used for the database search is absolutely critical for the success of Ecto-Fc MS; if the amino acid sequence corresponding to the receptor of interest is not present in the database, it cannot be identified.For the most comprehensive MS analysis of ecto-Fc bait proteins a custom protein database entry should be added to the protein database. The entry should contain the exact amino acid sequence of the cloned bait with the suggested flag / Prolactin signal peptide, and Fc sequence concatenated. Filtering each dataset by target-decoy with reversed protein sequences is also very important since the inclusion of many weak or suspect protein identifications may lead to misinterpretation of the data.
There are many options when it comes to bioinformatic analysis of proteomic data sets, each with their own unique strengths and weaknesses. The first software decision is the search engine. We are most familiar with Sequest / Prolucid, but also recognize that Mascott, X! Tandem, and OMSSA all can achieve confident protein identifications sufficient for a successful Ecto-Fc MS experiment 24,25,26. This protocol requires some label-free semi-quantitative measure of abundance to be provided from the analysis software, which could be in the form of spectral counts, ion intensities, or other measures. Further, it is also required that multiple sample analyses (datasets) can be directly compared, for example against the Fc alone for a negative control. There are many software packages which provide direct comparisons between datasets and include Scaffold (Proteome Software, Inc), Proteome Discover (Thermo Scientific), Maxquant, PatternLab, MStats, and Peaks Q (Bioinformatics Solutions, Inc) 27,28,29.
Dataset interpretation
The first step is to sort the identified proteins in each ecto-Fc MS dataset in descending order based on the number of spectral counts 30, or similarly normalized spectral counts 31. The bait protein should be the most abundant protein present, and is typically identified by hundreds to a few thousand spectral counts. By comparing the abundance of each protein relative to the ecto-Fc bait, an enrichment factor is calculated.
Manually interrogate the list by considering each protein carefully, using abundance to guide the interpretation. True hits should have transmembrane domains or be secreted. We have found some receptors to be the second most abundant proteins in the unfiltered datasets, while others require background subtraction and careful assessment 10,11. Unfortunately, not every ligand – receptor pair can be easily identified by reciprocal Ecto-FC MS. This is often because one ligand is of very low abundance (such as Lrrtm2) and is challenging to effectively isolate from the complex tissue extract.A typical ecto-Fc MS experiment will reveal 100’s of protein identifications from a single affinity purification experiment owing to the high sensitivity of current MSs. Nearly all these proteins are not true receptors. Rather, they constitute non-specific background proteins or indirectly interacting proteins, which are challenging to interpret and should be ignored. For some ligands, Ecto-Fc MS may fail to show any candidate receptors or only false interaction artefacts, which have arisen as a consequence of the highly abundant bait protein. One option is to try a His tagged recombinant protein (His is much smaller than Fc) in a similar way but with Ni or anti-His antibodies to couple the bait protein to the beads.
Validation of new ligand – receptor interactions
Additional independent binding experiments aimed to validate the interaction are needed for the accurate description of a new ligand / receptor interaction. The first experiment we suggest to validate a new interaction is to test if the ecto-Fc bait protein will bind to the cell surface after transfection of the new protein of interest. Binding levels can be easily visualized by traditional cell surface immuonofluorescence with anti-Fc antibodies. Additional binding experiments (such as co-IP after transient transfection or direct binding experiments with purified proteins) will indicate whether these interactions are direct or indirect. When describing a new interaction it is also valuable to determine which domains are required for the interaction and binding assays with deletion mutants or titration of competitive peptides could prove revealing. An important benchmark for the proper description and characterization of a new ligand / receptor interaction is the measurement of the binding affinity. While technical limitations may hinder the accurate affinity measurement of some ligand / receptor interactions, it is an essential follow-up experiment necessary to characterize new protein – protein interactions. There are many potential approaches that can yield an estimate of the binding affinity (more precisely accurate association and dissociation binding constants) between a ligand and receptor; these include surface plasmon resonance, biolayer interferometry, or isothermal titration calorimetry.Human tissue has also been found to be compatible with Ecto-Fc MS and represents a key extension of the assay with rodent tissue extracts.
MATERIALS
Reagents
Adherent HEK293T cells (American type culture collection (ATCC), cat. no. CRL-11268)
Rodent tissues (Brain)
DMEM, high glucose (Gibco, cat. no. 11965-092)
FBS (Gibco, cat. no. 10437-028)
PBS pH 7.4 (Gibco, cat. no. 10010-023)
100X Penicillin-Streptomycin-Glutamine (PSQ; Gibco, cat. no. 10378-016)
GlutaMAX (Gibco, cat. no. 35050-061)
Poly-D-Lysine (PDL; Sigma, cat. no. P7886
Ecto-Fc DNA plasmid (pFUSE-Fc or similar; Invitrogen)
PEI (Polysciences, cat. no. 23966-2)
Opti-MEM (Gibco, cat. no. 11058-021)
Filter flasks (0.22um; Corning, cat. no. 4300521)
Complete EDTA-free proteinase inhibitor cocktail (Roche, cat. no. 11873580001)
Protein A Sepharose Fast Flow (GE Healthcare Life Sciences, cat. no. 17-5138-01)
IgG Elution Buffer (Pierce, cat. no. 21009)
Slide-A-Lyzer Dialysis Cassettes (10K MWCO; Thermo, cat. no. 66383)
Amicon Ultra-15 Centrifugal Filter Units 10,000 NMWL (EMD Millipore, UFC901024)
Poly-Prep Chromatography Columns (Biorad, cat. no. 731-1550)
Pasteur glass transfer pipets (Kimble-Chase, cat. no. 63B92)
IgG, Fc fragment (Jackson ImmunoResearch, cat. no. 009-000-008)
Sequence grade modified trypsin (Promega, cat. no. V5117)
Strong cation exchange HPLC resin (Mac Mod analytical Inc, PartiSphere)
Reverse phase HPLC resin (Luna C18 5um; Phenomenex)
HEPES (1M in water pH 7.4; Sigma, cat. no. H3375)
Glycerol (Sigma, cat. no. G5516)
TX-100 (Sigma, cat. no. X100)
NaCl (Sigma, cat. no. S3014)
CaCl2 (Sigma, cat. no. C1016)
EDTA (Sigma, cat. no. ED-100G)
TCA (Sigma, cat. no. T6399) CAUTION TCA is a strong acid and can easily burn the skin, be extra careful to avoid direct personal contact when working with TCA.
Acetone (Fluka, cat. no. 414689)
Tris (2-carboxyethyl) phosphine hydrochloride (TCEP; Sigma, cat. no. C4706)
Iodoacetamide (IAA; Sigma, cat. no. I1149)
Ammonium bicarbonate (AMBC; Sigma-Aldrich, cat. no. A6141)
ProteaseMAX surfactant (Promega, cat. no. V2072)
Urea (Sigma, cat. no. U4883)
Acetonitrile (Sigma, cat. no. 34998)
Glass capillary (50, 100, 250 μm; Agilent) CAUTION Glass capillary can pierce gloves and skin, it should be handled as a sharp and disposed as broken glass.
Ceramic Capillary Cutter (Waters, cat. no. 6028630)
Kasil Formamide Frit Kit (Fisher, cat. no. NC0263146)
HPLC unions (Upchurch) - Flacon tubes
Equipment
Humidified, 37°C, 5% CO2 incubator
Sterile laminar flow hood
4°C cold room
Ultracentrifuge Floor Preparative (Beckman Optima XPN or similar)
Ultracentrifuge rotor (Beckman 42.1 fixed angle, or similar)
Ultracentrifuge tubes (Polycarbonate Bottle Ass. W/ Aluminum Caps; Beckman, cat. no. 355622)
Refrigerated preparatory centrifuge (such as Beckman Coulter Avanti J-series)
Centrifuge rotor – fixed angle (Beckman Coulter JA-20; cat. no. 334831)
Econo-Column Chromatography (0.7 x 10 cm; Biorad cat. no. 7370712)
Econo-Column Funnels. (Biorad, cat. no. 7310003)
Glass 15mL dounce homogenizers (Wheaton, cat. no. 357544)
Visible Spectrophotometer (Thermo, cat. no. UX-02652-50)
One way stopcock (PE Nylon; Kimble Chase, cat. no. 420163-1500)
Refrigerated benchtop centrifuge (Eppendorf 5415R)
Electrospray ion / orbi trap Mass spectrometer (Thermo Fischer Scientific)
Nano-HPLC system (Agilent 1200)
Pressure injection cell “gas bomb” (Next Advance, cat. no. PC77) CAUTION Exercise care when using high pressure gas.
Compressed gas (Helium for bomb) CAUTION Make sure proper training has been provided for all those using high pressure gas as potentially serious physical injures can occur from misuse and safety glasses are a must.
Pipette bulb (Sigma, cat. no. Z136050)
Laboratory oven (Sheldon, cat. no. SMO1E)
RawExtractor (Spectra extraction tool; http://fields.scripps.edu/researchtools.php)
Sequest / Prolucid (Protein database search algorithm; http://fields.scripps.edu/researchtools.php)
DTASelect (Protein dataset filtering tool; http://fields.scripps.edu/researchtools.php)
IP2 (Proteomic analysis environment; http://integratedproteomics.com/)
Reagent setup
Polyethylenimin (PEI) solution
To prepare PEI solution, pH 50mL 1xPBS to 4.5 using HCl, add 50 mg linear PEI incubate in 75°C water bath and vortex every 10 min until completely dissolved. Cool to room temp and filter sterilize through a 0.22um syringe filter, aliquot and freeze at −20°C. This reagent can be stored for 1 year at −20°C.
Rodent tissue and protein solublization
We have focused our efforts on rodent brain tissue, and have had the most success with using 5-10 P21 rat brains (P21 rat brain weighs ~ 1.5g and adult 2.6g) per Fc. However we have also had success with ecto-Fc MS with only a single brain as input material. We suggest these values as a starting point for future experiments with other tissues. Adult brain tissue becomes increasingly myelinated and is a challenging tissue source to effectively extract prey proteins from. The amount of tissue required for a successful purification is also dependent on how well it is solubilized and the absolute abundance of the receptor. To increase protein extraction efficiency we have had success increasing the TX-100 concentration (up to 5%) and increasing extraction incubation periods to overnight. The use of more aggressive detergents and higher temperatures during the extraction step should solubilize more protein, however the proteins may become denatured and unable to efficiently bind the bait.
<CAUTION> Research involving the use of vertebrate animals must be reviewed by the investigator's institutional ethical review board to avoid all unnecessary discomfort or pain to the animals plus to determine whether alternatives exist to animal research. All animal experiments should be performed in accordance with relevant institutional, local, state, and federal guidelines. The regulations of protocols approved by the investigator's institutional animal research review committee and all personnel involved should be fully trained in proper animal handling.
Triton X-100
Dilute Triton X-100 to 10% (10X) in buffer matched to extract. . CRITICAL This buffer should be made fresh for each purification. Chill buffer to 4°C before use.
Buffer 1 (ecto-Fc production column wash)
Mix 50 mM HEPES pH 7.4, 300 mM NaCl, and 0.5X (1 pellet for twice the buffer volume recommended by Sigma) protease inhibitors. CRITICAL This buffer should be made fresh for each purification, chilled to 4°C prior to use and kept in use for 1 week.
Buffer 2 (Tissue homogenization buffer)
Mix 50mM HEPES pH 7.4, 100 mM NaCl, 0.32M sucrose, 2 mM CaCl2, 2.5 mM MgCl2, and 1X protease inhibitors (1 pellet for the buffer volume indicated by Sigma in reagent specifications). CRITICAL This buffer should be made fresh for each purification. Chill buffer to 4°C before use.
Buffer 3 (Affinity capture high salt wash buffer)
Mix 50 mM HEPES pH 7.4, 300 mM NaCl, 0.1 mM CaCl2, 5% (vol/vol) glycerol and 0.5X protease inhibitors. CRITICAL This buffer should be made fresh for each purification. Chill buffer to 4°C before use.
Buffer 4 (Affinity capture low salt wash buffer)
Mix 50 mM HEPES pH 7.4, 150 mM NaCl, 0.1 mM CaCl2, 5% (vol/vol) glycerol and 0.5X protease inhibitors. CRITICAL This buffer should be made fresh for each purification. Chill buffer to 4°C before use.
Ammonium bicarbonate (AMBC)
Dissolve solid ammonium bicarbonate in water to 50mM at pH 7.5, aliquot and store at -20°C. This buffer can be stored for 1 year. CRITICAL This buffer should be prepared with high purity water.
Urea buffer
Dissolve solid urea in freshly thawed AMBC to a final concentration of 8M. CRITICAL This buffer should be made fresh at room temperature for each digestion and used within 1 day.
IAA buffer
Dissolve solid IAA in AMBC to 1M. This buffer can be aliquoted and stored at −20°C for 1 year.
TCEP buffer
Dissolve solid TCEP in AMBC to 0.5M. This buffer can be aliquoted and stored at −20°C for 1 year.
HPLC buffer A
95% water, 5% acetonitrile, and 0.1% formic acid. CRITICAL This buffer should be prepared with high purity water.
HPLC buffer B
20% water, 80% acetonitrile and 0.1% formic acid. CRITICAL This buffer should be prepared with high purity water.
HPLC buffer C
500 mM ammonium acetate, 5% acetonitrile, 0.1% formic acid. CRITICAL This buffer should be prepared with high purity water. CRITICAL Ammonium acetate is hygroscopic and should be stored at room temperature in a desiccator.
Equipment setup
Protein A columns
All affinity purification equipment should be chilled to 4°C prior to use.
Centrifuges
All affinity centrifuges and tubes should be chilled 4°C prior to use. CRITICAL Time required to chill centrifuges, tubes, and rotors can vary and should be closely monitored.
Kasil frits
Cut 250um glass capillary into 15cm long sections by perpendicular etching with ceramic capillary cutter then gently snap the capillary to get a clean cut. Combine 300ul Kasil 1624 and 100ul Formamide in a small glass vial and vortex till the solution is clear. Quickly dip cut capillary into the Kasil / formamide and place into a glass beaker (dipped tip down). Bake the capillary at 100°C for at least 4 hours (Fig. 3).
FIGURE 3.

Preparation of Kasil frit and LCLC column. 250um capillary should be cut into 15cM segments (yellow arrow head) with a ceramic cutter. Prepare Kasil and formamide solution in small glass vial and quickly dip frit. Place frit (red arrow head) into glass beaker with the dipped end down and bake for at least 4 hours at 100°C. Place remaining solution in the glass vial into the oven to ensure polymerization is complete (orange arrow head). Load column on gas bomb with HPLC resin slurry in methanol. Load 2–3cm SCX (magenta box) first then 2–3cm RP (cyan box). Green arrow head is the 1-2mM Kasil cap.
MudPIT LCLC columns
Cut Kasil frit such that 1-2mM remains. Pack Kasil frit with 2.5cM of SCX resin in methanol on bomb. Pack frit with 2.5cM of RP resin in methanol on bomb. CAUTION Use caution when working with high pressure gas, do not exceed 1000 pounds per square inch 32. Check all connections prior to turning on the gas since serious injury is possible, always wear safety glasses (Fig. 3).
Washing LC columns. All
HPLC columns should be washed 15 minutes with HPLC buffer B and then 15 minutes with HPLC buffer A prior to sample loading. After loading LCLC columns with sample, wash ≥30 minutes with HPLC buffer A.
HPLC and mass spectrometer operation
Generate LCLC-MS methods and assemble the analysis run sequence. The first step (individual method file) is a linear gradient of increasing % HPLC buffer B (from 0 to 100%) over 90 minutes. All subsequent steps are 120 minutes and start with a 3–5 minute “salt bump” of HPLC buffer C then proceed with a shallow gradient up to 60 or 100% B. For this protocol we recommend a 5 step analysis (% buffer C = 20%, 40%, 60%, 100%). Steps 2–5 provide multidimensional chromatographic separation which facilitate in depth sample analysis. For additional details on the MudPIT approach please see previously published descriptions 33,18,19. Electrospray ion trap mass spectrometer should be tuned and calibrated per manufacturer’s specifications ~ once per month and cleaned several times per year. It is our experience that LTQ MSs are very well suited for this protocol. Faster scanning high resolution instruments, operated in such as Velos Orbitrap or Tribrid Fusion MSs may improve results but are not required. The detailed settings for each of these instruments will vary but in general we recommend a distal 2.4-kV spray voltage, a full scan MS from 400–1800m/z, and an intensity threshold of 1000 for MS/MS. When possible we reject those ions for MS/MS which are singly charged, those for which the charge state cannot be assigned, and recommend using dynamic exclusion when possible20. For LTQ we recommend 5 – 10 MS/MS per MS and for Velos we recommend 20.
PROCEDURE
Production of ecto-Fc bait proteins Timing ~7 d
-
1 |
Culture HEK293T cells to 95% confluency on 5 X 15cm dishes in DMEM with 10% FCS, 1X glutaMAX and 1X P/S/Q.
-
2 |
Split cells 1:2 and plate on 10 X 15cm dishes 24 hours prior to transfection.
-
3 |
Transfect cells with PEI. First pre-warm OptiMeM and PEI in 37°C water bath.
-
4 |
In 15mL falcon tube, add the following solutions in this order: 6mL OptiMem, 100ug of the DNA for transfection dissolved in water, and 600ul PEI. Vortex and let stand in hood for 10 minutes.
-
5 |
Add 580ul of the solution prepared in step 4 dropwise to each dish prepared in step 2.
-
6 |
Replace media after 6 hours with 25mL of serum free pre-warmed OptiMeM per 15cM plate. CRITICAL STEP Changing the media to OptiMeM is critical to prevent IgG contamination from FCS.
-
7 |
Incubate cells at 37° > 5 days. CRITICAL STEP HEK293T cells should be inspected by light microscopy to monitor viability and attachment starting at day 3. If cells are healthy and remain attached, additional culturing may increase Fc yield.
-
8 |
Collect media in multiple 50mL falcon tubes; it is likely that 20–22mL of media will be recovered per plate. Distribute the total volume equally across multiple tubes as needed. Clarify cellular debris by centrifugation at 1500 g for 10 minutes. It is not uncommon to observe a small debris pellet after the spin. Filter the supernatant using a 250mL filter flask and add 0.5X protease inhibitors (1 pellet for twice the buffer volume recommended by Sigma). PAUSE POINT For most proteins (without aggregation), the conditioned TC media can be stored at 4°C for up to 2 weeks.
Purification of the ecto-Fc proteins Timing 2–3 d
-
9|
For each Fc protein preparation (100ug of transfected DNA plasmid) wash 1mL protein A resinin cold PBS 3 times with low speed spins. Transfer washed beads to an Econo-Column and use gravity flow to further wash and pack resin bed with cold PBS (Fig 2a).
-
10|
Add serum free conditioned media to the column by gravity flow chromatography, making sure to capture the flow-through. Once the media has completely passed through the column, immediately reapply the flow-through to the column for a total of 2 purification rounds.
-
11
| Wash the column with 500mL of cold Buffer 1.
-
12|
Elute ecto-Fc proteins twice with 10 X 1mL Pierce elution buffer. Capture the eluted material and immediately neutralize with 100ul of 1M HEPES pH 7.5. Wait until the wash buffer has near completely drained from the column prior to adding elution buffer.
-
13|
Pool elutions and transfer to slide-a-lyzer using a needle-syringe. Dialyze at 4°C over-night with 2 buffer changes per the manufacturer’s instructions. CRITICAL STEP Make sure to remove all excess air in cassette to ensure maximal membrane surface area for buffer exchange.
-
14|
Concentrate ecto-Fc proteins with the appropriate MW cutoff Ultra centrifuge units at 4°C. As per manufacturer instructions, efficient recovery is obtained with a MW cut-off ~3X smaller than the protein of interest. 100KDa need ~30KDa cut off (see manufacturer instructions for more details). Add glycerol to 10% final concentration for cryoprotection if storing at −80°C. PAUSE POINT The purified proteins can be aliquoted and stored at -80°C for one year, for short term storage ≤3 months use 4°C .
Assessment of ecto-Fc proteins Timing 1-3 d
-
15|
Measure protein concentration with Bradford reagent.
-
16|
Determine ecto-Fc integrity and purity by SDS-PAGE and Coomassie staining (Fig 2b).
-
17|
If detailed molecular characterization of ecto-FC is necessary, process and analyze 50ug of purified ecto-FC bait alone by LCLC-MS/MS (see step 42–69 ) (Fig 2b).
Preparation of bait ecto-Fc proteins Timing 1d
-
18|
Add 1mL (50% beads / 50% storage buffer) of Fast-flow Protein A sepharose beads to a 1.5mL Eppendorf tube.
-
19|
Pellet the beads by low speed centrifugation at 4°C and remove supernatant.
-
20|
Add 1mL of PBS, invert tube several times and then pellet beads by low speed centrifugation to wash. Remove PBS supernatant and repeat.
-
21|
For the third and final wash first remove the PBS then add 1mL of cold buffer 2 (with 0.5X protease inhibitors). Equilibrate the beads for 10 minutes on ice, then pellet beads by low speed centrifugation.
-
22|
Remove and replace with 500ul of buffer 2 (with 0.5X protease inhibitors), the bead slurry should now be ~ 1000ul (50% beads / 50% buffer).
-
23|
Transfer 500ul of the bead slurry into two 1.5mL Eppendorf tubes and add 100ug of purified ecto-Fc protein or control Fc to each aliquot of bead slurry.
-
24|
Incubate over night with end over end rotation at 4°C (assuming complete capture, the final concentration of the immobilize ecto-Fc protein to the beads is ~0.2mg/ml).
Preparation of prey proteins Timing 8 hours
CRITICAL Preparation of prey proteins and affinity purification of receptor must be completed on the same day. See timing section below for a detailed timeline.
-
25|
Homogenize the tissue of interest. In our work, ten P25 rat brains were homogenized on ice with buffer 2 plus 1X protease inhibitors with a Dounce homogenizer. We recommend using ~10mL of buffer 2 per brain. Transfer and pool each homogenate to a glass beaker pre-chilled on ice.
-
26|
Biochemical preparation of prey proteins. Choose appropriate fractionation method based on the specific protein’s fractionation pattern; option A for preparing whole tissue extracts, option B for preparing membrane extracts.
-
26A|
Whole tissue extract.
Add medium stir bar to tissue homogenate in beaker and set on stir plate at 4°C and stir on medium for 5 minutes.
Slowly add 1/10th volume of the extract of 10X Triton X-100 drop wise while stirring.
Extract at 4°C for ≥2 hours.
Distribute extract to ultra-centrifuge tubes and spin at 100,000 x g for 1 hr at 4°C to pellet insoluble material. CRITICAL STEP Weigh and balance ultra-centrifuge tubes to ensure a balanced rotor.
-
26B|
Membrane extract.
Distribute homogenate to 50mL tubes (round bottom are preferred but Falcon tubes can work for first clarification spin) and spin at 1500 g for 15 minutes at 4°C.
Transfer supernatant to high speed or ultra-centrifuge tubes and spin at 18000 g for 20 min 4°C.
Completely resuspend the membrane pellet in cold buffer 2.
Transfer extract to a beaker with a micro stir bar and place on a stir plate at 4°C for 5 minutes.
Slowly add 1/10th volume of the extract of 10X Triton X-100 drop wise while stirring.
Extract at 4°C for ≥2 hours. (vii) Distribute extract to ultra-centrifuge tubes and spin 100,000 x g for 1 hr at 4°C to pellet insoluble material. CRITICAL STEP Weigh and balance centrifuge tubes to ensure a balanced rotor.
-
26A|
Affinity purification of receptor. Timing 1 day
-
27|
For each ecto-Fc bait, distribute 12–13mL of clarified tissue extract to 15mL falcon tube. CRITICAL STEP It is very important that the binding reaction be performed with a nearly full tube, smaller volumes will likely result in foaming, which can cause protein denaturation and interfere with efficient affinity capture of prey proteins.
-
28|
Transfer an entire 100ug ecto-Fc bead slurry preparation (product of steps 18–24) to each falcon tube.
-
29|
Rinse each Fc tube with 500ul of buffer 2 to ensure recovery of residual beads and Fc protein. Transfer each rinse to the appropriate falcon tube.
-
30|
Incubate at 4°C over-night with end-over-end rotation.
-
31|
Recover tubes and spin at 500 x g for 5 minutes at 4°C. CRITICAL STEP Inspect the turbidity of the extract, it should be free of clumps and particulate matter. This is an indication of precipitation and may cause the affinity purification column to clog.
-
32|
Gently remove 10mL of unbound extract with a pipette, and discard without disturbing beads. CRITICAL STEP We have found that removing a large portion of the unbound material at this step is critically important to ensure the non-specific binding is kept to a minimal level.
-
33|
Gently resuspend the beads in the falcon tube using a glass transfer pipette and slowly transfer the entire volume to a capped poly prep column. Allow sufficient time such that the beads will accumulate in an even bed at the bottom of the column. This entire step should be performed at 4°C and with care to recover as much of the bead slurry as possible. CRITICAL STEP When transferring the beads to the column ensure the bead slurry is carefully ejected from the pipette while slowly circling the column top to ensure an even bead bed, which is well packed and uniform.
-
34|
Remove column plug while carefully monitoring the buffer front as the extract flows through the beads and out the column exit port. Allow the extract to flow until the extract front is just above the bead bed, at which time re-cap the column. CRITICAL STEP It is very important to allow as much of the extract to flow though the beads as possible. Residual extract can lead to higher levels of background binding.
-
35|
Wash column with adding 10mL of buffer 3 with 0.5X protease inhibitors to each column and remove cap to allow flow though the column, re-cap column when the buffer front is just above the bead bed.
-
36|
Repeat step 26 four for a total of five high salt washes, re-cap column with buffer front just above the bead bed when complete.
-
37|
Wash column once more by adding 10mL buffer 4 and allow to flow by removing cap. For this final wash, allow the buffer to flow out the column completely and then re-cap.
-
38|
Immediately add 250ul of room temperature elution buffer and transfer columns to room temperature and incubate for 10 minutes. CRITICAL STEP Ensure the column cap is well placed and there is no leaking, wrapping the junction with parafilm will ensure a tight seal.
-
39|
Remove cap, allow the entire volume to flow though the bead bed and capture the eluted material in a 1.5mL Eppendorf tube, place on ice.
-
40|
Recap column, add 250ul of room temperature elution buffer to column, and incubate at room temperature for 10 minutes. Remove cap and capture the eluted material in the same Eppendorf tube as the first elution and return tube to ice. Repeat elution with 250ul for a total of three elutions with a combined volume of 750ul total.
-
41|
Prepare 100% (wt/vol) TCA solution in water.
-
42|
Add TCA to a final concentration of 20% (vol/vol) , vortex well, and incubate tubes on ice at 4°C over-night.
-
37|
Centrifuge tubes at >14,000 x g for 30 minutes at 4°C in a micro-centrifuge.
-
38|
Remove the supernantant and wash the pellet with 500ul of ice cold Acetone.
-
39|
Centrifuge tube at >14,000 x g for 5 minutes at 4°C.
-
40|
Remove the acetone and repeat step 38.
-
41|
Carefully remove all residual Acetone and completely air dry pellet at room temperature. PAUSE POINT The dried pellets can be stored at −80°C for up to 1 month.
Sample preparation for MS analysis. Timing 6 hours
-
42|
Resuspend protein pellet in 50ul of Urea buffer and vortex for 1 hour.
-
43|
Add 50ul of 0.2% (wt/vol) ProteaseMAX in AMBC buffer and vortex for >2 hours.
-
44|
Add 1ul of TCEP buffer and vortex for > 30 minutes.
-
45|
Add 2 ul of IAA buffer and incubate in dark for 20 minutes.
-
46|
Add 5 ul of TCEP buffer.
-
47|
Add 150ul of AMBC. CRITICAL STEP Urea must be diluted to < 2M to ensure enzymatic activity.
-
48|
Add 2.5ul of 1% (wt/vol) proteaseMAX.
-
49|
Add 2ug of sequence grade trypsin and incubate at 37°C with shaking overnight.
-
50|
Recover tubes and store at −80°C. PAUSE POINT The dried pellets can be stored at -80°C for up to 1 month. CRITICAL STEP Do not acidify samples prior to freezing; doing so can result in near complete loss of peptides due to acid hydrolysis.
Preparation and loading of HPLC columns. Timing 3 hours
-
51|
Thaw protein digest and acidify to 5% (vol/vol) final with formic acid
-
52|
Centrifuge peptides for 15 minutes and transfer supernatant to new tube.
-
53|
Load sample onto column with bomb at a pressure of 500–1000 psi, this typically takes 45 minutes to 1 hour. PAUSE POINT Loaded column can be stored at 4°C for 1 week.
-
54|
Wash the loaded column for 30 minutes with buffer A. PAUSE POINT Washed column can be stored at 4°C for 1 week.
-
55|
Pack a pulled 15cm tip made from 100uM glass capillary with RP resin on bomb.
-
56|
Wash the analytical tip with buffer B for 15 minutes.
-
57|
Equilibrate the analytical tip with buffer A for 15 minutes.
Mass Spectrometry analysis. Timing 8-12 hours per Fc
-
63|
Assemble LCLC column (frit plus tip) with union and attach to HPLC pump in line with MS. Flow buffer A to ensure steady flow and no leaks.
-
64
Execute 5 step LC / MS method though Xcaliber software (See HPLC and mass spectrometer operation in the Equipment setup section). Step 1 consists of increasing % B which will move the peptides from RP trap to SCX and washes the column. Steps 2-5 provide orthogonal chromatographic separation which facilitate deep and near saturating protein identification.
Bioinformatic Analysis Timing 8-24 hours per Fc, samples can be analyzed in parallel
-
65|
Extract all RAW files to .MS2 format with RawExtractor software pre-installed on the MS PC 34.
-
66|
Upload .RAW and MS2 files into IP2 software. Similar software such as Scaffold will also work but may require a different extracted file format such as XML
-
67|
Perform Sequest database search with the appropriate protein database and parameters 6. We recommend using parameters which include a fixed modification of 57.02146 on cysteine residues. We suggest requiring peptides to be half or fully tryptic, with unlimited missed cleaves, and greater than 6 amino acid residues in length
-
68|
Filter each dataset with DTASelect based on target-decoy (forward-reverse amino acid sequence protein database) approach to ensure a 1–5% false discovery rate at the protein level 35.
-
69|
Generate multiple protein dataset comparison including Fc control with IDCompare (within IP2) or similar. The final result file should show the recovery of each protein side-by-side for all the experiments (Fig. 1).
TIMING
Step 1, cell culture: overnight
Steps 2-3, PEI transfection: ~5 d
Steps 4-7, ecto-Fc purification: ~2 d
Steps 7-9, ecto-Fc dialysis and concentration: ~2 d
Steps 10-12, ecto-Fc assessment: 1-2 d
Steps 13-15, ecto-Fc coupling to protein A beads: overnight
Steps 16-17, preparation of prey proteins from rodent tissue: 8 h
Steps 18-21, affinity purification of receptor: 1 d
Steps 22-28, washing of ecto-Fc column: ~ 2-4 h
Steps 29-31, elution of ecto-Fc column: 1-2 h
Step 32, TCA protein precipitation: overnight
Steps 33-37, precipitation washes: 1 h
Steps 38-40, denaturation of proteins: ~ 3 h
Steps 41-44, alkylation and further processing of proteins: 1-2 h
Steps 45-46, trypsin digestion of proteins to peptides: overnight
Steps 47-51, LCLC column preparation: ~ 1 h
Steps 52-55, peptide loading on LCLC column: ~ 2 h
Steps 56-58, analytical tip preparation: ~1 h
Steps 59-60, LCLC-MS/MS analysis: 8-12 h per sample
Steps 61-65, protein identification, quantification, and bioinformatic analysis: ~ 3 d
TROUBLESHOOTING
Troubleshooting guidelines can be found in Table 1.
Table 1.
Troubleshooting
| Step | Problem | Possible reason | Solution |
|---|---|---|---|
|
| |||
| 3 | Cells detach from dishes | Weak cell attachment | Coat cell culture dishes with poly lysine prior to plating |
| Cells detach from dishes | Cells in poor health | Thaw fresh HEK293T cells. High- passage number cells detach easily and produce low yields of ecto-Fc | |
| Cells detach from dishes | Cells over-grown | Plate cells at lower density or decrease transfection duration | |
|
| |||
| 10 | Low ecto-Fc protein recovery | Protein aggregation | Inspect the transfected cells by immunofluorescent microscopy |
| Low ecto-Fc protein recovery | Poor expression | Increase the number of dishes transfected | |
| Low ecto-Fc protein recovery | Poor transfection efficiency | Verify DNA plasmid prep integrity and verify PEI with another DNA | |
| Low ecto-Fc protein recovery | Protein not folding correctly due to point mutations or extracellular domain was cloned too short or leader peptide is absent. | Correct point mutations or re- clone gene including all necessary domains | |
|
| |||
| 11, 12 | Ecto-Fc protein is truncated or expressed heterogeneously | Problematic protein sequence | Re-clone the ecto-domain with optimized codons or alter Fc fusion site |
|
| |||
| 17 | Poor separation of pellet(s) | Extract is too concentrated | Add additional buffer 1 and repeat centrifugation |
|
| |||
| 25 | Affinity column clog | Protein precipitation | Optimize tissue extraction with different solublization strategy (i.e. detergent(s) and time) |
| Affinity column clog | Protein precipitation | Attempt to restore column flow by disturbing beads with wash buffer or using your thumb to apply pressure to push the last buffer through the column from the top of the column | |
|
| |||
| 34 | Very large TCA precipitation pellet | Excess background protein or other macromolecules | Increase the number of acetone washes with vortexing. Or, use methanol / chloroform washes. Increase affinity column washes or decrease input |
|
| |||
| 64 | Low protein recovery | Inefficient prey protein extraction | Optimize tissue extraction with different solublization strategy (ie. detergent(s) and time), test with silver stain or WB |
| Low protein recovery | Sub-optimal binding conditions | Vary binding and wash conditions by adjusting salt and other components | |
|
| |||
| 64 | Excess protein recovery | Sub-optimal binding conditions | Vary binding and wash conditions by adjusting salt, add other components (detergents, EDTA) and increase wash volumes |
ANTICIPATED RESULTS
Ecto-Fc MS is a straightforward and sensitive interaction screen which can identify novel ligand-receptor interactions10–12. The production of ecto-Fc baits is uncomplicated and assessing the ecto-Fcs is achieved by gel electrophoresis with coomassie staining and if necessary MS (Fig. 2b, c). The ecto-Fc proteins should migrate at the appropriate molecular weight and ideally be present as a single species. The identification of ligand – receptor interactions with antibodies can be problematic due to high levels of non-specific background proteins present (Fig. 4a). For each ecto-Fc MS experiment the most abundant protein in each dataset should be the bait Fc protein, which serves as a key internal standard (Fig. 4b). Typically, the bait protein should be identified by 100s to 1000s of spectral counts in each analysis. Background subtraction using the Fc alone negative control datasets should significantly aid in the identification of low abundance or low affinity interactions 10 (Fig. 4c). In regards to the limit of sensitivity of ecto-Fc MS, thus far, for all three of our published interactions have been of relatively high affinity with measured Kd’s in the low nanomolar range 11,12,36. Thus we consider that the method is ideally suited to isolate low nM to low μM affinity complexes. It is likely that mid or high μM affinity complexes will be lost during the washes and “native” already bound complexes with higher affinity may not dissociate during the extraction and thus may not be available for capture and identification by ecto-Fc MS.
FIGURE 4.
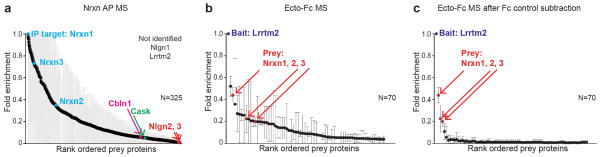
Ecto-Fc MS can efficiently reveal synaptic adhesion ligand – receptor interactions. (a) Antibody based purification of Nrxn with rank ordered prey proteins. 325 proteins were identified with equal or lesser abundance than the IP target proteins. Known Nrxn ligands, Cbln1, Nlgn2, and Nlgn3 are shown in red and Cis intracellular interaction partner Cask is shown in green. (b) Three Lrrtm2 ecto-Fc MS experiments with identified prey proteins. For each experiment the prey protein abundances are normalized relative to the bait LRRTM2 and graphed as a fold enrichment (n=3; + s.d.). Nrxn represents a known Lrrtm2 ligand. (c) Lrrtm2 ecto-Fc MS results after removing all proteins identified in any of 3 negative control Fc MS experiments. For both (b & c) 70 proteins are indicated on the plot for ease of viewing and fair comparison.
A powerful approach to verifying candidate ligand-receptor interactions is to generate a bait Fc protein for the candidate receptor and test if the original bait can be identified by MS in a reciprocal Ecto-Fc MS assay as prey. For the most confident ligand-receptor pairs the bait and prey will be the most abundant proteins in both datasets, with each as bait in one condition and prey in the other (Fig. 5a, b). Other ligands may form trimetric or binary trans-interactions with multiple receptors (Fig. 5b). Negative results should be considered with extreme caution since there are many possible reason(s) why this approach may fail even though a high affinity receptor exists (Table 1).
FIGURE 5.

Reciprocal Ecto-Fc MS experiments confirm new interactions. (a) Bait / prey swap can confirm individual results. In the first Ecto-Fc MS experiment with Nlgn1-Fc bait, Nrxn1 is identified by MS. In the reciprocal experiment with Nrxn1-Fc bait, Nlgn1 is identified by MS. (b) Ligand – receptor interactions which involve multiple proteins can be efficiently analyzed. In both (a and b) plots show the frequency of detection of all peptides (total spectra count, ‘‘spec #’’) for proteins identified in both Ecto-Fc MS experiments.
It is highly important to interpret each dataset carefully considering replicate purifications and controls when available. In replicate experiments, non-specific binding proteins are often identified sporadically while true receptors are repeatedly identified proteins in the purified material but absent from the Fc control purifications. In some Ecto-Fc MS experiments the ligand – receptor interaction can be identified from a single experiment, however some challenging proteins may require optimized conditions. Nonetheless we have found Ecto-Fc MS to be a successful approach to reveal new ligand-receptor interactions for many synaptic proteins.
Summary.
In this protocol the authors describe a biochemical approach to identify ligand – receptor interactions in discovery mode with extracellular domain IgG fusion baits, tissue extracted preys, and shotgun proteomic analysis.
Acknowledgments
We thank Mathew O’Sullivan, Bryan Fonslow, Benjamin Stein, and James Moresco and members of the Yates and Ghosh labs for feedback on the project. Sventja Von Daake for suggestions on the manuscript. We would like to thank Dr. Thomas Südhof (Stanford University) for his generosity in providing the original plasmids of beta-NRXN1. This plasmid has been modified to accommodate many different genes and suit a variety of applications, but the original high-expression backbone remains unchanged. JNS is supported by NIH Pathway to Independence Award K99DC013805-01. The Yates laboratory is supported by R01 MH068770, P41 GM103533, R01MH100175 and HHSN268201000035C grants from NIH. Additionally with NIH grants R01NS067216 and R01MH068578 to AG. Plus NIH RO1-MH092906 to DC and the Robert Wood Johnson Foundation (grant # 67038) for their support of the Child Health Institute of New Jersey. JDW is funded by a NARSAD Young Investigator Award from the Brain and Behavior Research Foundation, ERC Starting Grant (#311083) and FWO Odysseus Grant.
Footnotes
AUTHOR CONTRIBUTIONS JNS, JdW, AG, and JRY contributed to the conception of and design of the project. JNS, JdW, DC, and RZ performed the experiments. JNS, JdW and DC wrote the manuscript.
COMPETING FINANCIAL INTERESTS The author’s declare no competing financial interests.
References
- 1.Chen Y, Fournier A, Couvineau A, Laburthe M, Amiranoff B. Purification of a galanin receptor from pig brain. Proceedings of the National Academy of Sciences of the United States of America. 1993;90:3845–3849. doi: 10.1073/pnas.90.9.3845. [DOI] [PMC free article] [PubMed] [Google Scholar]
- 2.Ichtchenko K, et al. Neuroligin 1: a splice site-specific ligand for beta-neurexins. Cell. 1995;81:435–443. doi: 10.1016/0092-8674(95)90396-8. [DOI] [PubMed] [Google Scholar]
- 3.Sugita S, et al. A stoichiometric complex of neurexins and dystroglycan in brain. The Journal of cell biology. 2001;154:435–445. doi: 10.1083/jcb.200105003. [DOI] [PMC free article] [PubMed] [Google Scholar]
- 4.Flanagan JG, Vanderhaeghen P. The ephrins and Eph receptors in neural development. Annual review of neuroscience. 1998;21:309–345. doi: 10.1146/annurev.neuro.21.1.309. [DOI] [PubMed] [Google Scholar]
- 5.Savas JN, Stein BD, Wu CC, Yates JR., 3rd Mass spectrometry accelerates membrane protein analysis. Trends in biochemical sciences. 2011;36:388–396. doi: 10.1016/j.tibs.2011.04.005. [DOI] [PMC free article] [PubMed] [Google Scholar]
- 6.Eng JK, McCormack AL, Yates JR. An approach to correlate tandem mass spectral data of peptides with amino acid sequences in a protein database. Journal of the American Society for Mass Spectrometry. 1994;5:976–989. doi: 10.1016/1044-0305(94)80016-2. [DOI] [PubMed] [Google Scholar]
- 7.Aebersold R, Mann M. Mass spectrometry-based proteomics. Nature. 2003;422:198–207. doi: 10.1038/nature01511. [DOI] [PubMed] [Google Scholar]
- 8.Frei AP, et al. Direct identification of ligand-receptor interactions on living cells and tissues. Nature biotechnology. 2012;30:997–1001. doi: 10.1038/nbt.2354. [DOI] [PubMed] [Google Scholar]
- 9.Ko J, Fuccillo MV, Malenka RC, Sudhof TC. LRRTM2 functions as a neurexin ligand in promoting excitatory synapse formation. Neuron. 2009;64:791–798. doi: 10.1016/j.neuron.2009.12.012. [DOI] [PMC free article] [PubMed] [Google Scholar]
- 10.de Wit J, et al. Unbiased discovery of glypican as a receptor for LRRTM4 in regulating excitatory synapse development. Neuron. 2013;79:696–711. doi: 10.1016/j.neuron.2013.06.049. [DOI] [PMC free article] [PubMed] [Google Scholar]
- 11.de Wit J, et al. LRRTM2 interacts with Neurexin1 and regulates excitatory synapse formation. Neuron. 2009;64:799–806. doi: 10.1016/j.neuron.2009.12.019. S0896-6273(09)01009-5 [pii] [DOI] [PMC free article] [PubMed] [Google Scholar]
- 12.O'Sullivan ML, et al. FLRT proteins are endogenous latrophilin ligands and regulate excitatory synapse development. Neuron. 2012;73:903–910. doi: 10.1016/j.neuron.2012.01.018. S0896-6273(12)00134-1 [pii] [DOI] [PMC free article] [PubMed] [Google Scholar]
- 13.Neeper M, et al. Cloning and expression of a cell surface receptor for advanced glycosylation end products of proteins. The Journal of biological chemistry. 1992;267:14998–15004. [PubMed] [Google Scholar]
- 14.Thompson A, et al. Tandem mass tags: a novel quantification strategy for comparative analysis of complex protein mixtures by MS/MS. Analytical chemistry. 2003;75:1895–1904. doi: 10.1021/ac0262560. [DOI] [PubMed] [Google Scholar]
- 15.Aruffo A, Stamenkovic I, Melnick M, Underhill CB, Seed B. CD44 is the principal cell surface receptor for hyaluronate. Cell. 1990;61:1303–1313. doi: 10.1016/0092-8674(90)90694-a. [DOI] [PubMed] [Google Scholar]
- 16.Ushkaryov YA, et al. Conserved domain structure of beta-neurexins. Unusual cleaved signal sequences in receptor-like neuronal cell-surface proteins. The Journal of biological chemistry. 1994;269:11987–11992. [PubMed] [Google Scholar]
- 17.Hacker DL, et al. Polyethyleneimine-based transient gene expression processes for suspension-adapted HEK-293E and CHO-DG44 cells. Protein expression and purification. 2013;92:67–76. doi: 10.1016/j.pep.2013.09.001. [DOI] [PMC free article] [PubMed] [Google Scholar]
- 18.Link AJ, et al. Direct analysis of protein complexes using mass spectrometry. Nature biotechnology. 1999;17:676–682. doi: 10.1038/10890. [DOI] [PubMed] [Google Scholar]
- 19.Washburn MP, Wolters D, Yates JR., 3rd Large-scale analysis of the yeast proteome by multidimensional protein identification technology. Nature biotechnology. 2001;19:242–247. doi: 10.1038/85686. [DOI] [PubMed] [Google Scholar]
- 20.Butko MT, et al. In vivo quantitative proteomics of somatosensory cortical synapses shows which protein levels are modulated by sensory deprivation. Proceedings of the National Academy of Sciences of the United States of America. 2013;110:E726–735. doi: 10.1073/pnas.1300424110. [DOI] [PMC free article] [PubMed] [Google Scholar]
- 21.Niessen S, McLeod I, Yates JR., 3rd HPLC separation of digested proteins and preparation for matrix-assisted laser desorption/ionization analysis. CSH protocols. 2006;2006 doi: 10.1101/pdb.prot4663. [DOI] [PubMed] [Google Scholar]
- 22.Xu T, Wong CC, Kashina A, Yates JR., 3rd Identification of N-terminally arginylated proteins and peptides by mass spectrometry. Nature protocols. 2009;4:325–332. doi: 10.1038/nprot.2008.248. [DOI] [PMC free article] [PubMed] [Google Scholar]
- 23.Yates JR, 3rd, et al. Toward objective evaluation of proteomic algorithms. Nature methods. 2012;9:455–456. doi: 10.1038/nmeth.1983. [DOI] [PMC free article] [PubMed] [Google Scholar]
- 24.Perkins DN, Pappin DJ, Creasy DM, Cottrell JS. Probability-based protein identification by searching sequence databases using mass spectrometry data. Electrophoresis. 1999;20:3551–3567. doi: 10.1002/(SICI)1522-2683(19991201)20:18<3551::AID-ELPS3551>3.0.CO;2-2. [DOI] [PubMed] [Google Scholar]
- 25.Geer LY, et al. Open mass spectrometry search algorithm. Journal of proteome research. 2004;3:958–964. doi: 10.1021/pr0499491. [DOI] [PubMed] [Google Scholar]
- 26.Craig R, Beavis RC. TANDEM: matching proteins with tandem mass spectra. Bioinformatics. 2004;20:1466–1467. doi: 10.1093/bioinformatics/bth092. [DOI] [PubMed] [Google Scholar]
- 27.Carvalho PC, Fischer JS, Chen EI, Yates JR, 3rd, Barbosa VC. PatternLab for proteomics: a tool for differential shotgun proteomics. BMC bioinformatics. 2008;9:316. doi: 10.1186/1471-2105-9-316. [DOI] [PMC free article] [PubMed] [Google Scholar]
- 28.Cox J, et al. A practical guide to the MaxQuant computational platform for SILAC-based quantitative proteomics. Nature protocols. 2009;4:698–705. doi: 10.1038/nprot.2009.36. [DOI] [PubMed] [Google Scholar]
- 29.Clough T, Thaminy S, Ragg S, Aebersold R, Vitek O. Statistical protein quantification and significance analysis in label-free LC-MS experiments with complex designs. BMC bioinformatics. 2012;13(Suppl 16):S6. doi: 10.1186/1471-2105-13-S16-S6. [DOI] [PMC free article] [PubMed] [Google Scholar]
- 30.Liu H, Sadygov RG, Yates JR., 3rd A model for random sampling and estimation of relative protein abundance in shotgun proteomics. Analytical chemistry. 2004;76:4193–4201. doi: 10.1021/ac0498563. [DOI] [PubMed] [Google Scholar]
- 31.Paoletti AC, et al. Quantitative proteomic analysis of distinct mammalian Mediator complexes using normalized spectral abundance factors. Proceedings of the National Academy of Sciences of the United States of America. 2006;103:18928–18933. doi: 10.1073/pnas.0606379103. [DOI] [PMC free article] [PubMed] [Google Scholar]
- 32.Maiolica A, Borsotti D, Rappsilber J. Self-made frits for nanoscale columns in proteomics. Proteomics. 2005;5:3847–3850. doi: 10.1002/pmic.200402010. [DOI] [PubMed] [Google Scholar]
- 33.Liao L, McClatchy DB, Yates JR. Shotgun proteomics in neuroscience. Neuron. 2009;63:12–26. doi: 10.1016/j.neuron.2009.06.011. [DOI] [PMC free article] [PubMed] [Google Scholar]
- 34.McDonald WH, et al. MS1, MS2, and SQT-three unified, compact, and easily parsed file formats for the storage of shotgun proteomic spectra and identifications. Rapid communications in mass spectrometry : RCM. 2004;18:2162–2168. doi: 10.1002/rcm.1603. [DOI] [PubMed] [Google Scholar]
- 35.Tabb DL, McDonald WH, Yates JR., 3rd DTASelect and Contrast: tools for assembling and comparing protein identifications from shotgun proteomics. Journal of proteome research. 2002;1:21–26. doi: 10.1021/pr015504q. [DOI] [PMC free article] [PubMed] [Google Scholar]
- 36.Siddiqui TJ, et al. An LRRTM4-HSPG complex mediates excitatory synapse development on dentate gyrus granule cells. Neuron. 2013;79:680–695. doi: 10.1016/j.neuron.2013.06.029. [DOI] [PubMed] [Google Scholar]