Abstract
Major advances have recently occurred in our understanding of GATA factor-mediated, nitrogen catabolite repression (NCR)-sensitive gene expression in Saccharomyces cerevisiae. Under nitrogen-rich conditions, the GATA family transcriptional activators, Gln3 and Gat1, form complexes with Ure2, and are localized to the cytoplasm, which decreases NCR-sensitive expression. Under nitrogen-limiting conditions, Gln3 and Gat1 are dephosphorylated, move from the cytoplasm to the nucleus, in wild-type but not rna1 and srp1 mutants, and increase expression of NCR-sensitive genes. ‘Induction’ of NCR-sensitive gene expression and dephosphorylation of Gln3 (and Ure2 in some laboratories) when cells are treated with rapamycin implicates the Tor1/2 signal transduction pathway in this regulation. Mks1 is posited to be a negative regulator of Ure2, positive regulator of retrograde gene expression and to be itself negatively regulated by Tap42. In addition to Tap42, phosphatases Sit4 and Pph3 are also argued by some to participate in the regulatory pathway. Although a treasure trove of information has recently become available, much remains unknown (and sometimes controversial) with respect to the precise biochemical functions and regulatory pathway connections of Tap42, Sit4, Pph3, Mks1 and Ure2, and how precisely Gln3 and Gat1 are prevented from entering the nucleus. The purpose of this review is to provide background information needed by students and investigators outside of the field to follow and evaluate the rapidly evolving literature in this exciting field.
Keywords: Tor, Gln3, Gat1, Nitrogen repression, Rapamycin, Mks1, Ure2, GATA factor
1. Introduction
Signal transduction pathways, through which nutrient availability in the environment generates signals that are transduced and transmitted to the transcriptional apparatus, have been and will continue to be a subject of enthusiastic investigation. In this era of post-genomic analysis, the late Helmut Ruis, commenting on the transformation brought about by the advent of these revolutionary technologies, once remarked that those who can learn and become facile with new biological systems the quickest were also those most likely to prevail in the competition so intimately entwined with contemporary science. His perception was correct. This, however, can be a daunting task for students. Traditional in depth reviews can provide so much detail that a novice reader drowns in the mass of information and ‘fails to see the forest for the trees’. A mini-review, on the other hand, may provide such a brief and broad overview as not to permit a student to appreciate the nuances about which specialists disagree and which are often the bases for next generation discoveries.
Against this backdrop, the present review is an experiment. It derives from a lecture presented at the 20th International Conference on Yeast Genetics and Molecular Biology in Prague. It’s objective is to introduce investigators with little exposure to or appreciation of nutrient-responsive signaling to the regulatory network associated with nitrogen catabolism. It attempts to lay a foundation containing sufficient information to provide readers with an overall understanding of the field followed by identification of areas remaining open to question and different points of view. The goal is to bring readers to a point where they can evaluate future journal articles with understanding and discrimination. Several in depth reviews exist and the interested reader is directed to them for more comprehensive historical information [1–3]. This review is not intended to be absolutely comprehensive, but is nearly so only with respect to the last 2 years. References to specific data, statements and proposals, however, are cited.
2. The Saccharomyces cerevisiae GATA factors
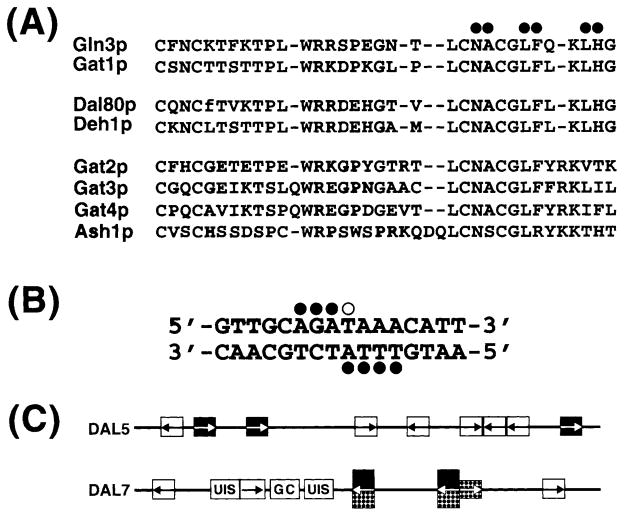
The GATA family of transcription factors in S. cerevisiae consists of at least eight members, each possessing a homologous Zn2+-chelating zinc-finger motif (C-X2-C-N-C-X2-C) with a loop size (N) ranging from 17 to 20 residues (Fig. 1A). The family may, in fact, be somewhat larger since additional proteins exist in which the size of the loop is outside of this range (Jean Claude Jauniaux, personal communication). Nuclear magnetic resonance structural analyses of the mammalian GAT1 zinc-finger peptide, complexed with its DNA target, indicate that residues at the C-terminus of the zinc-finger and just beyond contact the DNA (Fig. 1A, filled circles) [4]. The target of the GATA family proteins is a sequence containing GATA at its core (Fig. 1B) [4]. Four nucleotides on each strand of the DNA contact GAT1 protein, seven in the major groove and one in the minor (Fig. 1B, closed and open circles, respectively) [4].
Fig. 1.
A: Zinc-finger homologies among the S. cerevisiae GATA family proteins. Filled circles represent mammalian GAT1 residues that contact the DNA. B: DNA target of the GAT1 protein. Filled and open circles identify nucleotides in the major and minor grooves, respectively, that contact the protein. C: Diagrams of the DAL5 and DAL7 promoters. Arrows indicate GATA sequences. Filled and dotted boxes indicate functional Gln3- and Dal80-binding sites, respectively. Open boxes indicate GATA sequences that do not appear to function. UIS and GC boxes represent other UAS elements that are not pertinent to the present discussion. Taken from [4–6].
In yeast, the presence of a GATA sequence in a gene’s promoter does not necessarily imply GATA factor regulation of its expression. For example, expression of DAL5 and DAL7 (encoding allantoate permease and malate synthase, two components of the allantoin degradation pathway) is highly regulated by GATA factors, and their promoters possess multiple GATA sequences (Fig. 1C). However, only two of the DAL5 GATA elements function at full capacity; a third one functions at 10%, and the other six cannot be shown to function under any condition assayed so far [5]. Similarly in DAL7, only three of the six GATAs present appear to function [6]. These observations imply that GATA elements consist of more than the core GATA. Although a few additional structural details of this cis-acting element have been reported [5], our information is still quite incomplete, especially since those early experiments were performed prior to recognizing that GATA-mediated transcription is activated by more than one protein of the GATA family.
This review will focus on the four GATA factors that have clearly been shown to mediate nitrogen-responsive gene expression: (i) a pair of transcriptional activators, Gln3 and Gat1/Nil1, and (ii) a pair of transcriptional repressors Dal80 and Deh1/Gzf3. Given the homologies between these four proteins, it is not too surprising that Gln3 and Dal80 bind the same GATAs upstream of the DAL3 and UGA4 genes [7]. Such a result could lead to the suggestion that genes responding to one GATA factor will respond to all of them; this is not the case. DAL5 expression is only modestly Dal80-regulated, while that of DAL7 is highly responsive, yet both genes are highly Gln3-dependent. Part of the explanation for these differences is that Gln3 (and likely Gat1) binds to single GATA elements while Dal80 and Deh1, which both form dimers through leucine zipper motifs at their C-termini, require two GATA elements for binding [8]. For Dal80 these GATA elements must be 15–35 bp apart, in either orientation in the promoter, and oriented head-to-tail or tail-to-tail, but not head-to-head [9]. Similar structural characteristics of the Deh1-binding site are not yet available. Gene expression studies with gln3Δ and gat1Δ mutants suggest that Gln3 and Gat1 similarly possess overlapping, but non-congruent DNA-binding specificities.
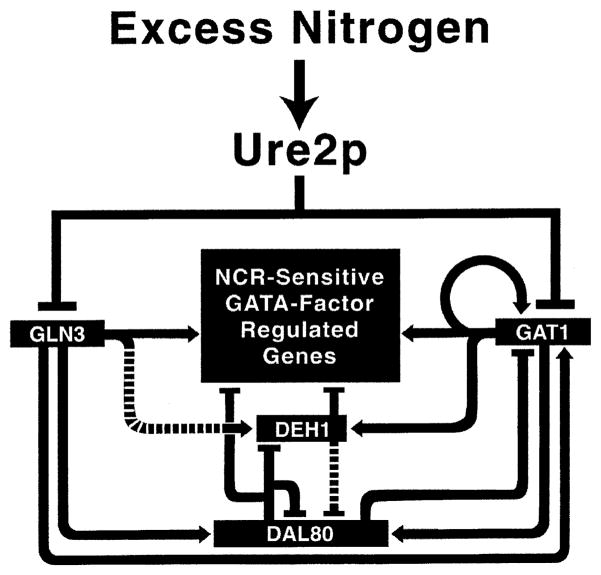
Multiple GATA factors, Gln3, Gat1, Dal80 and Deh1, regulate the expression of many genes in parallel [10]. This and the demonstration that Gln3 and Dal80 can bind to the same DAL3 GATA elements prompted the hypothesis that Dal80 and Deh1 repress gene expression by competing with the Gln3 and Gat1 activators for binding to their target GATA sequences [11]. A corollary of this generally accepted model is that increasing the amount of Dal80, while holding Gln3 or Gat1 constant, will decrease a target gene’s expression. Conversely, increasing the amount of Gat1, while holding Dal80 constant, will increase target gene expression. This has been demonstrated experimentally [13]. For such a competitive mechanism of control to be successful, the ratios of GATA activator to repressor protein levels must be tightly coordinated. This is achieved by GAT1, DAL80, and DEH1 gene expression being regulated by all of the GATA factors. The results of many experiments from several laboratories are summarized in a working model of reciprocal GATA factor control (Fig. 2). The model appears complex, but carries a very simple message. Expression of all GATA factor encoding genes, except GLN3, is regulated by all of the GATA factors. This includes autogenous regulation of GAT1, DAL80, and DEH1 expression.
Fig. 2.
Model of reciprocal regulation of GATA factor gene expression and GATA factor regulation of NCR-sensitive gene expression per se. Arrowheads and bars designate positive and negative regulation, respectively. Dashed areas designate weak regulation. Taken from [11].
The following example demonstrates how the system works and its physiological utility. Gln3, which has to date not been demonstrated to be transcriptionally regulated to any significant extent, can be considered to be the initial regulator. When Gln3 becomes functional (how this occurs will be discussed later), it activates GAT1 expression. It is unlikely to be a coincidence that most GATA factor-activated genes require both Gln3 and Gat1 for expression, but to different degrees. As Gat1 is produced and autogenously increases its own production, the necessary requirements for GATA-mediated gene expression have been met and transcription of these genes occurs. However, these are also precisely the requirements for DAL80 and DEH1 expression to occur. Increasing Dal80 production not only down-regulates GATA factor-mediated gene expression by competing with Gln3 and Gat1 for binding to the GATA sequences, but also down-regulates GAT1 expression as well. This back and forth activation/repression of GATA factor gene expression quickly brings the system to steady state. Although the reasoning and experimental support for this model [13] are not described here, one can easily imagine the advantage of such reciprocal regulation when GATA factor-mediated gene expression shifts from a low to a high level in response to environmental perturbation.
3. Nitrogen catabolite repression (NCR)
This section will focus on the molecular events associated with GATA factor-mediated transcriptional activation and its control, and begins with a brief review of NCR (Fig. 3), the physiological process by which selective use of available nitrogen sources is achieved. Yeast cells in nature find themselves faced with good and poor nitrogen sources; also referred to as preferred and non-preferred or secondary nitrogen sources. S. cerevisiae, like most micro-organisms, transports, accumulates, and utilizes good nitrogen sources in preference to poor ones. NCR is the mechanism for achieving this selectivity and is the preeminent control exerted over nitrogen catabolic gene expression. In the presence of excess nitrogen (a good nitrogen source in adequate supply) transcription of genes encoding the proteins needed to transport and degrade poor nitrogen sources does not occur; it is, if you will, ‘repressed’ (Fig. 3, left panel). On the other hand, when the amount of a good nitrogen source becomes limiting, or only poor nitrogen sources are available, the genes needed for their transport and catabolism are transcribed (Fig. 3, right panel). This is the transition from ‘repressed’ to ‘derepressed’ GATA-mediated gene expression described in Section 2.
Fig. 3.
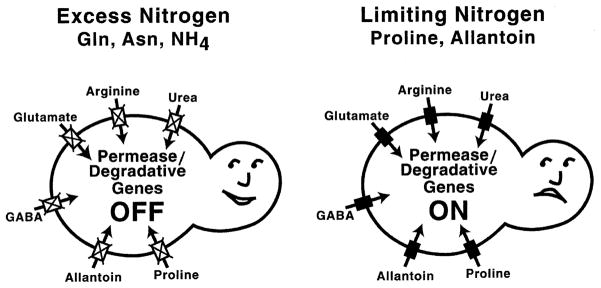
NCR. Closed and open boxes designate the presence and absence of transport gene expression. Compounds surrounding the yeast cells are all poor nitrogen sources.
It is important to emphasize that NCR and Dal80-mediated repression occur by different mechanisms, at different times, and serve different physiological purposes. As will become clearer in the subsequent discussion, mechanistically, NCR is the absence of transcriptional activation rather than proactive inhibition of transcription. Dal80-mediated repression, in contrast, is a competitive modulation/inhibition of GATA factor-mediated transcriptional activation. Strong NCR and Dal80-mediated repression do not occur simultaneously. This is because DAL80 expression is highly NCR-sensitive, and therefore, very little Dal80 exists during times of strong NCR. This makes good physiological sense because the expression of genes that are turned off has no need for finely tuned modulation.
4. Genomic analysis of NCR-sensitive, GATA factor-mediated transcription
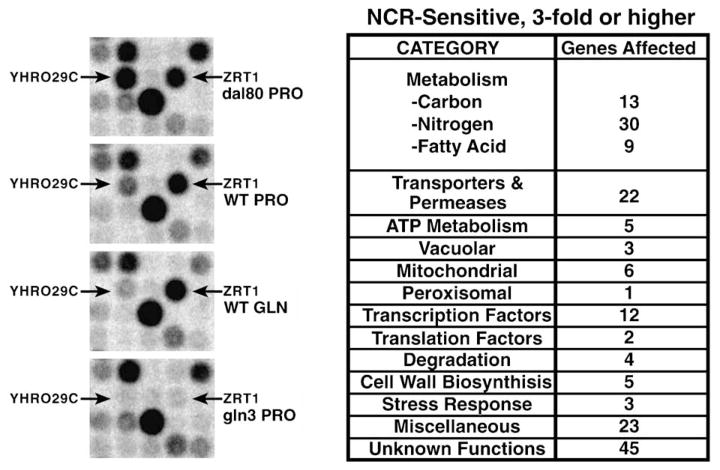
Although work prior to 1999 addressing GATA factor-mediated gene expression focused on NCR-sensitive, nitrogen catabolic genes, the GATA factor regulon extends far beyond nitrogen catabolism. At first, the regulon grew one gene at a time, extending from nitrogen catabolic genes to some vacuolar proteases and then to small peptide transport components [1,2,14]. Genomic analysis of NCR-sensitive, GATA factor-regulated gene expression greatly broadened our appreciation of the breadth of GATA factor control [15]. Genes as diverse as those encoding a sulfate permease (YGR125w) or Pma1p, the ATPase primarily responsible for maintaining an electrochemical potential across the cell membrane, were identified as GATA factor-regulated (Fig. 4) [15]. Similar conclusions have been derived from several more recent related analyses [16–18]. I have not presented a detailed analysis of the various genomic experiments except as they impact on proposed molecular mechanisms. This course was chosen for two reasons: (i) except for genes whose expression was known already to be NCR-sensitive, and in some cases for genes associated with the protein synthetic apparatus, very high variation exists among the results reported from different laboratories. There is similarity of results, but far less than might, a priori, be expected. (ii) Considerable time and more than a little speculation would be required for thorough analysis of the diverse genomic results and their reconciliation to one another.
Fig. 4.
(Left) Small portions of four mini-array analysis membranes demonstrating expression characteristics of a typical NCR-sensitive gene, YHR029c, and another, ZRT1, which is regulated by Gln3, but is not NCR-sensitive or Dal80-regulated. (Right) Summary of genes in various functional categories whose expression is NCR-sensitive. Modified from [15].
5. The mechanism of NCR
A central unanswered question is the mechanism by which NCR is achieved. The first insight derived unexpectedly from the 1969 doctoral thesis of Francois Lacroute, who was investigating the control of pyrimidine biosynthetic genes. Ureidosuccinate (USA) is the first unique intermediate in the uracil biosynthetic pathway and can be substituted for uracil in the culture medium to fulfill the auxotrophy generated by ura2 mutations (URA2 encodes aspartate transcarbamylase, the first enzyme in uracil biosynthesis) [19–21]. Lacroute observed that USA could successfully substitute for uracil when proline, but not ammonia, was used as the sole source of nitrogen. Therefore, he selected mutant strains in which USA could fulfill the auxotrophy of ura2 mutations with ammonia as nitrogen source. These mutations, designated ure2 (ureidosuccinate), were found to function by permitting USA transport even with ammonia as nitrogen source. In other words, ammonia represses USA uptake in wild-type cells, but the ure2 mutation abrogates this ‘ammonia repression’ (ammonia repression was replaced by the term NCR when the phenomenon was found to occur with nitrogen sources other than ammonia as well). The laboratories of Lacroute, Grenson and Wiame found ure2 mutants possessed a general phenotype in that multiple nitrogen catabolic genes become insensitive to ‘ammonia repression’ [1–3,22]. This was a remarkable finding and conundrum because there was no precedent for biosynthetic (uracil biosynthesis) and catabolic (nitrogen catabolism) pathways to be controlled in the same way. The conundrum was explained when it was found that the ‘biosynthetic’ UREP (encoding USA permease) was the same as Dal5, the ‘catabolic’ NCR-sensitive permease for allantoate [23], a poor nitrogen source (Fig. 3).
Further understanding of Ure2 function derived from experiments from Magasanik’s laboratory. Courchesne and Magasanik reported that gln3 mutations were epistatic to those at ure2, making Ure2 a negative regulator of Gln3 function [24], or of NCR-sensitive gene expression (Fig. 2). Determination of the URE2 gene sequence showed there is significant homology between Ure2 and the theta family of glutathione S-transferases (GST), which led to the conclusion that Ure2 functioned by mediating post-translational modification of Gln3 [25]. This was followed by a report that Gln3-specific antibody immunoprecipitated Ure2 leading to the revised proposal that Ure2 formed a complex with Gln3 [26], a fact convincingly confirmed by more recent analyses [18,27]. Whether the theta family glutathionine transferase homology in Ure2 possesses physiological significance remains unknown.
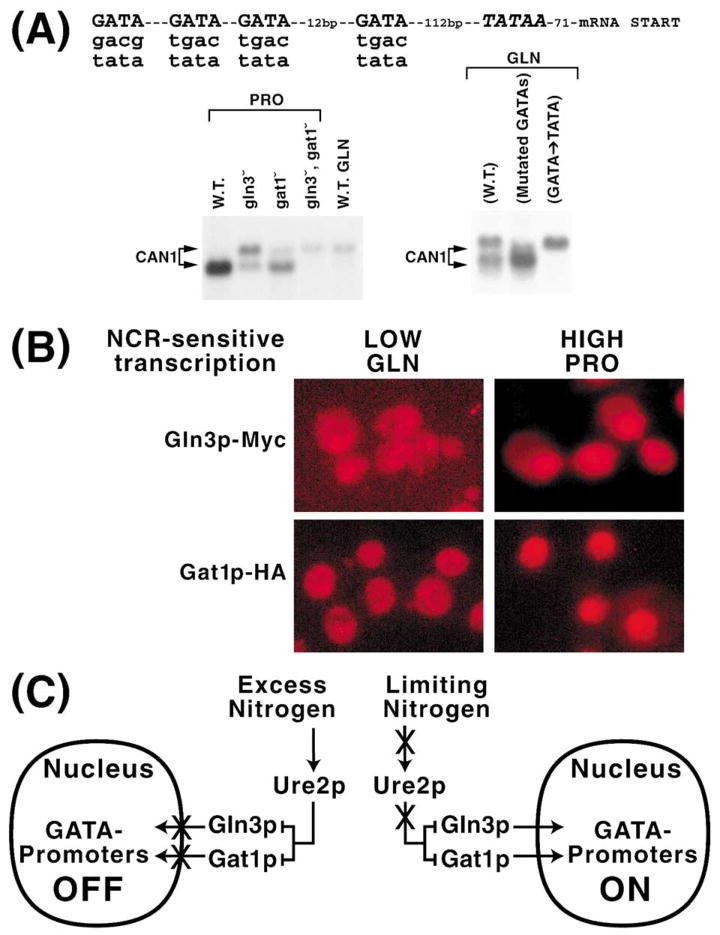
The next in vivo insight into the mechanism of NCR derived from an incidental observation made while studying expression of the NCR-sensitive CAN1 gene, which encodes arginine permease (arginine is a relatively poor nitrogen source in Fig. 3) [28]. CAN1 expression is high in a wild-type provided with proline as nitrogen source (Fig. 5A, left panel) [29]. However, when glutamine, a good nitrogen source, is substituted for proline, the CAN1 mRNA species seen with proline largely disappears and a new slower migrating species appears. Interestingly, the larger species also occurs in either gln3 or gat1 deletions and is the only species present in a gln3Δgat1Δ double mutant. It is important to note that these are the conditions in which NCR-sensitive gene expression does not occur. This observation could be explained by inspecting the DNA sequence upstream of CAN1 (Fig. 5A). The distance between the cluster of GATAs and the TATA sequence, a primary determinant of the mRNA start site, was about the same as the difference in the sizes of the large and small CAN1 transcripts. Although a GATA sequence was reported not to function as a TATA in S. cerevisiae [30], it was reported to do so in mammalian cells [31]. Therefore, we proposed the GATA elements were serving as surrogate TATA elements in glutamine medium or in the GATA activator deletion strains. This proposal generates two predictions: (i) the slower migrating species should depend upon the integrity of the GATA sequences, i.e. mutating them should result in its loss, and (ii) replacing these GATAs with TATAs should result in the reappearance of the longer species. As shown in the right panel of Fig. 5A, these predictions are verified by the data [29].
Fig. 5.
A: Sequence upstream of CAN1. Northern blot analysis of CAN1 expression in wild-type (W.T.) and mutants containing altered GATA elements. Proline (PRO) or glutamine (GLN) were used as sole nitrogen sources. Data in the left panel derived from wild-type chromosomal CAN1, while those in the right panel derived from wild-type and mutant CAN1 genes carried on a CEN-based plasmid [29]. B: Intracellular distribution GFP–Gln3 and GFP–Gat1 in glutamine or proline grown cultures. C: Model explaining the results obtained in A and B. Arrows and bars indicate positive and negative regulation, respectively. Xs indicate processes that no longer occur under the nitrogen conditions depicted. Modified from [12,29].
The significance of these results is their demonstration that in gln3Δgat1Δ or under conditions of strong NCR, no proteins are bound to the CAN1 GATAs, and therefore they are available to serve as surrogate TATA elements. The GATA elements could be unoccupied for one or both of two reasons: (i) nuclear Gln3 and Gat1 are modified and hence unable to bind their target sequences. (ii) Gln3 and Gat1 are not in the nucleus under conditions of NCR. To distinguish between these possibilities, we constructed GFP–GLN3 and GFP–GAT1 fusion plasmids and determined the localization of these GATA factors [12,29]. Under conditions in which NCR-sensitive transcription is high, both are nuclear. Conversely, when NCR-sensitive expression is low, Gln3 and Gat1 are both excluded from the nucleus. Results similar to those in [12,29] are shown in Fig. 5B for cells growing in proline and glutamine. These observations are summarized as a working model in Fig. 5C. When nitrogen is in excess, Ure2 is able to inhibit the operation of Gln3 and Gat1 and does so by preventing their entry into the nucleus. When a poor nitrogen source is provided or a good nitrogen source is limiting, Ure2 is prevented from functioning. Since Ure2 cannot inhibit Gln3 and Gat1 operation, these molecules gain entry to the nucleus, bind to promoter-situated GATA elements, and activate GATA factor-mediated transcription.
6. Rapamycin, induction of NCR-sensitive gene expression, and the Tor proteins
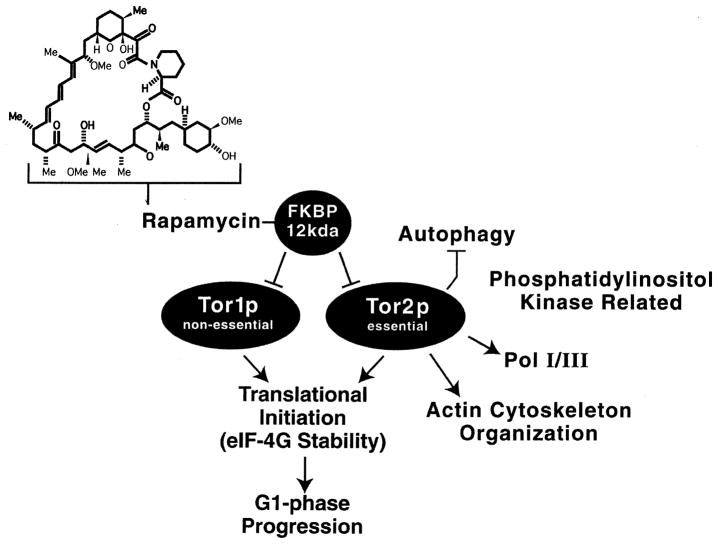
Although the above experiments correlate GATA factor localization and ability to mediate NCR-sensitive transcription in vivo, they do not address the biochemical mechanisms that achieve this regulated localization. The breakthrough to mechanism came from a rather unrelated field of study, i.e. mechanistic studies of the immunosuppressant and anti-neoplastic drug, rapamycin (Fig. 6, top). Rapamycin, first derived from Streptomyces hygroscopicus isolated on Easter Island, is a lipophilic macrolide able to form a complex with a small, 12-kDa peptidyl-prolyl isomerase, FKBP/Rbp1. This complex (Fig. 6) is a potent inhibitor of the activity of Tor1 and Tor2 [32], two proteins that possess regions homologous to those in phosphatidylinositol-3 lipid kinases and DNA-dependent protein kinase and whose perturbation has very pleiotropic effects upon the cell. The Tor proteins share some functions in common, but others are specific to only one of them (Fig. 6). In addition, there may be multiple ways for Tor proteins to function or to interact with their targets. For example, rapamycin inhibits Torp-stimulated protein synthesis, but does not inhibit Torp-dependent actin reorganization and activation of PCK1 [33]. The reader is referred to several good reviews of the Tor1/2p literature for more comprehensive information [34–37].
Fig. 6.
Structure of rapamycin, the molecule with which it interacts, and the pathways which respond to its addition to cells. Arrows and bars indicate positive and negative regulation, respectively.
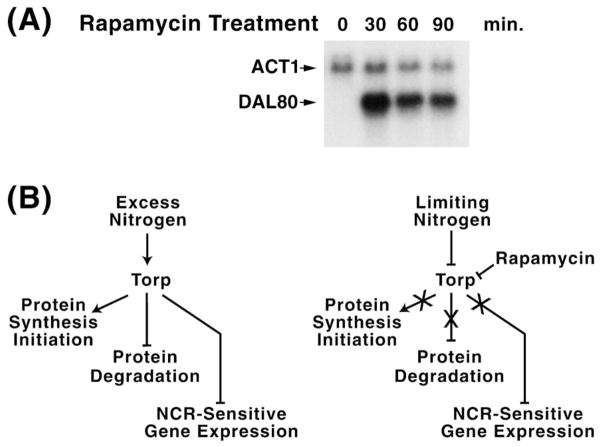
Interest in Tor proteins in relation with the topic treated here derives from an observation independently reported by the laboratories of Hall, Heitman, Schreiber, and Zheng [16–18,27]. An example of the seminal observation is shown in Fig. 7A where DAL80 expression is monitored. As stated before, DAL80 is highly NCR-sensitive when cells are grown in minimal glutamine medium; however, addition of rapamycin quickly ‘induces’ its expression to a high level, which then tapers off with increasing time (Fig. 7A). Three of the four laboratories mentioned above arrived at expression profiles such as this one from genomic analyses of transcription in the presence and absence of rapamycin [16–18]. They found many NCR-sensitive genes encoding nitrogen catabolic enzymes and permeases were ‘induced’ along with many others. Two of these laboratories also observed that a large collection of genes required for protein synthesis were ‘repressed’ by rapamycin addition [16,17]. These observations generate a working model positing that in the presence of excess nitrogen, the Tor proteins are active (Fig. 7B). As a result, protein synthesis is stimulated, while protein degradation and NCR-sensitive gene expression are inhibited. In poor nitrogen sources or in the presence of rapamycin, the Tor proteins are inactivated with the result of an inability to stimulate protein synthesis, induction of protein degradation, and increases in NCR-sensitive gene expression. In other words, the generation and utilization of the precursors for synthesis of nitrogenous macromolecules are oppositely regulated by Tor protein activity.
Fig. 7.
A: Northern blot analysis of Dal80 expression following addition of rapamycin to the medium. ACT1 is the loading standard. B: Model summarizing results of genomic experiments in which nitrogen was in excess (YPD), limiting or rapamycin was added to the medium. Bars and arrowheads indicate negative and positive regulation, respectively. Xs designate processes that no longer occur under the nitrogen or rapamycin conditions indicated.
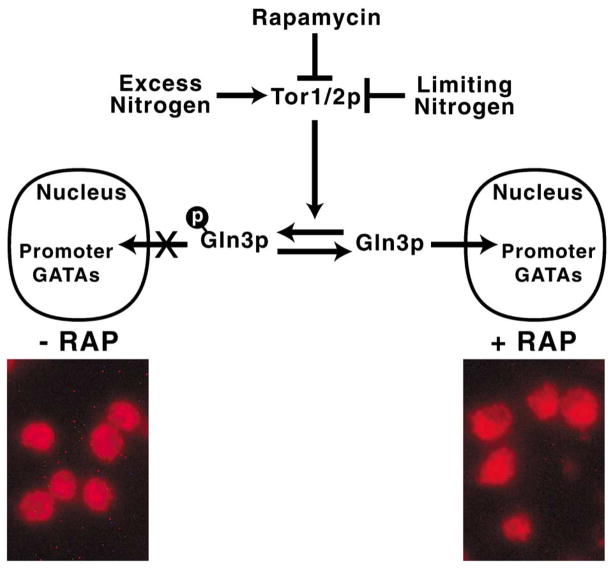
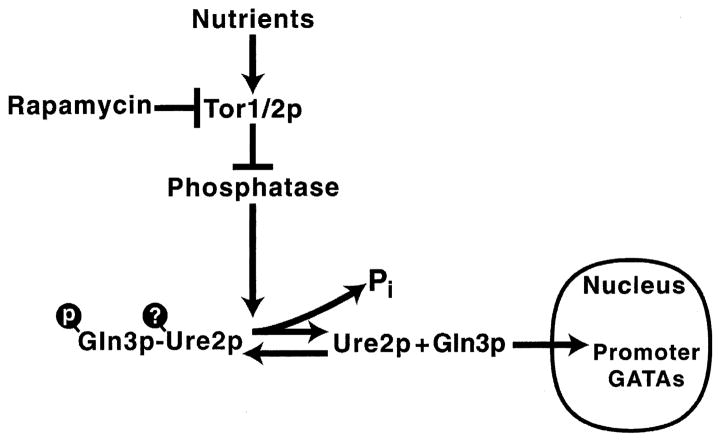
Not only does rapamycin induce NCR-sensitive gene expression, it also results in striking nuclear localization of Gln3 [18,27]. Gln3 localizes in the cytoplasm of cells provided with excess nitrogen, glutamine in the present case (Fig. 8). Rapamycin addition to these cultures results in nuclear localization of Gln3 (Fig. 8). Rapamycin addition also changes the rate of Gln3 electrophoretic migration; Gln3 migrates more rapidly in a manner very similar to that observed when the extract is treated with a protein phosphatase [18,27]. In some, but not all, laboratories, Ure2 migration behaves similarly, i.e. its migration increases upon treating cells with rapamycin, arguing it is dephosphorylated too [16–18]. These observations led to the proposal that excess nutrient availability positively regulates Tor1/2, which in turn promotes Gln3 (and Ure2) phosphorylation (Fig. 8) [16–18,27]. When Tor1/2 are inactivated by rapamycin, Gln3 phosphorylation is lost, or does not occur, which in turn results in its ability to access the nucleus and activate GATA-mediated transcription (Fig. 8) [16–18,27].
Fig. 8.
Myc-Gln3 localization in cells grown in the presence (+) or absence (−) of rapamycin. Bars and arrowheads indicate negative and positive regulation, respectively. X designates a process that no longer occurs in the presence of excess nitrogen but in the absence of rapamycin.
7. Nuclear transport of Gln3
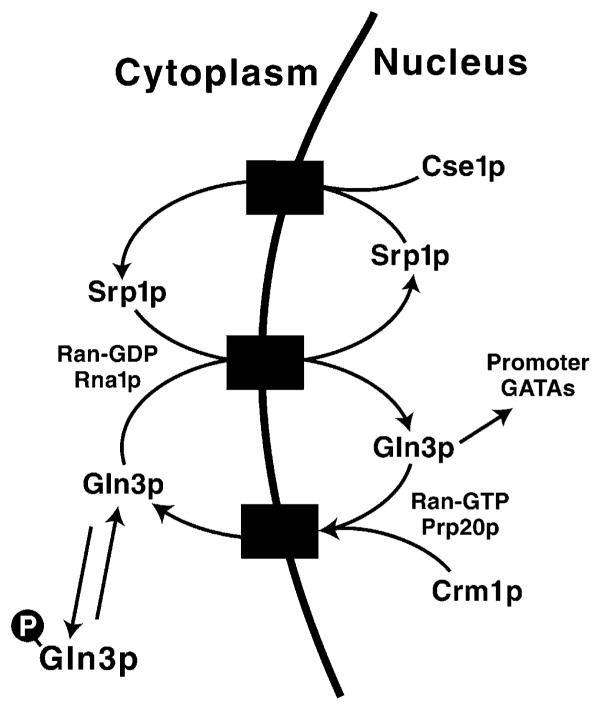
The next task is to begin fleshing out the regulatory skeleton shown in Fig. 8. Zheng et al. showed that Rna1 was required for nuclear localization of Gln3, along with the nuclear transport proteins, Srp1 and Cse1 [38]. The known functions of these proteins provide a reasonable picture of how Gln3 enters and leaves the nucleus (Fig. 9) [39]. According to the model, hypophosphorylated/dephosphorylated Gln3 interacts with Srp1, and the complex is transported to the nucleus. There, Gln3 binds to promoter GATA sequences and activates transcription while Srp1 is recycled back into the cytoplasm complexed with the protein Cse1. Alternatively, Gln3 can complex with Crm1 and exit the nucleus [38]. Recent work from several laboratories has demonstrated that directionality of the nuclear import/export process is dictated by the Ran protein in its GTP or GDP form. Maintenance of Ran-GTP within the nucleus requires Prp20, while Rna1 is required in the cytoplasm to maintain Ran in its GDP form (Fig. 9) [40,41]. The requirement of Rna1 for nuclear import of Gln3 fits nicely with earlier results from our laboratory showing that multiple NCR-sensitive genes could not be expressed in an rna1 mutant [42].
Fig. 9.
Model describing molecular interactions associated with Gln3 movement between the cytoplasm and nucleus of the cell. Redrawn from [38].
8. Gln3 structure and phosphorylation
If control of Gln3 function is a matter of regulating its access to the nucleus, a nuclear localization signal (NLS) ought to be identified and expected to play an important role in that regulation. The functional regions of Gln3 have been dissected by two groups (Fig. 10). Bertram et al. demonstrated, using a two-hybrid assay, that Tor1 and Tor2 interact with the 510–720 C-terminal fragment of Gln3 and concluded that the Tor1 and Tor2 proteins are responsible for Gln3 phosphorylation [18]. Using multiple assays, the Gln3 regions required for transcriptional activation, GATA-binding, nuclear localization, and Ure2-binding were localized in the N-terminal half of the molecule [43–45]. There is also a recent suggestion for an export signal adjacent to that for nuclear localization [38].
Fig. 10.

Domain map of the Gln3 molecule. Taken from [45].
The Gln3 NLS contains three serine residues, which represent potentially important targets for the putative phosphorylation that may control localization [45]. When alanine residues are substituted for each of the three serines, no marked deleterious influence on the nuclear entry of Gln3 was found (Fig. 11) [45]. To mimic the effects of phosphorylation, aspartate (a negatively charged amino acid) was substituted for the serines, because phosphorylation results in appearance of bulky negative charges in place of the serine hydroxyls. These substitutions significantly diminished nuclear localization of Gln3, a result that is consistent with, but does not in itself prove, that the NLS serines participate in the regulation of Gln3 localization (Fig. 11).
Fig. 11.
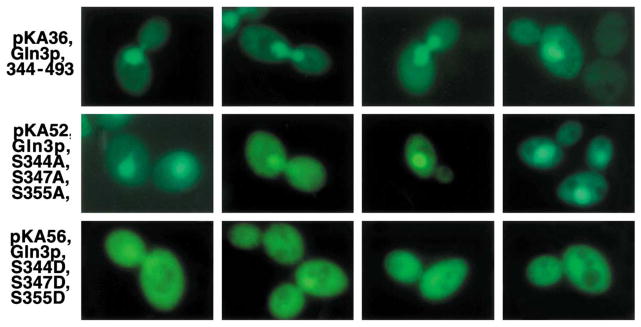
Intracellular distribution of wild-type (pKA36) and mutant GFP–Gln3 fragments. Taken from [45].
Multiple models have been proposed to explain the relationships between Torp, Gln3 phosphorylation, and regulation of Gln3 entry into the nucleus. All agree that: (i) Gln3 cellular localization correlates with its ability to activate GATA-mediated transcription. (ii) Ure2 forms a complex with Gln3. (iii) Rapamycin inhibition of Tor1/ 2p correlates with decreased levels of Gln3 phosphorylation, nuclear localization of Gln3p, and ‘induction’ of GATA-mediated transcriptional activation. Beyond this point, interpretations diverge and are not as rigorously, unambiguously, or universally supported by the data. Zheng’s model (Fig. 8) posits Tor1/2 phosphorylation of Gln3 is the direct determining factor regulating its localization; Ure2 association with Gln3 promotes phosphorylation or stabilizes Gln3-P [18]. Hall’s equally reasonable model (Fig. 12) posits Tor1/2 control phosphorylation, but do so by negatively regulating the phosphatase(s) responsible for Gln3-P dephosphorylation which in turn controls Gln3’s interaction with Ure2; here Ure2–Gln3 complex formation is responsible for nuclear exclusion [27]. Two further models are variants of those above: one by Heitman posits Torp to be a positive regulator of Ure2 [16] and another by Schreiber argues Torp is a negative regulator of the ‘phosphatases’ which in turn are negative regulators of Ure2 [17].
Fig. 12.
Model of the regulatory pathway by which rapamycin induces GATA factor-mediated transcription. Model most closely resembles that proposed by Hall [27].
Several kinase or kinase-related proteins, Tor1, Tor2, and Npr1p among them, affect expression of GATA factor-activated genes or their cognate products. Three observations suggest that Tor1/2 directly phosphorylate Gln3 [18]: (i) rapamycin inhibition of Tor1/2p decreases phosphorylation of Gln3, and in some cases, Ure2 brings about nuclear accumulation of Gln3p and ‘induces/derepresses’ GATA-mediated transcription [17,18,27]. (ii) Mutations inactivating the Torp kinase domain lead to the same results as rapamycin treatment [18]. (iii) Two-hybrid assays with Tor1p, or a HEAT repeat motif-containing fragment of Tor1p, yield positive interactions with Gln3p, Gat1p, and Ure2p; Tor2p is reported to bind similarly ([18], data not shown) (Fig. 13). An additional observation, however, may complicate this interpretation and raises questions. Tor1 and Tor2 associate with the plasma membrane and potentially with a vesicular fraction in the cell [46]. Moreover, it is the Tor2 HEAT repeats that mediate Tor2 localization to the cell membrane [46]. Therefore, we must ask: (i) can the HEAT repeats interact with cell membrane proteins, and Gln3 and Gat1? What is the specificity of the interaction between the HEAT repeats and the proteins with which they interact? (ii) Do Gln3 and Gat1 co-localize with Tor1 and Tor2 at the cell membrane? (iii) Do the membrane proteins, share areas of homology with Gln3 and Gat1? On balance, existing data are consistent with Tor1/2 phosphorylating Gln3, but so far the case is not compelling.
Fig. 13.

Domain map of Tor1.
9. PP2A-related phosphatases participate in Tor1/2 control of GATA factor-mediated transcription
To facilitate evaluation of the information about the phosphatase(s) responsible for Gln3 dephosphorylation a short overview of type 2A-related phosphatases follows. There are three members of the PP2A-related serine/threonine protein phosphatase family (Table 1): (i) PP2A, consisting of Pph21 and Pph22, (ii) Sit4, and (iii) Pph3, the newest member. PP2Ap participates in multiple cellular processes occurring late in the cell cycle, whereas Sit4 is required for those occurring early on, e.g. G1 cyclin expression or spindle pole body duplication [33–36,47–49]. The function of Pph3p is presently not known.
Table 1.
Type 2A-Related Phosphatases
| Catalytic Subunit | Associated Proteins | Required For |
|---|---|---|
| 1. PP2A=Pph21p Pph22p Most Phosphatase Activity |
Cdc55p Tpd3p | Cytoskeleton reorganization Bud morphogenesis G2→M progression |
| 2. Sit4p | Sap155p or Sap185p or Sap190p | G1-Execute start (G1 cyclin express. CLN1, CLN2, PCL1) Spindle pole body duplication DNA synthesis |
| 3. Pph3p | Sdf1p? | ? |
Each of these phosphatases associates with other proteins (Table 1). Functions of the PP2A-associated Cdc55 and Tpd3 will be briefly described later [47,48]. Although functions of the Sit4-associated Sap proteins are less clear, they associate with Sit4 in a cell cycle-dependent manner [49,50]. The function of Pph3p-associated Sdf1p is not known, but it interacts with Sap190, Ppg1, Pph21, Pph22, Sap3, Pph3, YOR380 and Ufe1 in high throughput two-hybrid assays [51,52].
At least two of the phosphatases (PP2A and Sit4) associate with an essential protein, Tap42, a well-documented component of the Tor1/2 signal transduction pathway [47]. Arndt’s laboratory [47] showed that (Fig. 14): (i) Sit4 and PP2A associate with Tap42 in the absence of their associated proteins. (ii) Crudely measured, there is five times more Pph21/22 than Sit4. (iii) Less than 5% of Sit4 and 2% each of Pph21 and Pph22 are stably associated with Tap42. (iv) Both nutrient growth signals and a functional Torsignaling pathway are required for Tap42–Sit4 and Tap42–PP2A complex formation, i.e. rapamycin dissociates both complexes and Tap42 is not associated with Sit4 in cells starved for nutrients. (v) Tap42 functions positively with both Sit4 and Pph21 (Fig. 14).
Fig. 14.

Model of the interactions of Tor, Tap42, and PP2A phosphatases. Redrawn from [47].
This last conclusion, that Tap42 functions positively in concert with Pph21/22 and Sit4 or is regulated by them, bears heavily on evaluating future models of Gln3 dephosphorylation and its regulation. Therefore, the data upon which it depends are discussed parenthetically here in somewhat more detail (Fig. 14). (i) Over-expression of TAP42 alone does not demonstrably affect growth, but does suppress the temperature-sensitive phenotype of pph21-102 and pph22-102 mutations. (ii) Over-expression of PPH21 alone produces a slow growth phenotype. (iii) Simultaneous over-expression of both TAP42 and PPH21 generates a synthetic phenotype, i.e. cells grow even more slowly than when PPH21 is over-expressed alone [47]. If Tap42 is hypothesized to decrease PP2A activity by complexing with it, then over-expressing TAP42 in a cell over-expressing PPH21 should at least partially repair the slow growth defect caused by over-expressing PPH21 alone. Since just the opposite occurs experimentally, the data argue that Tap42 is not acting as a negative regulator of Pph21p, but rather that Tap42 and Pph21p act together to produce an activity that neither possesses alone [47]. This reasoning argued against a negative role for Tap42 and led to the proposal of alternative models (Fig. 14) in which Tap42 acts positively, i.e. it complexes with a phosphatase subunit to form a specific phosphatase, or alternatively, Tap42 function is regulated by association with the phosphatases [47]. In short, if all of the participants are known, the data do not support Tap42 acting negatively.
The impact of this discussion derives from the parallels that exist between the Tap42–Pph21 and Tap42–Sit4 associations. Genetic experiments, like those just discussed for TAP42 and PPH21, were also conducted with TAP42 and SIT4. (i) Over-expression of TAP42 suppresses the temperature-sensitive phenotype of a sit4-102 mutation, just as noted above for pph21 and pph22 mutations. (ii) Over-expression of SIT4 alone produces a modestly slow growth phenotype, whereas cells over-expressing both TAP42 and SIT4 grow more slowly than when SIT4 is over-expressed alone [47]. These parallel outcomes lead a priori to the expectation that functional Tap42–Sit4 and Tap42–Pph21 associations are analogous.
Finally, when cells with the temperature-sensitive tap42-11 allele are shifted to the non-permissive temperature, they arrest with characteristics of cells entering early G1 or stationary phase. This is in contrast to what occurs when a similar temperature shift is carried out with sit4 and pph21 mutants which arrest in late G1 and G2, respectively.
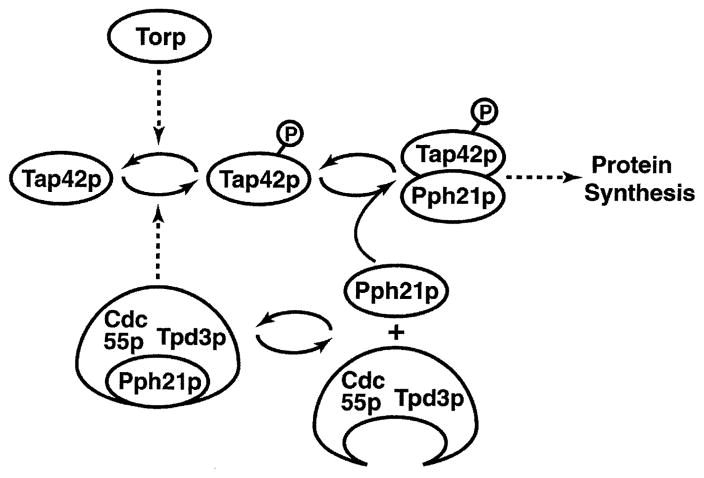
Building on Ardnt’s work, the Broach laboratory concluded (Fig. 15) [48]: (i) Tor proteins phosphorylate Tap42 in vivo and Tor2 does so in vitro. (ii) Tap42-P complexes with Pph21/22 to form the phosphatase complex responsible for Tor1/2-dependent promotion of protein synthesis. (iii) Cdc55 and Tpd3 inhibit Tap42 association with Pph21/22 and are posited to be responsible for recycling Tap42-P to its dephosphorylated form [48].
Fig. 15.
Model of the associations between Tor, Tap42, Pph21, Cdc55 and Tpd3. Pph21 and Pph22 interact similarly. Redrawn from [48].
Hall proposes that active Sit4 dephosphorylates Gln3-P (Fig. 16, left side). According to his model, in excess nutrients, Tor phosphorylates Tap42, which then complexes with Sit4, thereby inactivating it [27]. With limiting nutrients or rapamycin addition, Tor1/2 cease to function, Tap42 can no longer complex with Sit4, and as a result, Sit4 is free to dephosphorylate Gln3-P. At first blush, the model appears to fit the data rather well. However, several observations and predictions do not seem to fit comfortably: (i) Hall reports that Gln3-P dephosphorylation and nuclear localization following rapamycin addition do not occur in sit4 or tap42-11 mutants. There was, however, detectable nuclear concentration of Gln3 in two of the eight cell images presented [27]. Heitman, using Northern blots, reports that rapamycin treatment of the tap42-11 mutant still induces expression of GAP1 and MEP2 and represses expression of ribosomal protein gene RPS26 ([16], data not shown). However, those observations were not corroborated by genomic analyses ([16], data not shown). (ii) Tap42 complexes with Pph21/22 to form the active phosphatase responsible for promoting protein synthesis [49], whereas with Sit4, complex formation with Tap42 must inactivate the phosphatase activity for the Hall model to work [27]. This is at odds with Ardnt’s genetic conclusion that Tap42 positively regulates Pph21/ 22 and Sit4 function [47]. (iii) Arndt estimates less than 5% of Sit4 stably associates with Tap42 when cells are grown in rich medium. This, in Hall’s model, is the condition under which Sit4 would be expected to be completely complexed and inactive. Otherwise, the free Sit4 would de-phosphorylate Gln3-P, resulting in GATA-mediated gene expression in rich medium, which does not occur experimentally. (iv) Zheng reports rapamycin-induced GAP1 expression is partially dependent on Pph3p, and in the tap42-11 mutant depends upon the rapamycin concentration used in the assay. But this does not account for differences between Hall and Heitman ([18], data not shown), since they used the same concentration of rapamycin. In support of Hall’s proposals, Schreiber’s genomic data demonstrate Tap42 is required for rapamycin-induced nitrogen catabolic gene expression [53]. It is likely that some elements of all of the models proposed above will be found to operate. However, it is also clear that one cannot easily reconcile all of the existing observations at present, including unambiguous identification of the pertinent phosphatase(s).
Fig. 16.
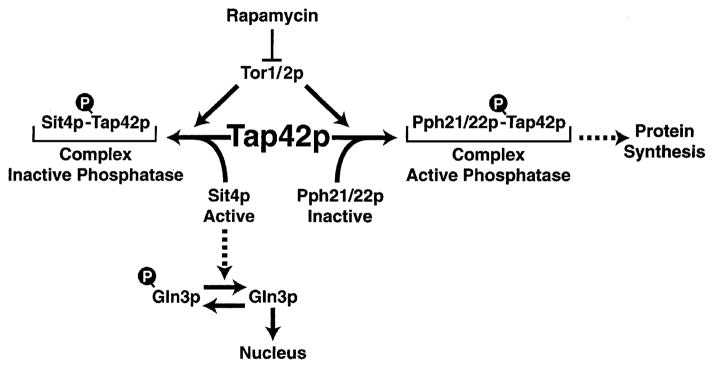
Models summarizing the operation of TAP42. The left side of the figure derives from the model of Hall [27], and the right side from that of Broach [48].
10. Ure2 function in the Tor protein regulatory pathway
This section considers the Ure2 function in nuclear localization of GATA factors. Although much more work has been done with Gln3 than with Gat1, there is evidence that some, but not all, characteristics of Gln3 and Gat1 regulation are similar. The Ure2 function in regulating Gln3 localization and ability of Gln3 to mediate transcription is also subject to more than one interpretation. First are the observations upon which all seem to agree: (i) Ure2 is a negative regulator of Gln3-mediated, NCR-sensitive gene expression. (ii) Ure2 forms a cytoplasmic complex with Gln3 and Gat1. (iii) Ure2 somehow (directly or indirectly) prevents nuclear entry of Gln3 and Gat1. Although not yet independently substantiated, the cytoplasmic localization of Ure2 derives from its lack of a functional NLS. If a heterologous NLS is fused to its N-terminus, Ure2 can enter the nucleus and bind to Gln3 [45]. The Gln3–Ure2 complex retains its ability to activate transcription. Divergence of interpretation centers on the identity of the direct causative event preventing Gln3 from entering the nucleus. On one hand, phosphorylation is argued to be the direct determinant [18]. By this model, Ure2 facilitates phosphorylation of Gln3 and Gat1 or stabilizes the phosphorylated forms of these proteins. It is these phosphorylated forms of the proteins that cannot be transported into the nucleus. On the other hand, Gln3–Ure2 and Gat1–Ure2 complex formation is argued to be the primary determinant [27]. By this model, phosphorylation facilitates Ure2–Gln3 complex formation, and it is the complex that cannot be transported into the nucleus.
Several observations are consistent with each model. Supporting phosphorylation as the direct determinant are the observations: (i) GST–Ure2 binds to both hyperphosphorylated and phosphatase-treated Gln3, or Gln3 derived from rapamycin-treated cells [18]. (ii) Tor1 interacts with Gln3 in the absence of Ure2, but Tor1 interacts with Ure2 only when Gln3 was present leading to the conclusion that Gln3 mediates the association of Tor1 and Ure2 [18]. (iii) Ure2-bound Gln3 is more resistant than free Gln3 to phosphatase treatment in vitro [18]. (iv) The expression of multiple genes remains NCR-sensitive in ure2Δ [28,54,55]. Consistent with complex formation being the direct determinant are: (i) deletion of URE2 generates a very strong phenotype for many genes, i.e. their expression becomes much less sensitive to NCR [28,54,55]. (ii) Gln3 localizes to the nucleus in a ure2 mutant growing in nitrogen-rich medium in the absence of rapamycin. (iii) The amount of Gln3 isolated as a GST– Ure2–Gln3 complex decreases with time following treatment of the cells with rapamycin [27].
There is, however, a third alternative, i.e. both mechanisms may well be physiologically relevant. Supporting this view are data in Fig. 17. In the left panel of the figure are two Northern blots measuring steady state DAL5 expression in cells provided with proline (PRO) or glutamine (GLN) as sole nitrogen source. The left Northern blot measured expression in a ure2Δgln3Δ strain, while a ure2Δgat1Δ strain was used in the right one. NCR-sensitive expression was clearly observed in both cases in the absence of Ure2 [54,55]. Although only a single gene has been presented here, this occurs with multiple genes [54,55]. Moreover, NCR-sensitive DUR3, UGA1 and UGA4 expression does not exhibit the NCR-resistant ure2Δ phenotype with asparagine as the repressing nitrogen source [54]. It was this observation that first suggested to us that components beyond Gln3 and Ure2 were involved in GATA-mediated, NCR-sensitive gene expression [28,54–56]. These data assert that NCR-sensitive gene expression occurs in the absence of Ure2 and hence Ure2– Gln3 and Ure2–Gat1 complex formation, or alternatively, that there is at least one other unknown protein that is functionally redundant with Ure2 [55]. In the right panel of Fig. 17 is the cellular distribution of a GFP–Gln31–487 truncation protein. This mutant protein completely lacks residues 510–730, which is the region that interacts with Tor1 in a two-hybrid assay [45]. The Ure2 interaction region of the protein, however, remains in this fragment and is functional [45]. GFP–Gln31–487 is clearly excluded from the nucleus. Therefore, either Gln3 can be phosphorylated without Tor1 associating with the 510–730 region of Gln3 or nuclear exclusion can occur in the absence of phosphorylation. A third observation is also pertinent here. Over-expression of URE2 results in nuclear exclusion of Gln3 and Gat1 as well as loss of NCR-sensitive gene expression in the absence of a cellular signal indicating that nitrogen is in excess, i.e. this occurs with proline as nitrogen source [12,29,45]. Therefore, either Gln3 can be phosphorylated without the cellular signal to the Tor1/2 signal transduction pathway, or it is not required for nuclear exclusion of Gln3 in the presence of excess Ure2. The data in toto most favor the third possibility with the likelihood that the relative contributions of each mechanism will generate quantitative gene-specific expression differences and responses to Ure2.
Fig. 17.
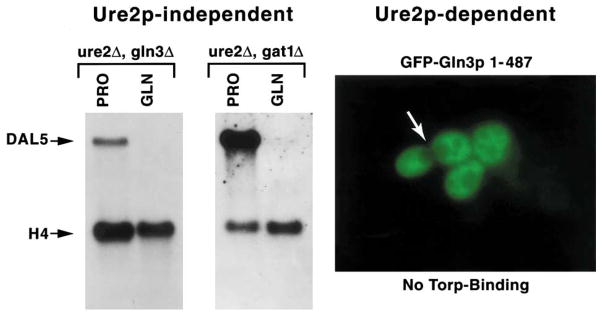
Northern blot analyses of DAL5 expression in double mutants provided with proline (PRO) or glutamine (GLN) as sole nitrogen source. Nuclear exclusion of GFP–Gln3 fragment 1–487 lacking the Tor1-binding domain. Modified from [45,55].
11. Mks1, a newcomer to nitrogen regulation
Mks1 is a recent addition to the regulatory network controlling GATA-mediated gene expression associated with nitrogen. Mks1 (multicopy compensator of A kinase suppression) mutations have been independently isolated on three separate occasions. The first mks1 mutant was isolated by Matsuura and Anraku in their attempt to identify genes whose products functioned downstream of the Ras–cAMP pathway and protein kinase A [57]. The authors suggested that Mks1 acts either downstream of protein A kinase or in a parallel pathway, and is a negative regulator of the Ras–cAMP pathway.
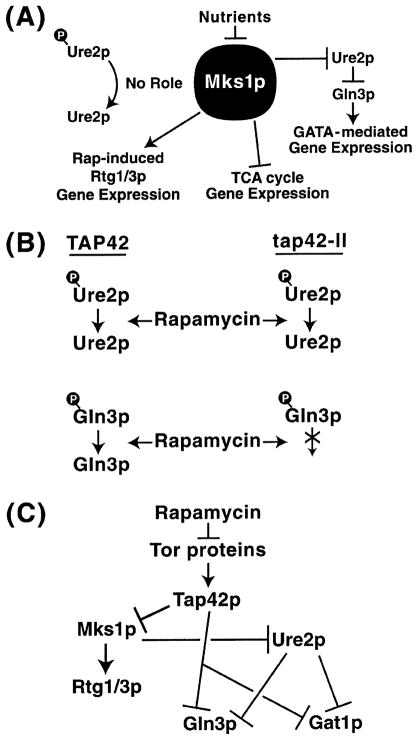
MKS1 received no further attention until it was found to be identical to LYS80 [58]. Lys80 was at first thought to be a repressor of LYS gene expression [59]. However, careful physiological studies demonstrated that increased lysine production occurring in a lys80 mutant derives from an expanded pool of α-ketoglutarate, and measurable increases in several TCA cycle enzymes [58]. These observations led to the conclusion that Mks1 down-regulates TCA cycle gene expression (Fig. 18A).
Fig. 18.
A: Molecular events in which Mks1 is reported to participate. B: Response of Ure2 and Gln3 dephosphorylation in wild-type and tap42-11 mutant strains. C: Model of Mks1-mediated regulation proposed by Schreiber [53]. Redrawn from [53].
Shortly thereafter, MKS1 was identified as a high-copy suppressor of the NCR sensitivity of USA uptake [60]. As mentioned before USA uptake is possible with proline as sole nitrogen source but not with ammonium [20,21]. Therefore, USA can fulfill the auxotrophic requirement of ura2 mutants only in the first situation. A ura2 transformant, containing the 3′ half of MKS1 (from nucleotide 649 to the end of the gene), was selected based on its ability to grow with USA with ammonia as nitrogen source [60]. Deletion analyses demonstrated that only Mks1 amino acids M245–T347 are required for this function. Moreover, this short peptide causes slow growth of a wild-type strain provided with ammonia as nitrogen source [60]. Since ure2 mutations are epistatic to mks1 mutations, it was concluded that Mks1 is situated above Ure2 in the NCR regulon [60]. As expected from these characteristics, β-galactosidase production from a DAL5-lacZ construct is diminished over 70-fold in a mks1 mutant, leading to the suggestion that Mks1 is a negative regulator of Ure2 and hence a positive regulator of Gln3, DAL5 and NCR-sensitive gene expression, i.e. NH3⊣Mks1⊣Ure2⊣Gln3→DAL5 (Fig. 18A) [60]. Very recently, Schreiber’s genomic analyses have led to the conclusion that Mks1 is a positive regulator of rapamycin-induced Gln3-dependent, but not Gat1-dependent, and Rtg1/3-mediated retrograde gene expression. The Schreiber model appears in Fig. 18C [53]. These authors also concluded that Tap42 was a negative regulator of Mks1, Tap42 in turn being positively regulated by Tor1/2 [53]. By this scheme, rapamycin addition was expected to induce retrograde gene expression, as previously shown by Power’s laboratory [61].
As Mks1 is more fully characterized, emerging data raise questions of whether our current understanding of Mks1 and its role(s) in Tor1/2 signal transduction are in need of revision. Several observations in particular stand out. (i) Mks1 is reported to be a negative regulator of Ure2 function, but it does not play a role in Ure2 dephosphorylation, i.e. Ure2 dephosphorylation occurs normally in an mks1 mutant [53]. (ii) Only a small portion from the middle of the Mks1 is required for the ammonia repression bypass and slow growth on ammonia phenotypes [60]. (iii) Tap42 has been shown to be phosphorylated by Tor1/2 [48], and a mutant allele, tap42-11, has been isolated in which Tap42 has lost its ability to respond to rapamycin addition (Fig. 18B). As a result, processes downstream of Tap42 lose their rapamycin responsiveness as well. For example, treating cells with rapamycin results in dephosphorylation of Gln3, which does not occur in a tap42-11 mutant [27]. Surprisingly, however, rapamycin-induced Ure2 dephosphorylation occurs normally in the tap42-11 mutant [53]. At face value, this would argue that dephosphorylation of Ure2 and Gln3 is accomplished or regulated in different ways, which is not the view expressed in currently accepted models of the regulatory pathway.
12. Conclusions and perspectives
The past 2 years have seen enormous advances in our understanding of the molecular events through which GATA family transcription factors are regulated in S. cerevisiae. We have gained a reasonably comprehensive view of the transcription proximal portions of the signal transduction pathway by which the environmental signal of nitrogen excess or limitation is transmitted to the level of an NCR-sensitive gene promoter. The demonstration of rapamycin-induced expression of NCR-sensitive genes has also identified a very important participant in the upper portion of the pathway. At the same time, it is clear that much remains to be done before there is a coherent and comprehensive explanation of the mechanisms that account for all of the observations reported. The function of Mks1, control of retrograde gene expression, and identification of components of the signal transduction pathway that likely account for many of the present inconsistencies are certain to be areas of important future progress. The entry of so many high quality laboratories into the field, however, bodes well for it and forecasts that a satisfying explanation of the pertinent mechanisms will be achieved sooner rather than later.
Acknowledgments
I thank Tim Higgins for preparing the artwork, and the UT Yeast Group, Dr. Martha Howe, Dr. Juana Maria Gancedo and Dr. Carlos Gancedo for suggestions to improve the manuscript. This work was supported by NIH Grant GM-35642.
References
- 1.Hoffman-Bang J. Nitrogen catabolite repression in Saccharomyces cerevisiae. Mol Biotechnol. 1999;12:35–73. doi: 10.1385/MB:12:1:35. [DOI] [PubMed] [Google Scholar]
- 2.ter Schure EG, van Riel NA, Verrips CT. The role of ammonia metabolism in nitrogen catabolite repression in Saccharomyces cerevisiae. FEMS Microbiol Rev. 2000;24:67–83. doi: 10.1111/j.1574-6976.2000.tb00533.x. [DOI] [PubMed] [Google Scholar]
- 3.Cooper TG. Allantoin degradative system – an integrated transcriptional response to multiple signals. In: Marzluf G, Bambrl R, editors. Mycota III. Springer Verlag; Berlin: 1996. pp. 139–169. [Google Scholar]
- 4.Omichinski JG, Close GM, Schaad O, Felsenfeld G, Trainor C, Appella E, Stahl SJ, Gronenborn AM. NMR structure of a specific DNA complex of Zn-containing DNA binding domain of GATA-1. Science. 1993;261:438–446. doi: 10.1126/science.8332909. [DOI] [PubMed] [Google Scholar]
- 5.Bysani N, Daugherty JR, Cooper TG. Saturation mutagenesis of the UASNTR (GATAA) responsible for nitrogen catabolite repression-sensitive transcriptional activation of the allantoin pathway genes in Saccharomyces cerevisiae. J Bacteriol. 1991;173:4977– 4982. doi: 10.1128/jb.173.16.4977-4982.1991. [DOI] [PMC free article] [PubMed] [Google Scholar]
- 6.van Vuuren HJJ, Daugherty JR, Rai R, Cooper TG. Upstream induction sequence, the cis-acting element required for response to the allantoin pathway inducer and enhancement of operation of the nitrogen-regulated upstream activation sequence in Saccharomyces cerevisiae. J Bacteriol. 1991;173:7186–7195. doi: 10.1128/jb.173.22.7186-7195.1991. [DOI] [PMC free article] [PubMed] [Google Scholar]
- 7.Cunningham TS, Dorrington RA, Cooper TG. The UGA4 UASNTR site required for GLN3-dependent transcriptional activation also mediates DAL80-responsive regulation and DAL80 protein binding in Saccharomyces cerevisiae. J Bacteriol. 1994;176:4718–4725. doi: 10.1128/jb.176.15.4718-4725.1994. [DOI] [PMC free article] [PubMed] [Google Scholar]
- 8.Svetlov VV, Cooper TG. The Saccharomyces cerevisiae GATA factors Dal80 and Deh1 can form homo- and heterodimeric complexes. J Bacteriol. 1998;180:5682–5688. doi: 10.1128/jb.180.21.5682-5688.1998. [DOI] [PMC free article] [PubMed] [Google Scholar]
- 9.Cunningham TS, Cooper TG. The Saccharomyces cerevisiae DAL80 repressor protein binds to multiple copies of GA-TAA-containing sequences. J Bacteriol. 1993;175:5851–5861. doi: 10.1128/jb.175.18.5851-5861.1993. [DOI] [PMC free article] [PubMed] [Google Scholar]
- 10.Daugherty JR, Rai R, ElBerry HM, Cooper TG. Regulatory circuit for responses of nitrogen catabolic gene expression to the GLN3 and DAL80 proteins and nitrogen catabolite repression in Saccharomyces cerevisiae. J Bacteriol. 1993;175:64–73. doi: 10.1128/jb.175.1.64-73.1993. [DOI] [PMC free article] [PubMed] [Google Scholar]
- 11.Coffman JA, Rai R, Loprete D, Cunningham T, Svetlov V, Cooper TG. Cross regulation of four GATA factors that control nitrogen catabolic gene expression in Saccharomyces cerevisiae. J Bacteriol. 1997;179:3416–3429. doi: 10.1128/jb.179.11.3416-3429.1997. [DOI] [PMC free article] [PubMed] [Google Scholar]
- 12.Cunningham TS, Andhare R, Cooper TG. Nitrogen catabolite repression of DAL80 expression depends on the relative levels of Gat1 and Ure2 production in Saccharomyces cerevisiae. J Biol Chem. 2000;275:14408–14414. doi: 10.1074/jbc.275.19.14408. [DOI] [PMC free article] [PubMed] [Google Scholar]
- 13.Cunningham TS, Rai R, Cooper TG. The level of DAL80 expression down-regulates GATA factor-mediated transcription in Saccharomyces cerevisiae. J Bacteriol. 2000;182:6584–6591. doi: 10.1128/jb.182.23.6584-6591.2000. [DOI] [PMC free article] [PubMed] [Google Scholar]
- 14.Coffman JA, Cooper TG. Nitrogen GATA-factors participate in transcriptional regulation of vacuolar protease genes in Saccharomyces cerevisiae. J Bacteriol. 1997;179:5609–5613. doi: 10.1128/jb.179.17.5609-5613.1997. [DOI] [PMC free article] [PubMed] [Google Scholar]
- 15.Cox K, Pinchak AB, Cooper TG. Genome-wide transcriptional analysis in S. cerevisiae by Mini-array membrane hybridization. Yeast. 1999;15:703–713. doi: 10.1002/(SICI)1097-0061(19990615)15:8<703::AID-YEA413>3.0.CO;2-Z. [DOI] [PubMed] [Google Scholar]
- 16.Cardenas ME, Cutler NS, Lorenz MC, Di Como CJ, Heitman J. The TOR signaling cascade regulates gene expression in response to nutrients. Genes Dev. 1999;13:3271–3279. doi: 10.1101/gad.13.24.3271. [DOI] [PMC free article] [PubMed] [Google Scholar]
- 17.Hardwick JS, Kuruvilla FG, Tong JF, Shamji AF, Schreiber SL. Rapamycin-modulated transcription defines the subset of nutrient-sensitive signaling pathways directly controlled by the Tor proteins. Proc Natl Acad Sci USA. 1999;96:14866–14870. doi: 10.1073/pnas.96.26.14866. [DOI] [PMC free article] [PubMed] [Google Scholar]
- 18.Bertram PG, Choi JH, Carvalho J, Ai W, Zeng C, Chan TF, Zheng XFS. Tripartite regulation of Gln3 by TOR, Ure2, and phosphatases. J Biol Chem. 2000;275:35727–35733. doi: 10.1074/jbc.M004235200. [DOI] [PubMed] [Google Scholar]
- 19.Lacroute F. Regulation of pyrimidine biosynthesis in Saccharomyces cerevisiae. J Bacteriol. 1968;95:824–832. doi: 10.1128/jb.95.3.824-832.1968. [DOI] [PMC free article] [PubMed] [Google Scholar]
- 20.Drillien R, Lacroute F. Ureidosuccinic acid uptake in yeast and some aspects of its regulation. J Bacteriol. 1972;109:203–208. doi: 10.1128/jb.109.1.203-208.1972. [DOI] [PMC free article] [PubMed] [Google Scholar]
- 21.Drillen RM, Aigle M, Lacroute F. Yeast mutants pleiotropically impaired in the regulation of two glutamate dehydrogenases. Biochem Biophys Res Commun. 1973;53:367–372. doi: 10.1016/0006-291x(73)90671-2. [DOI] [PubMed] [Google Scholar]
- 22.Grenson M, Dubois E, Piotrowska M. Ammonia assimilation in Saccharomyces cerevisiae as mediated by the two glutamate dehydrogenases. Mol Gen Genet. 1974;128:73–85. doi: 10.1007/BF00267295. [DOI] [PubMed] [Google Scholar]
- 23.Turoscy V, Cooper TG. Ureidosuccinate is transported by the allantoate transport system in Saccharomyces cerevisiae. J Bacteriol. 1987;169:2598–2600. doi: 10.1128/jb.169.6.2598-2600.1987. [DOI] [PMC free article] [PubMed] [Google Scholar]
- 24.Courchesne WE, Magasanik B. Regulation of nitrogen assimilation in Saccharomyces cerevisiae: roles of the URE2 and GLN3 genes. J Bacteriol. 1988;170:708–713. doi: 10.1128/jb.170.2.708-713.1988. [DOI] [PMC free article] [PubMed] [Google Scholar]
- 25.Coshigano PW, Magasanik B. The URE2 gene product of Saccharomyces cerevisiae plays an important role in the cellular response to the nitrogen source and has homology to glutathione S-transferases. Mol Cell Biol. 1991;11:822–832. doi: 10.1128/mcb.11.2.822. [DOI] [PMC free article] [PubMed] [Google Scholar]
- 26.Blinder D, Coschigano PW, Magasanik B. Interaction of the GATA factor Gln3 with the nitrogen regulator Ure2 in Saccharomyces cerevisiae. J Bacteriol. 1996;178:4734–4736. doi: 10.1128/jb.178.15.4734-4736.1996. [DOI] [PMC free article] [PubMed] [Google Scholar]
- 27.Beck T, Hall MN. The TOR signaling pathway controls nuclear localization of nutrient-regulated transcription factors. Nature. 1999;402:689–692. doi: 10.1038/45287. [DOI] [PubMed] [Google Scholar]
- 28.Coffman JA, Rai R, Cooper TG. Genetic evidence for Gln3-independent, nitrogen catabolite repression-sensitive gene expression in Saccharomyces cerevisiae. J Bacteriol. 1995;177:6910–6918. doi: 10.1128/jb.177.23.6910-6918.1995. [DOI] [PMC free article] [PubMed] [Google Scholar]
- 29.Cox KH, Rai R, Distler M, Daugherty JR, Coffman JA, Cooper TG. GATA sequences function as TATA elements during nitrogen catabolite repression and when Gln3 is excluded from the nucleus by overproduction of Ure2. J Biol Chem. 2000;275:17611. doi: 10.1074/jbc.M001648200. [DOI] [PMC free article] [PubMed] [Google Scholar]
- 30.Chen W, Struhl K. Saturation mutagenesis of a yeast his3 ‘TATA element’: genetic evidence for a specific TATA-binding protein. Proc Natl Acad Sci USA. 1988;85:2691–2695. doi: 10.1073/pnas.85.8.2691. [DOI] [PMC free article] [PubMed] [Google Scholar]
- 31.Fong TC, Emerson BM. The erythroid-specific protein cGATA-1 mediates distal enhancer activity through a specialized beta-globin TATA box. Genes Dev. 1992;6:521. doi: 10.1101/gad.6.4.521. [DOI] [PubMed] [Google Scholar]
- 32.Heitman J, Movva NR, Hall MN. Targets for cell cycle arrest by the immunosuppressant rapamycin in yeast. Science. 1991;253:905–909. doi: 10.1126/science.1715094. [DOI] [PubMed] [Google Scholar]
- 33.Zheng XF, Florentino D, Chen J, Crabtree GR, Schreiber SL. TOR kinase domains are required for two distinct functions, only one of which is inhibited by rapamycin. Cell. 1995;82:121–130. doi: 10.1016/0092-8674(95)90058-6. [DOI] [PubMed] [Google Scholar]
- 34.Barbet NC, Schneider U, Helliwell SB, Stansfield I, Tuite MF, Hall MN. TOR controls translation initiation and early G1 progression in yeast. Mol Biol Cell. 1996;7:25–42. doi: 10.1091/mbc.7.1.25. [DOI] [PMC free article] [PubMed] [Google Scholar]
- 35.Dennis PB, Fumagalli S, Thomas G. Target of rapamycin (TOR): balancing the opposing forces of protein synthesis and degradation. Curr Opin Genet Dev. 1999;9:49–54. doi: 10.1016/s0959-437x(99)80007-0. [DOI] [PubMed] [Google Scholar]
- 36.Schmelzle T, Hall MN. TOR, a central controller of cell growth. Cell. 2000;103:253–262. doi: 10.1016/s0092-8674(00)00117-3. [DOI] [PubMed] [Google Scholar]
- 37.Rohde J, Heitman J, Cardenas ME. The TOR kinases link nutrient sensing to cell growth. J Biol Chem. 2001;276:9583–9586. doi: 10.1074/jbc.R000034200. [DOI] [PubMed] [Google Scholar]
- 38.Carvalho J, Bertram PG, Wente SR, Zheng XFS. Phosphorylation regulates the interaction between Gln3 and the nuclear import factor Srp1p. J Biol Chem. 2001;276:25359–25365. doi: 10.1074/jbc.M103050200. [DOI] [PubMed] [Google Scholar]
- 39.Gorlich D, Kutay U. Transport between the cell nucleus and the cytoplasm. Annu Rev Cell Dev Biol. 1999;15:607–660. doi: 10.1146/annurev.cellbio.15.1.607. [DOI] [PubMed] [Google Scholar]
- 40.Corbett AH, Silver PA. Nucleocytoplasmic transport of macromolecules. Microbiol Mol Biol Rev. 1997;61:193–211. doi: 10.1128/mmbr.61.2.193-211.1997. [DOI] [PMC free article] [PubMed] [Google Scholar]
- 41.Mattaj IW, Englmeier L. Nucleocytoplasmic transport: the soluble phase. Annu Rev Biochem. 1998;67:265–306. doi: 10.1146/annurev.biochem.67.1.265. [DOI] [PubMed] [Google Scholar]
- 42.Bossinger J, Cooper TG. Sequence of molecular events involved in induction of allophanate hydrolase. J Bacteriol. 1976;126:198–204. doi: 10.1128/jb.126.1.198-204.1976. [DOI] [PMC free article] [PubMed] [Google Scholar]
- 43.Cunningham TS, Svetlov VV, Rai R, Smart W, Cooper TG. Gln3 is capable of binding to UASNTR elements and activating transcription in Saccharomyces cerevisiae. J Bacteriol. 1996;178:3470–3479. doi: 10.1128/jb.178.12.3470-3479.1996. [DOI] [PMC free article] [PubMed] [Google Scholar]
- 44.Svetlov V, Cooper TG. The minimal transactivation region of Saccharomyces cerevisiae Gln3 is localized to 13 amino acids. J Bacteriol. 1997;179:7644–7652. doi: 10.1128/jb.179.24.7644-7652.1997. [DOI] [PMC free article] [PubMed] [Google Scholar]
- 45.Kulkarni AA, Abul-Hamd AT, Rai R, El Berry H, Cooper TG. Gln3 nuclear localization and interaction with Ure2 Saccharomyces cerevisiae. J Biol Chem. 2001;276:32136–32144. doi: 10.1074/jbc.M104580200. [DOI] [PMC free article] [PubMed] [Google Scholar]
- 46.Kunz J, Schneider U, Howald I, Schmidt A, Hall MN. HEAT repeats mediate plasma membrane localization of Tor2 in yeast. J Biol Chem. 2000;275:37011–37020. doi: 10.1074/jbc.M007296200. [DOI] [PubMed] [Google Scholar]
- 47.Di Como CJ, Arndt KT. Nutrients, via the Tor proteins, stimulate the association of Tap42 with type 2A phosphatases. Genes Dev. 1996;10:1904–1916. doi: 10.1101/gad.10.15.1904. [DOI] [PubMed] [Google Scholar]
- 48.Jiang Y, Broach JR. Tor proteins and protein phosphatase 2A reciprocally regulate Tap42 in controlling cell growth in yeast. EMBO J. 1999;18:2782–2792. doi: 10.1093/emboj/18.10.2782. [DOI] [PMC free article] [PubMed] [Google Scholar]
- 49.Sutton A, Immanuel D, Arndt KT. The Sit4 protein phosphatase functions in late G1 for progression into S phase. Mol Cell Biol. 1991;11:2133–2148. doi: 10.1128/mcb.11.4.2133. [DOI] [PMC free article] [PubMed] [Google Scholar]
- 50.Luke MM, Seta FD, Di Como CJ, Kobayashi R, Arndt KT. The SAPs, a new family of proteins, associate and function positively with SIT4 phosphatase. Mol Cell Biol. 1996;16:2744– 2755. doi: 10.1128/mcb.16.6.2744. [DOI] [PMC free article] [PubMed] [Google Scholar]
- 51.Ito T, Chiba T, Ozawa R, Yoshida M, Hottori M, Sakaki Y. A comprehensive two-hybrid analysis to explore the yeast protein interactome. Proc Natl Acad Sci USA. 2001;98:4277–4278. doi: 10.1073/pnas.061034498. [DOI] [PMC free article] [PubMed] [Google Scholar]
- 52.Uetz P, Giot L, Cagney G, Mansfield TA, Judson RS, Knight JR, Lockshon D, Narayan V, Srinivasan M, Pochart P, Qureshi-Emili A, Li Y, Godwin B, Conover D, Kalbfleisch T, Vijayadamodar G, Yang M, Johnston M, Fields S, Rothberg JM. A comprehensive analysis of protein–protein interactions in Saccharomyces cerevisiae. Nature. 2000;403:623–627. doi: 10.1038/35001009. [DOI] [PubMed] [Google Scholar]
- 53.Shamji AF, Kuruvilla FG, Schreiber SL. Partitioning the transcriptional program induced by rapamycin among the effectors of the Tor proteins. Curr Biol. 2000;10:1574–1581. doi: 10.1016/s0960-9822(00)00866-6. [DOI] [PubMed] [Google Scholar]
- 54.Coffman JA, El Berry HM, Cooper TG. URE2 protein regulates nitrogen catabolic gene expression through the GA-TAA-containing UASNTR element in Saccharomyces cerevisiae. J Bacteriol. 1994;176:7476. doi: 10.1128/jb.176.24.7476-7483.1994. [DOI] [PMC free article] [PubMed] [Google Scholar]
- 55.Coffman JA, Rai R, Cunningham T, Svetlov V, Cooper TG. Gat1, a GATA family protein whose production is sensitive to nitrogen catabolite repression, participates in transcriptional activation of nitrogen-catabolic genes in Saccharomyces cerevisiae. Mol Cell Biol. 1996;16:847–858. doi: 10.1128/mcb.16.3.847. [DOI] [PMC free article] [PubMed] [Google Scholar]
- 56.Stanbrough M, Rowen DW, Magasanik B. Role of the GATA factors Gln3 and Nil1p of Saccharomyces cerevisiae in the expression of nitrogen-regulated genes. Proc Natl Acad Sci USA. 1995;92:9450–9454. doi: 10.1073/pnas.92.21.9450. [DOI] [PMC free article] [PubMed] [Google Scholar]
- 57.Matsuura A, Anraku Y. Characterization of the MKS1 gene, a new negative regulator of the RAS-cyclic AMP pathway in Saccharomyces cerevisiae. Mol Gen Genet. 1993;238:6–16. doi: 10.1007/BF00279524. [DOI] [PubMed] [Google Scholar]
- 58.Feller A, Ramos F, Pierard A, Dujbois E. Lys80p of Saccharomyces cerevisiae, previously proposed as a specific repressor of LYS genes, is a pleiotropic regulatory factor identical to Mks1. Yeast. 1997;13:1337–1346. doi: 10.1002/(SICI)1097-0061(199711)13:14<1337::AID-YEA186>3.0.CO;2-O. [DOI] [PubMed] [Google Scholar]
- 59.Ramos F, Wiame JM. Mutation affecting the specific regulatory control of lysine biosynthetic enzymes in Saccharomyces cerevisiae. Mol Gen Genet. 1985;200:291–294. doi: 10.1007/BF00425438. [DOI] [PubMed] [Google Scholar]
- 60.Edskes HK, Hanover JA, Wickner RB. Mkslp is a regulator of nitrogen catabolism upstream of Ure2 in Saccharomyces cerevisiae. Genetics. 1999;153:585–594. doi: 10.1093/genetics/153.2.585. [DOI] [PMC free article] [PubMed] [Google Scholar]
- 61.Komeili A, Wedaman KP, O’Shea EK, Powers T. Mechanism of metabolic control: target of rapamycin signaling links nitrogen quality to the activity of the Rtg1 and Rtg3 transcription factors. J Cell Biol. 2000;151:863–878. doi: 10.1083/jcb.151.4.863. [DOI] [PMC free article] [PubMed] [Google Scholar]


