Abstract
Hydrogen sulfide (H2S) has emerged as an important biological signaling molecule. To better understand the multifaceted biological roles of H2S, the development of selective and sensitive biocompatible assays for H2S is becoming increasingly important. Motivated by these challenges, our laboratory is developing new methods to further detect and monitor biological H2S. Here, we describe in detail our recent advances in the development and the use of chemiluminescence-based H2S sensors to assist other investigators with use of these chemical tools. We highlight the use of these tools use by displaying their selectivity and high sensitivity toward H2S and provide examples of assays we have developed to detect enzymatically produced H2S.
1. INTRODUCTION
Small-molecule reactive sulfur compounds are a recently discovered class of biological signaling molecules that play diverse roles in pathological and physiological processes. Chief among these species is hydrogen sulfide (H2S), which has rapidly been linked to a myriad of diverse biological roles (Wallace, Dicay, McKnight, & Martin, 2007; Wang, 2009, 2012; Whiteman & Moore, 2009) since its initial report as a mediator of hippocampal long-term potentiation (Abe & Kimura, 1996). H2S is produced primarily by three enzymes in mammals: cystathionine-γ-lyase (CSE), cystathionine-β-synthase (CBS), and 3-mercaptopyruvate sulfurtransferase (3-MST) (Wang, 2012). In addition to these primary pathways, H2S genesis from d-Cys, catalyzed by d-amino acid oxidase and 3MST (Shibuya et al., 2013), as well as nonenzymatic processes are also possible. Based on the varied expression of these enzymes throughout different organs, it is clear that H2S is involved in important processes throughout the cardiovascular, circulatory, respiratory, urinary, and nervous systems (Wang, 2012). This widespread importance is supported by studies linking misregulation of H2S producing enzymes with disease phenotypes such as hypertension (Yang et al., 2008), diabetes (Wu et al., 2009), and various conditions of mental deficiency including Down’s syndrome (Chen, Xin, & Zhu, 2007) and Alzheimer’s disease (Qu, Lee, Bian, Low, & Wong, 2008). Such reports have motivated significant interest in developing H2S-derived therapeutics (Chan & Wallace, 2013; Sparatore, Santus, Giustarini, Rossi, & Del Soldato, 2011; Szabó, 2007). Broadening the scope of this important small molecule, H2S has also been shown to interact with cellular targets such as biological electrophiles (Nishida et al., 2012), heme proteins (Pietri, Roman-Morales, & Lopez-Garriga, 2011), cysteine residues in KATP channels (Jiang, Tang, Cao, Wu, & Wang, 2010), and reactive nitrogen species (Cortese-Krott et al., 2014; Filipovic et al., 2012).
To increase our understanding of the importance and differential roles of biological H2S, an expanded toolbox of available methods to monitor H2S is needed because it is unlikely that one specific method will be applicable or reliable under all circumstances. Specifically, chemical tools are needed to overcome current limitations that restrict effective biological H2S detection. For example, efforts to determine the role of H2S in inflammatory processes provide conflicting conclusions on whether H2S generates proinflammatory or anti-inflammatory responses (Whiteman & Winyard, 2011). Traditional methods used for H2S sensing including sulfide selective electrodes, gas chromatography, and the methylene blue test, all can be plagued by poor compatibility with live cells, often offer limited temporal resolution, and can require cumbersome sample preparation (DeLeon, Stoy, & Olson, 2012; Fogo & Popowsky, 1947; Lawrence, Davis, & Compton, 2000). In response to these challenges, new reaction-based methods for H2S determination have emerged that offer higher cellular compatibility and spatiotemporal resolution by comparison to traditional methods. Such reaction-based systems make use of the unique chemical properties of H2S to attack activated electrophiles (Chen, Zhu, et al., 2013; Liu et al., 2011; Montoya, Pearce, Hansen, Zakharov, & Pluth, 2013; Montoya & Pluth, 2014; Qian et al., 2011; Shen et al., 2011), precipitate metal salts (Sasakura et al., 2011), or to reduce azide or nitro groups on masked fluorophores (Lippert, New, & Chang, 2011; Montoya & Pluth, 2012; Peng et al., 2011; Thorson, Majtan, Kraus, & Barrios, 2013). More recent advances allow for the simultaneous measurement of both thiols and H2S (Hammers & Pluth, 2014) and offer probes functionalized with targeting groups to report on H2S in specific organelles (Bae et al., 2013; Liu, Xu, Spring, & Cui, 2013), proteins (Chen, Chen, Ren, & Ai, 2012), or cellular environments (Lin, Lippert, & Chang, 2013). The advent and elaboration of reaction-based H2S detection methods has expanded the arsenal of tools available to further advance our understanding of biological H2S.
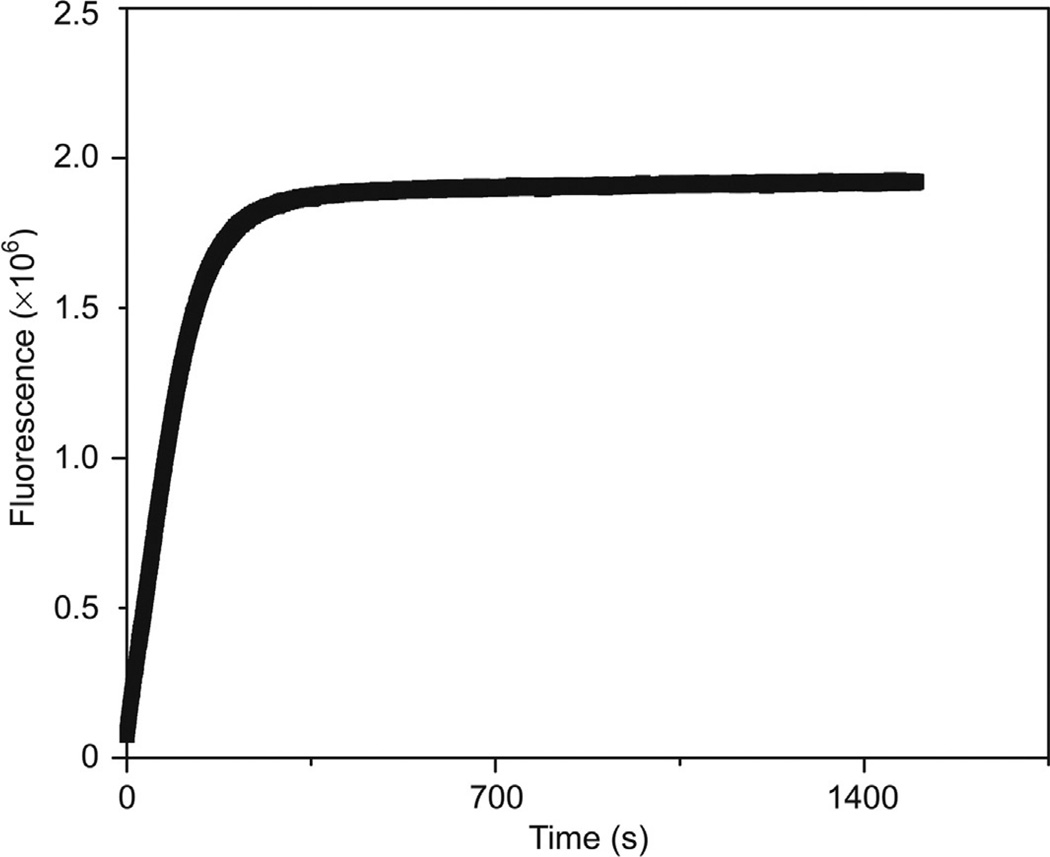
Many recently developed methods for H2S determination rely primarily upon the H2S-mediated reduction azide-masked fluorophores. Such compounds typically mask a fluorogenic amine group of a fluorophore as an azide, thus generating a dark state of the fluorophore until unmasking of the fluorophore by H2S. Under physiological conditions azide-quenched fluorophores are selectively reduced by H2S, even in the presence of orders of magnitude larger concentrations of thiols such as GSH (Lin & Chang, 2012; Peng et al., 2011), to produce a fluorescent response. Although azide-masked fluorophores generally function as highly selective H2S probes, the inherent photosensitivity of the azide functional group may limit their application. For example, although routine fluorescence measurements are unaffected, the high intensity light produced during confocal microscopy or HPLC measurements can result in the photodegradation of the azide functional group and decrease the accuracy of the method (Bailey & Pluth, 2013). As an example of this photosensitivity, we exposed C-7Az (Chen, Li, et al., 2013; Fig. 1) and other azide-based fluorescent H2S sensors to continuous irradiation in the absence of H2S and observed a strong signal solely deriving from photoactivation (Bailey & Pluth 2013).
Figure 1.
Photoactivation of C-7Az. Conditions: λex = 340 nm, λem = 445 nm, 5 µM probe in pH 7.4 PIPES buffer (50 mM PIPES, 100 mM KCl, pH 7.4). Slits: excitation = 5 nm, emission = 1.4 nm. Adapted with permission from Bailey and Pluth (2013). Copyright 2013 American Chemical Society.
To address this limitation of H2S-mediated azide reduction fluorescent probes, we developed a chemiluminescent scaffold to avoid unwanted photoactivation. This method overcomes the photoinstability of azides in fluorescence-based methods by utilizing a chemiluminescent reporter that does not require an external excitation source to generate luminescence. Additionally, because most biological tissues do not spontaneously emit light, a chemiluminescent method should offer a much higher signal-to-noise ratio than that observed in fluorescence measurements. Chemiluminescence spectroscopy is a well-developed analytical method, which is widely employed to collect quantitative data in immunoassays (Williams & Campbell, 1986; Yuan et al., 2012) and chromatography (Garcia, Vinas, & Gil, 1993; Thurbide & Aue, 2002; Yan, 2006). Although chemiluminescent methods are being explored for various small molecules (McCutcheon, Paley, Steinhardt, & Prescher, 2012; Sun, Liu, Wang, Zhang, & Guo, 2012), the palette of chemiluminescent probes available for the detection of small molecules remains small by comparison to fluorescence analogues and is concentrated primarily on the detection of reactive oxygen species (Lee et al., 2008; Van de Bittner, Dubikovskaya, Bertozzi, & Chang, 2010; Yamaguchi et al., 2010). Based on the need to both increase the pool of available tools to study H2S and to further expand the scope of chemiluminescent detection methods for small molecules, we have developed a chemiluminescent platform for H2S, which we detail below.
2. CHEMILUMINESCENT PROBES FOR THE DETERMINATION OF SULFIDE
2.1. Probe design
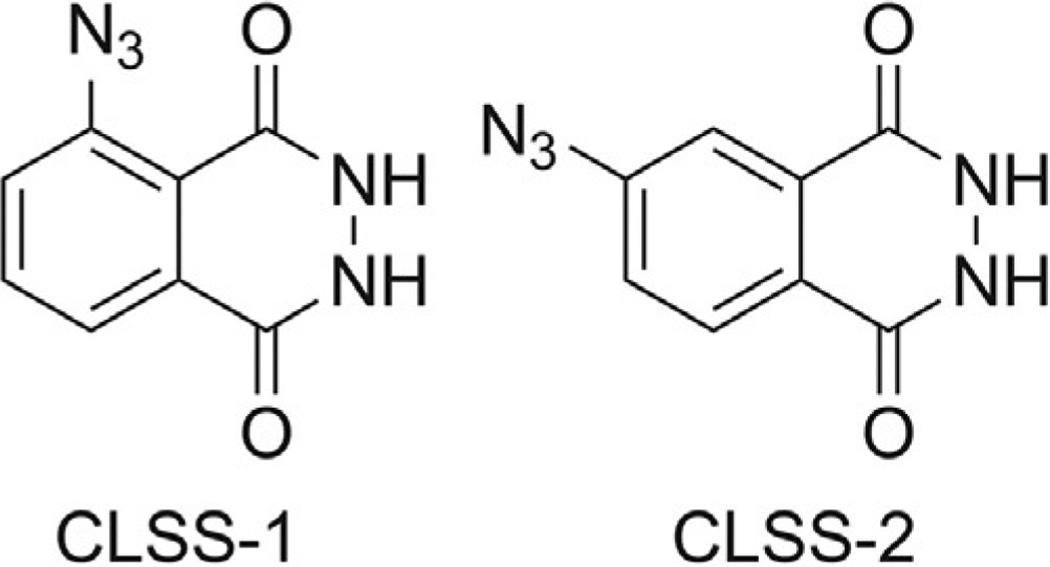
The presented chemiluminescent H2S probes are derivatives of the luminol scaffold, which has been used extensively in chemical-sensing methodologies (Marquette & Blum, 2006). Like other electron-withdrawn luminol derivatives, such as N-acyl (Drew & Garwood, 1939) or nitroluminol (Chen et al., 1998; Omote, Miyake, Ohmori, & Sugiyama, 1966), the azide-masked luminol compounds CLSS-1 and CLSS-2 (Fig. 2) show significantly reduced chemiluminescence by comparison to the parent compound. Unmasking of the azide to release the free amine liberates luminol (for CLSS-1) or isoluminol (for CLSS-2), both of which are chemiluminescent.
Figure 2.
Molecular structures of ChemiLuminescent Sulfide Sensors CLSS-1 and CLSS-2, which are based on the luminol and isoluminol platforms, respectively.
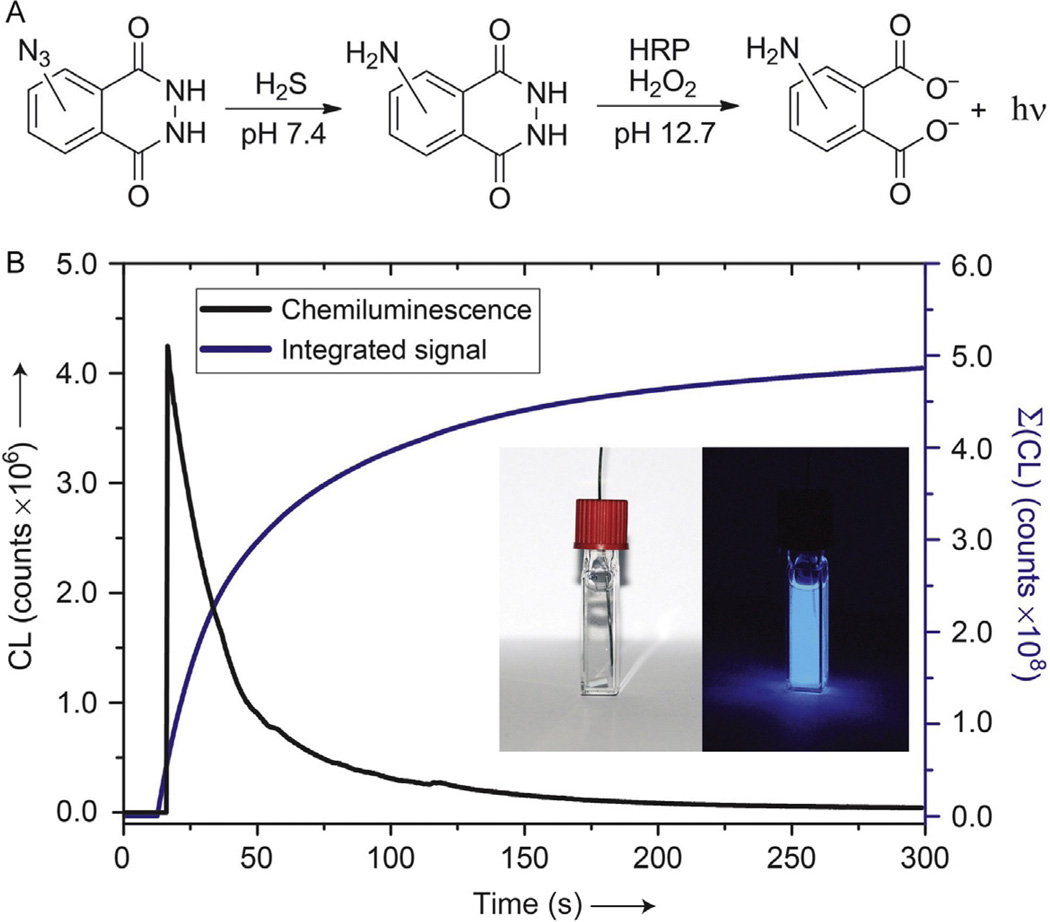
CLSS-1 and CLSS-2, which are not chemiluminescent prior to H2S-mediated reduction of the azide, report by oxidation-induced chemiluminescence of the phthalhydrazide moiety. In a typical luminol assay, H2O2 is used as an oxidant in combination with horseradish peroxidase (HRP) as a catalyst to oxidize the phthalhydrazide functional group to produce a singlet carbonyl species (Fig. 3A). The transient excited phthalate intermediate then relaxes with concomitant liberation of N2 to emit light with luminescence centered at 425 nm (White & Roswell, 1970). The chemiluminescent lifetime and brightness of this reaction can be enhanced in the presence of p-iodophenol or other small-molecule enhancers (Díaz, Sánchez, & González Garcia, 1998; Dodeigne, Thunus, & Lejeune, 2000). Because this reporting mechanism functions without the aid of optical excitation, the background signal prior to H2S-mediated reduction is almost nonexistent. At an appropriate concentration, this method is sensitive enough to be visualized with the naked eye (Fig. 3B).
Figure 3.
Chemiluminescence response profile for CLSS-1 and CLSS-2. (A) H2S-mediated reduction of CLSS-1 and CLSS-2 followed by luminol visualization using HRP (horseradish peroxidase) and H2O2. (B) Chemiluminescence profile of 50 µM CLSS-1 after incubation for 1 h with 33 equiv. of NaSH. Visual detection (inset) at 10 × concentration with 5 s camera exposure. Samples were incubated in pH 7.4 PIPES buffer at 37 °C prior to analysis. Reprinted with permission from Bailey and Pluth (2013). Copyright 2013 American Chemical Society.
2.2. Reactivity
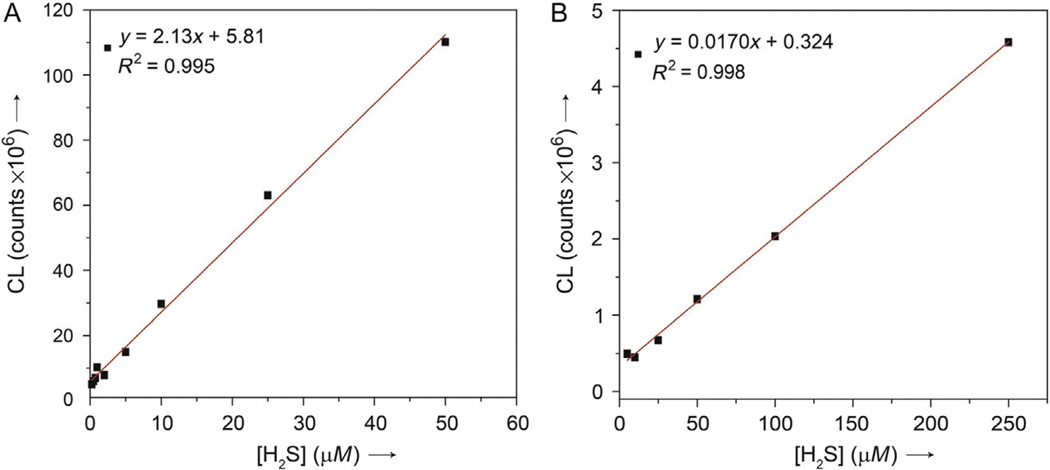
CLSS-1 and CLSS-2 are classified as chemodosimeters because they both react irreversibly with H2S to generate the observed luminescent signal. The H2S detection limit for CLSS-1 and CLSS-2 are 0.7 ± 0.3 and 4.6 ± 2.0 µM, respectively (Fig. 4), with linear ranges extending into the high micromolar concentration range. This detection limit range will be dependent on the instrument used for detection, with lower or higher ranges possible. The CLSS-1 platform provides a slightly lower H2S detection limit than CLSS-2 due to the brighter luminosity of luminol by comparison to isoluminol. The dynamic range of CLSS-1 and CLSS-2 covers the micromolar concentrations relevant for H2S therapeutics (Ali, Opere, & Singh, 2014) while also offering the sensitivity to possibly detect the much lower concentrations expected in cellular environments (Furne, Saeed, & Levitt, 2008).
Figure 4.
Concentration-dependent chemiluminescence response of (A) CLSS-1 and (B) CLSS-2. Values indicate the background corrected, integrated emission at λem = 425 nm and represent the average of at least three replicates. Samples were incubated for 60 min in pH 7.4 PIPES buffer at 37 °C prior to analysis. Reprinted with permission from Bailey and Pluth (2013). Copyright 2013 American Chemical Society.
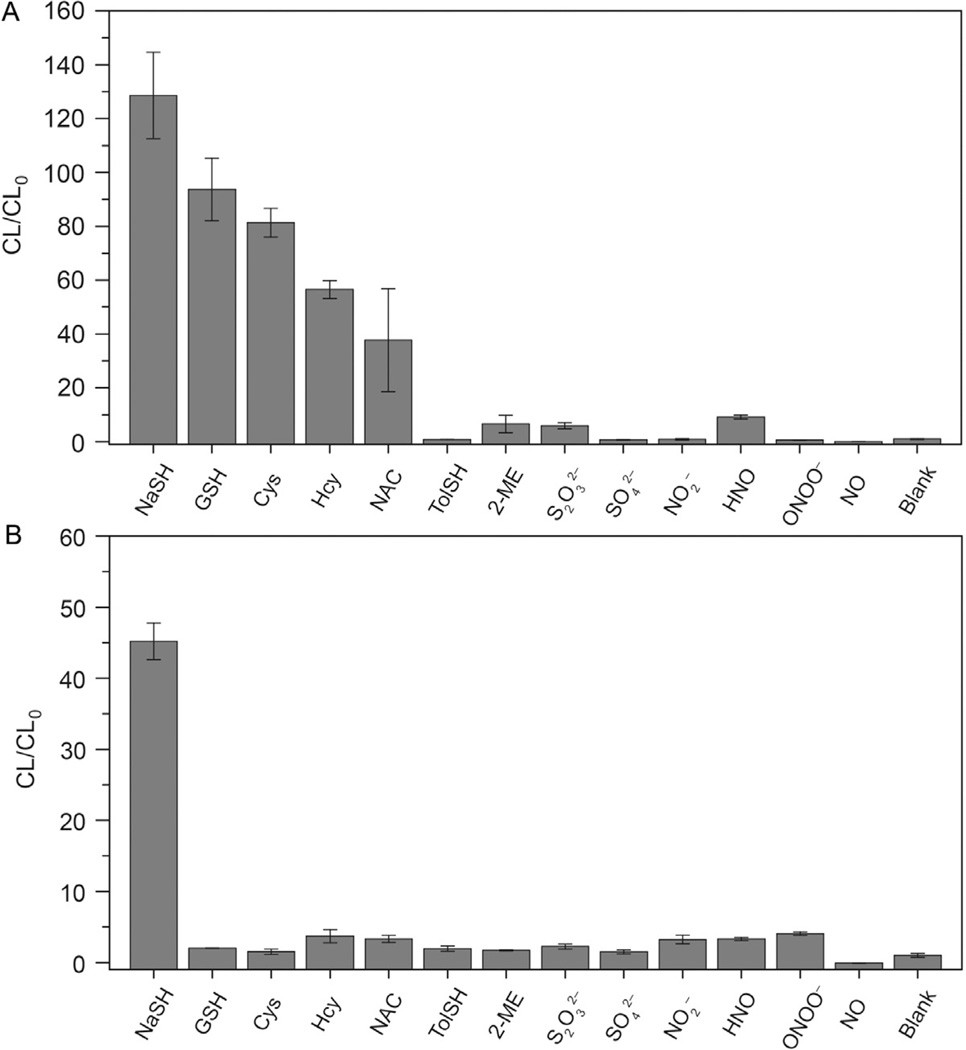
CLSS-1 and CLSS-2 both produce robust luminescence when incubated with an excess of H2S. CLSS-1 displays a 128-fold turn on, making it an excellent reporter for quantifying H2S levels. In determining the response of CLSS-1 to H2S and other biologically relevant reactive sulfur, oxygen, and nitrogen species (RSONS), CLSS-1 displays excellent selectivity for H2S over nitrogen and oxygen species. Unexpectedly, CLSS-1 displays a low tolerance for amino acid containing thiols, especially GSH, making it ill suited for applications in which a large excess of thiols may be present. Although the 45-fold turn on from CLSS-2 is lower than that of CLSS-1, CLSS-2 displays excellent selectivity for H2S over a wide variety of RSONS, including thiols. The improved selectivity of CLSS-2 for H2S over amino acid containing thiols is achieved by moving the azide functionality further from the phthalhydrazide, which is discussed in detail in our initial report (Bailey & Pluth, 2013; Fig. 5).
Figure 5.
Selectivity of (A) CLSS-1 and (B) CLSS-2 with reactive oxygen, nitrogen, and sulfur species. Conditions: 50 µM probe, 33 equiv. of RSONS, incubated 1 h at 37 °C. The reported intensities are background corrected, represent the integrated luminescence (λem = 425 nm), and are the average of at least three replicates. Error bars represent ±SE. Abbreviations: Cys, cysteine; Hcy, homocysteine; NAC, N-acetylcysteine; GSH, reduced glutathione; S2O32−, thiosulfate; SO42−, sulfate; NO, nitric oxide; HNO, nitroxyl; NO2−, nitrite. Reprinted with permission from Bailey and Pluth (2013). Copyright 2013 American Chemical Society.
Although the selectivity of the probes discussed here does not appear to be strongly dependent on pH between 7 and 8, the chemiluminescent signal generated by the HRP/luminol system employed is pH dependent. To ensure accurate measurements, the pH of analytical samples should be buffered. Because both the stability of the excited phthalate and the catalytic rate of HRP/H2O2 are influenced by the basicity of the solution, the pH needs to be adjusted to the same levels for comparable measurements.
2.3. Probe usage and storage
Although CLSS-1 and CLSS-2 are not sensitive to oxygen, H2S, and other RSONS are known to react with oxygen, so measures to exclude air should be taken during sample preparation to obtain the most accurate results. Stock solutions of CLSS-1 and CLSS-2 should be prepared by dissolving a solventfree aliquot of probe in an appropriate amount of air-free DMSO to produce a 10-mM stock solution. This DMSO stock solution should be stored in 50 µL aliquots and frozen at −20 °C. Care should be taken to avoid multiple free-thaw cycles of individual aliquots.
CLSS-1 and CLSS-2 are stable in the solid state at room temperature for over 6 months and do not display significant sensitivity to short-term light exposure. Thawed solutions of CLSS-1 and CLSS-2 do degrade slowly if exposed to light for extended periods of time and should remain frozen until prior to use. CLSS-1 and CLSS-2 are not sufficiently soluble in neutral pH buffers water to prepare aqueous stock solutions directly, but have moderate solubility in DMSO, DMF, methanol, ethanol, and alkaline H2O. Stock solutions made in these solvents can be diluted with acetonitrile- or neutral-buffered H2O without observed precipitation.
3. EXAMPLES OF ROUTINE PROBE USAGE
Imaging of any kind requires optimization of probe loading and instrument parameters. These parameters depend of the nature of the sample, the instruments being used, and the general nature of the experiment. CLSS-1 and CLSS-2 are well suited for a variety of experiment and instrument types and can be readily adapted for use with fluorimeters, fluorescence plate readers, and chemiluminometers. This section details the general approach used to determine the selectivity and sensitivity of both CLSS-1 and CLSS-2 described above.
3.1. Instrumentation and materials
3.1.1 Buffer
Piperazine-N,N′-bis(2-ethansulfonic acid) (PIPES, Aldrich) and potassium chloride (99.999%, Aldrich) were used to make buffered solutions (50 mM PIPES, 100 mM KCl, pH 7.4) with Millipore water. Buffered solutions were degassed by vigorous sparging with N2 and stored in an inert atmosphere glove box.
3.1.2 Reactive species
Anhydrous sodium hydrogen sulfide (NaSH) was purchased from Strem Chemicals and handled under nitrogen. S-nitroso-N-acetyl-dl-penicillamine (SNAP), sodium peroxynitrite (NaO2NO), and Angeli’s salt (NaN2O3) were purchased from Cayman Chemical and stored either at −30 or −80 °C prior to use. l-cysteine, N-acetyl-l-cysteine, and dl-homocysteine were purchased from TCI. Reduced glutathione was purchased from Aldrich. Stock solutions of the reactive species were prepared in either buffer or DMSO under nitrogen immediately prior to use. Type VI-A peroxidase from horseradish 2000 U/mg was purchased from Aldrich, dissolved in pH 7.4 PIPES buffer, and stored in aliquots in the glove box freezer (1000 U/mL).
3.1.3 Instrumentation
Chemiluminescence measurements were measured on a Photon Technology International Quanta Master 40 spectrofluorimeter equipped with an USHIO UXL-75XF Xenon short arc lamp, a LPS-100 lamp power supply, a 914 photomultiplier detection system, and a Quantum Northwest TLC-50 temperature controller set to 37.0 ± 0.05 °C. To ensure the minimum possible baseline, the excitation shutter was closed during all measurements. Emissions slits were opened to 25 nm to ensure all possible light was collected. All chemiluminescent measurements were made under an inert atmosphere in 1.0 cm path length septum-sealed cuvettes obtained from Starna Scientific and were repeated at least in triplicate. Samples were incubated using a Fischer Isotemp cuvette block stored in an insulated box.
3.2. Preparation of CLSS-1 and CLSS-2
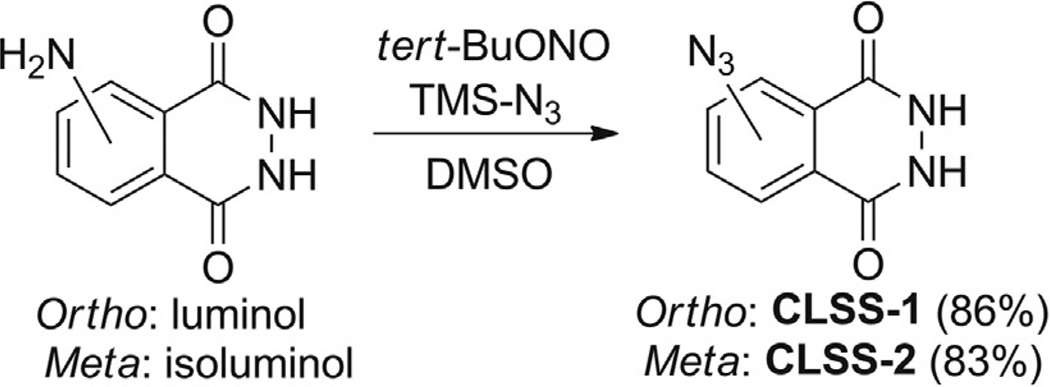
CLSS-1 and CLSS-2 are prepared as described below and as depicted in Scheme 1.
Scheme 1.
Synthesis of CLSS-1 and CLSS-2. Reprinted with permission from Bailey and Pluth (2013). Copyright 2014 American Chemical Society.
3.2.1 CLSS-1
Dry reagent grade DMSO over 4 Å molecular sieves for a period of at least 24 h prior to use. No further precautions are taken to exclude water or air. Luminol (100 mg, 0.56 mmol) is dissolved in 5 mL DMSO in a 20 mL glass scintillation vial to produce a yellow solution. After wrapping the scintillation vial in aluminum foil, tert-butylnitrite (tert-BuONO, 100 µL, 0.85 mmol) is added dropwise to the luminol solution, followed immediately by azidotrimethylsilane (TMS-N3, 95 µL, 0.68 mmol). The solution is stirred at room temperature for 1 h, after which the volatile reagents and reaction byproducts are removed under vacuum (1 torr) to produce a brown solution. Addition of 15 mL of 5% dichloromethane in hexanes precipitates a gray solid, which is collected by vacuum filtration and rinsed with cold dichloromethane to yield CLSS-1 (95 mg, 83%). In the solidphase CLSS-1 slowly forms a hydrate complex with water if left under ambient atmosphere for extended periods of time.
3.2.2 CLSS-2
Dry reagent grade DMSO over 4 Å molecular sieves for a period of at least 24 h prior to use. No further precautions are taken to exclude water or air. Isoluminol (100 mg, 0.56 mmol) is dissolved in 5 mL DMSO in a 20 mL glass scintillation vial to produce a yellow solution. After wrapping the scintillation vial in aluminum foil, tert-butylnitrite (tert-BuONO, 100 µL, 0.85 mmol) is added dropwise to the luminol solution, followed immediately by azidotrimethylsilane (TMS-N3, 95 µL, 0.68 mmol). The solution is stirred at room temperature for 1 h, after which the volatile reagents and reaction byproducts are removed under vacuum (1 torr) to produce a brown–orange solution. Addition of 15 mL of 5% dichloromethane in hexanes precipitates an orange solid, which is collected by vacuum filtration and rinsed with cold dichloromethane to yield CLSS-2 (100 mg, 87%). In the solid-phase CLSS-2 slowly forms a hydrate complex with water if left under ambient atmosphere for extended periods of time, resulting in a purple solid.
3.3. Sensing method
In an oxygen-free glove box, 3.00 mL of PIPES buffer is transferred into each of three quartz cuvettes with stir bars. Although we used a glove box to ensure anaerobic conditions, any apparatus that excludes atmospheric oxygen, such as a glove bag, should be sufficient to generate reproducible results. A 50 µL aliquot of a 10 mM DMSO stock solution of the desired probe is thawed immediately prior to use, and 15 µL is transferred into each of the three cuvettes. The cuvettes are sealed with septa and removed from the glove box. Each cuvette is charged with 50 µL of a 100 mM anaerobic stock solution of the RSON in PIPES buffer (SNAP, Angeli’s salt, and NaOONO excluded), and incubated for 60 min in the absence of light. For H2S sensitivity measurements, the appropriate volume of stock solution required to generate the desired concentration of sulfide replaces the 50 µL addition.
After the 60-min incubation with the reactive species, the cuvettes are basified with 40 µL of 6 M NaOH and charged with 10 µL of a solution containing 1000 U/mL HRP and 0.2 µM p-iodophenol. Data collection is initiated (monitoring at 425 nm with 4 scans/s and a 0.05 s integration time) and the first 60 s of data points are used as a background measurement. After 60 s, 50 µL of H2O2 (35%, Aldrich) is injected into the cuvette and the luminescence is monitored for an additional 300 s. In addition to providing an oxidant source for the luminol reaction, the large excess of H2O2 also ensures that any remaining reductants in the cuvette are quenched.
3.4. Data processing and analysis
Data are collected in FelixGX v.4.0.4 (the standard software for the PTI fluorimeter) and exported into MS Excel for analysis. To correct for the detector background, the average luminescence value of the first 60 s of the data acquisition prior to H2O2 addition is subtracted from each data point measured during data collection. The combined luminescence curve is then integrated and normalized to the blank for quantification purposes.
4. DETECTION OF ENZYMATICALLY PRODUCED H2S
In this section, we highlight the effectiveness of CLSS-2 to detect and measure the concentration of H2S is complex biological mixtures by measuring enzymatically produced H2S. CSE is one of three H2S generating enzymes present in mammalian systems and is especially prevalent in the kidneys and liver. CSE converts cysteine or homocysteine into free H2S using PLP as a cofactor, and can be inhibited by β-cyanoalanine (Pfeffer & Ressler, 1967). This section outlines an assay for the determination of CSE activity in C6 cells, which express CSE and produce H2S endogenously.
4.1. Instrumentation and materials
4.1.1 Instrumentation
Chemiluminescence measurements were obtained on a Photon Technology International Quanta Master 40 spectrofluorimeter equipped with an USHIO UXL-75XF Xenon short arc lamp, a LPS-100 lamp power supply, a 914 photomultiplier detection system, and a Quantum Northwest TLC-50 temperature controller at 37.0 ± 0.05 °C. To ensure the minimum possible baseline measurements, the excitation beam shutter was closed during measurements. Emission slits were opened to 25 nm to ensure that all possible light was collected. All chemiluminescent measurements were made under an inert atmosphere in 1.0 cm path length septum-sealed cuvettes obtained from Starna Scientific and were repeated at least in triplicate. Samples were incubated using a Fischer Isotemp cuvette block stored in an insulated box. Cells were counted Bio RAD TC20 automated cell counter.
4.1.2 Media
Dulbecco’s modified Eagle’s medium (DMEM, Cellgro, MediaTek, Inc.) supplemented with 10% fetal bovine serum (FBS, HyClone), and 1% penicillin/streptomycin.
4.1.3 Probe
A 10 mM CLSS-2 stock solution in DMSO.
4.1.4 Materials
Isolated CSE and β-cyanoalanine were purchased from Cayman Chemicals.
4.1.5 Reactive species
Ten micrograms of CSE, 20 mM Hcy, 20 mM BCA, 25 µM pyruvate, 25 µM NH3, luminescence measurements on cell lysates were made using 100 µL of lysate solution (2 × 10⁶ cells per experiment) under ambient atmosphere.
4.2. Cell culture and lysing
C6 cells were obtained from ATCC and cultured in DMEM. Cells were passed and plated into T-75 flasks containing 10 mL of DMEM, and incubated at 37 °C with 5% CO2. For luminescence studies, the cells were washed with 1 × phosphate-buffered saline (PBS), trypsinized with 5 mL of trypsin, and then centrifuged to form a cell pellet. The cell pellet was resuspended in 5 mL of 1 × PBS and the cells were counted. Cells were centrifuged at 1000 RPM for 5 min at room temperature, placed on ice and lysed using 100 µL of RIPA buffer (pH 7.5, 10 mM Tris–HCl, 150 mM NaCl, 1.0% Nonidet P-40, 0.1% SDS, 0.1% sodium deoxycholate) containing protease inhibitor (PhosSTOP, Roche) for every 2 × 10⁶ cells in the pellet.
4.3. Assay for enzymatically produced H2S
Isolated CSE enzyme or C6 cell lysates were added to a cuvette containing 3.00 mL pH 7.4 PIPES buffer under an anaerobic atmosphere and incubated for 48 h. This incubation period can be changed depending on the amount of enzyme added as well as the enzyme activity. After the initial incubation period, introduce 15 µL of 10mM CLSS-2 and incubate for an additional 60 min. Upon completion of the second incubation, 40 µL of 6 M NaOH is added to increase the pH to 12.7, an optimal level for luminol chemiluminescence. After pH adjustment, 10 µL of 1000 U/mL (HRP) containing 0.2 µM p-iodophenol is added. A background reading is acquired for 60 s, after which 50 µL of H2O2 (35%) is added. The sample luminosity at 425 nm is then integrated for a time suitable to capture the sample luminescence. The data reported are the average of at least three independent experiments.
4.4. Results and controls
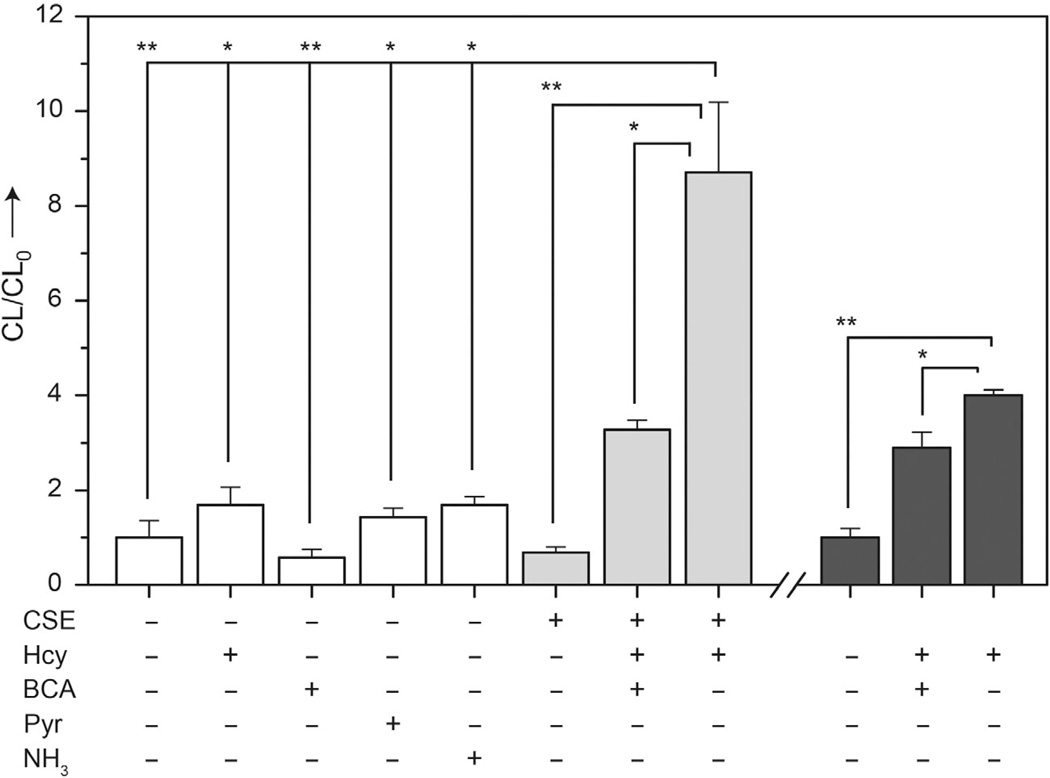
CLSS-2 is nonreactive (p<0.05) with the CSE substrate Hcy, the CSE inhibitor BCA, and the CSE reaction byproducts pyruvate (Pyr) and NH3 (Fig. 6, white bars). Similarly, CLSS-2 does not produce a significant signal in the presence of isolated CSE alone. Upon introduction of Hcy as a CSE substrate in the presence of both CLSS-1 and CSE; however, a strong signal is observed when compared with CSE alone (p<0.001) or when BCA is used to inhibit the H2S-forming reaction (p<0.005) (Fig. 6, light gray bars). The known kinetic parameters for the CSE-mediated conversion of Hcy to H2S (Faccenda, Wang,& Mutus, 2012) are in agreement with H2S quantification values using the chemiluminescent response curve for CLSS-2 in Fig. 4B. These results show that CLSS-2 can be used to quantify H2S enzymatically generated by CSE and to differentiate between the inhibited and uninhibited enzyme states.
Figure 6.
Detection of CSE-produced H2S using CLSS-2. Conditions: absence of enzyme (white), 10 µg CSE (light gray), 20 mM Hcy, 20 mM BCA, 25 µM pyruvate, 25 µM NH3; incubated at in 3.0 mL buffer at 37 °C for 48 h prior to detection with 50 µM CLSS-2. Comparison with C6 cell lysates containing 2 × 10⁶ cells (dark gray). Each data point represents the mean ± SE derived from at least three independent experiments; *p<0.005, **p<0.001. Reprinted with permission from Bailey and Pluth (2013). Copyright 2013 American Chemical Society.
C6 cells, which express CSE and produce H2S endogenously in the presence of CSE substrates (Kandil, Brennan, & McBean, 2010), were also used to demonstrate this assay. Introduction of CLSS-2 to C6 cell lysates in the absence of Cys or Hcy results in minimal luminescent (Fig. 6, dark gray), consistent with limited cellular H2S production in the absence of CSE substrates. When CLSS-2 is added to C6 cell lysates preincubated with Hcy as a CSE substrate, the luminescence increases significantly (p<0.001) by comparison to lysates lacking substrate, signifying that CSE present in the cell lysates produces sufficient H2S to be detected by CLSS-2. Furthermore, addition of both Hcy and BCA to C6 cell lysates abrogated the luminescent response (p<0.005), which is consistent with CSE inhibition. These results build upon the isolated CSE experiments and demonstrate that CLSS-2 can detect endogenously produced H2S even in the presence of other biological species. Most importantly, this result confirms that other biological species in the cellular milieu do not activate CLSS-2.
5. CONCLUSIONS
Utilizing a chemiluminescent platform for detecting H2S allows for the determination of H2S at physiologically relevant levels. Not only are these platforms the first example of reaction-based chemiluminescent probes for H2S, but they also offer insight into new strategies to separate the reactivity of H2S from other biological sulfhydryl-containing species. In addition to detecting exogenous H2S, CLSS-2 can detect enzymatically produced H2S from both isolated CSE enzymes and also from C6 cell lysates and can also differentiate inhibited and native states of the enzyme.
ACKNOWLEDGMENTS
This work was supported by the NIGMS (R00 GM092970) and funding from the University of Oregon (UO). We thank Leticia Montoya for assistance with cell culture work.
REFERENCES
- Abe K, Kimura H. The possible role of hydrogen sulfide as an endogenous neuromodulator. Journal of Neuroscience. 1996;16:1066–1071. doi: 10.1523/JNEUROSCI.16-03-01066.1996. [DOI] [PMC free article] [PubMed] [Google Scholar]
- Ali H, Opere C, Singh S. In vitro-controlled release delivery system for hydrogen sulfide donor. AAPS PharmSciTech. 2014;15:910–919. doi: 10.1208/s12249-014-0117-8. [DOI] [PMC free article] [PubMed] [Google Scholar]
- Bae SK, Heo CH, Choi DJ, Sen D, Joe E-H, Cho BR, et al. A ratiometric two-photon fluorescent probe reveals reduction in mitochondrial H2S production in Parkinson’s disease gene knockout astrocytes. Journal of the American Chemical Society. 2013;135:9915–9923. doi: 10.1021/ja404004v. [DOI] [PubMed] [Google Scholar]
- Bailey TS, Pluth MD. Chemiluminescent detection of enzymatically produced hydrogen sulfide: Substrate hydrogen bonding influences selectivity for H2S over biological thiols. Journal of the American Chemical Society. 2013;135:16697–16704. doi: 10.1021/ja408909h. [DOI] [PMC free article] [PubMed] [Google Scholar]
- Chan MV, Wallace JL. Hydrogen sulfide-based therapeutics and gastrointestinal diseases: Translating physiology to treatments. American Journal of Physiology. Gastrointestinal and Liver Physiology. 2013;305:G467–G473. doi: 10.1152/ajpgi.00169.2013. [DOI] [PubMed] [Google Scholar]
- Chen S, Chen Z-J, Ren W, Ai H-W. Reaction-based genetically encoded fluorescent hydrogen sulfide sensors. Journal of the American Chemical Society. 2012;134:9589–9592. doi: 10.1021/ja303261d. [DOI] [PubMed] [Google Scholar]
- Chen B, Li W, Lv C, Zhao M, Jin H, Jin H, et al. Fluorescent probe for highly selective and sensitive detection of hydrogen sulfide in living cells and cardiac tissues. The Analyst. 2013;138:946–951. doi: 10.1039/c2an36113b. [DOI] [PubMed] [Google Scholar]
- Chen GN, Lin RE, Zhuang HS, Zhao ZF, Xu XQ, Zhang F. Study of electrogenerated chemiluminescence of N-(β-carboxyl-propionyl)luminol. Analytica Chimica Acta. 1998;375:269–275. [Google Scholar]
- Chen C-Q, Xin H, Zhu Y-Z. Hydrogen sulfide: Third gaseous transmitter, but with great pharmacological potential. Acta Pharmacologica Sinica. 2007;28:1709–1716. doi: 10.1111/j.1745-7254.2007.00629.x. [DOI] [PubMed] [Google Scholar]
- Chen Y, Zhu C, Yang Z, Chen J, He Y, Jiao Y, et al. A ratiometric fluorescent probe for rapid detection of hydrogen sulfide in mitochondria. Angewandte Chemie International Edition. 2013;52:1688–1691. doi: 10.1002/anie.201207701. [DOI] [PubMed] [Google Scholar]
- Cortese-Krott MM, Fernandez BO, Santos JLT, Mergia E, Grman M, Nagy P, et al. Nitrosopersulfide (SSNO−) accounts for sustained NO bioactivity of S-nitrosothiols following reaction with sulfide. Redox Biology. 2014;2:234–244. doi: 10.1016/j.redox.2013.12.031. [DOI] [PMC free article] [PubMed] [Google Scholar]
- DeLeon ER, Stoy GF, Olson KR. Passive loss of hydrogen sulfide in biological experiments. Analytical Biochemistry. 2012;421:203–207. doi: 10.1016/j.ab.2011.10.016. [DOI] [PubMed] [Google Scholar]
- Díaz AN, Sánchez FG, González Garcia JA. Phenol derivatives as enhancers and inhibitors of luminol–H2O2–horseradish peroxidase chemiluminescence. Journal of Bioluminescence and Chemiluminescence. 1998;13:75–84. doi: 10.1002/(SICI)1099-1271(199803/04)13:2<75::AID-BIO469>3.0.CO;2-7. [DOI] [PubMed] [Google Scholar]
- Dodeigne C, Thunus L, Lejeune R. Chemiluminescence as diagnostic tool. A review. Talanta. 2000;51:415–439. doi: 10.1016/s0039-9140(99)00294-5. [DOI] [PubMed] [Google Scholar]
- Drew HDK, Garwood RF. Chemiluminescent organic compounds. Part VII. Substituted phthalaz-1,4-Diones. Effect of substituents on the luminescent power. Journal of the Chemical Society. 1939;177:836–837. [Google Scholar]
- Faccenda A, Wang J, Mutus B. Polydimethylsiloxane permeability-based method for the continuous and specific detection of hydrogen sulfide. Analytical Chemistry. 2012;84:5243–5249. doi: 10.1021/ac3008863. [DOI] [PubMed] [Google Scholar]
- Filipovic MR, Miljkovic JL, Nauser T, Royzen M, Klos K, Shubina T, et al. Chemical characterization of the smallest S-nitrosothiol, HSNO; cellular cross-talk of H2S and S-nitrosothiols. Journal of the American Chemical Society. 2012;134:12016–12027. doi: 10.1021/ja3009693. [DOI] [PMC free article] [PubMed] [Google Scholar]
- Fogo JK, Popowsky M. Spectrophotometric determination of hydrogen sulfide. Analytical Chemistry. 1947;21:732–734. [Google Scholar]
- Furne J, Saeed A, Levitt MD. Whole tissue hydrogen sulfide concentrations are orders of magnitude lower than presently accepted values. American Journal of Physiology. Regulatory, Integrative and Comparative Physiology. 2008;295:R1479–R1485. doi: 10.1152/ajpregu.90566.2008. [DOI] [PubMed] [Google Scholar]
- Garcia IL, Vinas P, Gil JAM. FIA titrations of sulfide, cysteine and thiol-containing drugs with chemiluminescent detection. Fresenius Journal of Analytical Chemistry. 1993;345:723–726. [Google Scholar]
- Hammers MD, Pluth MD. Ratiometric measurement of hydrogen sulfide and cysteine/homocysteine ratios using a dual-fluorophore fragmentation strategy. Analytical Chemistry. 2014;86:7135–7140. doi: 10.1021/ac501680d. [DOI] [PMC free article] [PubMed] [Google Scholar]
- Jiang B, Tang GH, Cao K, Wu LY, Wang R. Molecular mechanism for H2S-induced activation of K-ATP channels. Antioxidants and Redox Signaling. 2010;12:1167–1178. doi: 10.1089/ars.2009.2894. [DOI] [PubMed] [Google Scholar]
- Kandil S, Brennan L, McBean GJ. Glutathione depletion causes a JNK and p38MAPK-mediated increase in expression of cystathionine-γ-lyase and upregulation of the transsulfuration pathway in C6 glioma cells. Neurochemistry International. 2010;56:611–619. doi: 10.1016/j.neuint.2010.01.004. [DOI] [PubMed] [Google Scholar]
- Lawrence NS, Davis J, Compton RG. Analytical strategies for the detection of sulfide: A review. Talanta. 2000;52:771–784. doi: 10.1016/s0039-9140(00)00421-5. [DOI] [PubMed] [Google Scholar]
- Lee DW, Erigala VR, Dasari M, Yu JH, Dickson RM, Murthy N. Detection of hydrogen peroxide with chemiluminescent micelles. International Journal of Nanomedicine. 2008;3:471–476. [PMC free article] [PubMed] [Google Scholar]
- Lin VS, Chang CJ. Fluorescent probes for sensing and imaging biological hydrogen sulfide. Current Opinion in Chemical Biology. 2012;16:595–601. doi: 10.1016/j.cbpa.2012.07.014. [DOI] [PMC free article] [PubMed] [Google Scholar]
- Lin VS, Lippert AR, Chang CJ. Cell-trappable fluorescent probes for endogenous hydrogen sulfide signaling and imaging H2O2-dependent H2S production. Proceedings of the National Academy of Sciences. 2013;110:7131–7135. doi: 10.1073/pnas.1302193110. [DOI] [PMC free article] [PubMed] [Google Scholar]
- Lippert AR, New EJ, Chang CJ. Reaction-based fluorescent probes for selective imaging of hydrogen sulfide in living cells. Journal of the American Chemical Society. 2011;133:10078–10080. doi: 10.1021/ja203661j. [DOI] [PubMed] [Google Scholar]
- Liu CR, Pan J, Li S, Zhao Y, Wu LY, Berkman CE, et al. Capture and visualization of hydrogen sulfide by a fluorescent probe. Angewandte Chemie International Edition. 2011;50:10327–10329. doi: 10.1002/anie.201104305. [DOI] [PMC free article] [PubMed] [Google Scholar]
- Liu T, Xu Z, Spring DR, Cui J. A lysosome-targetable fluorescent probe for imaging hydrogen sulfide in living cells. Organic Letters. 2013;15:2310–2313. doi: 10.1021/ol400973v. [DOI] [PubMed] [Google Scholar]
- Marquette C, Blum L. Applications of the luminol chemiluminescent reaction in analytical chemistry. Analytical and Bioanalytical Chemistry. 2006;385:546–554. doi: 10.1007/s00216-006-0439-9. [DOI] [PubMed] [Google Scholar]
- McCutcheon DC, Paley MA, Steinhardt RC, Prescher JA. Expedient synthesis of electronically modified luciferins for bioluminescence imaging. Journal of the American Chemical Society. 2012;134:7604–7607. doi: 10.1021/ja301493d. [DOI] [PMC free article] [PubMed] [Google Scholar]
- Montoya LA, Pearce TF, Hansen RJ, Zakharov LN, Pluth MD. Development of selective colorimetric probes for hydrogen sulfide based on nucleophilic aromatic substitution. Journal of Organic Chemistry. 2013;78:6550–6557. doi: 10.1021/jo4008095. [DOI] [PMC free article] [PubMed] [Google Scholar]
- Montoya LA, Pluth MD. Selective turn-on fluorescent probes for imaging hydrogen sulfide in living cells. Chemical Communications. 2012;48:4767–4769. doi: 10.1039/c2cc30730h. [DOI] [PMC free article] [PubMed] [Google Scholar]
- Montoya LA, Pluth MD. Hydrogen sulfide deactivates common nitrobenzofurazan-based fluorescent thiol labeling reagents. Analytical Chemistry. 2014;86:6032–6039. doi: 10.1021/ac501193r. [DOI] [PMC free article] [PubMed] [Google Scholar]
- Nishida M, Sawa T, Kitajima N, Ono K, Inoue H, Ihara H, et al. Hydrogen sulfide anion regulates redox signaling via electrophile sulfhydration. Nature Chemical Biology. 2012;8:714–724. doi: 10.1038/nchembio.1018. [DOI] [PMC free article] [PubMed] [Google Scholar]
- Omote Y, Miyake T, Ohmori S, Sugiyama N. The chemiluminescence of acyl luminols. Bulletin of the Chemical Society of Japan. 1966;39:932–935. [Google Scholar]
- Peng H, Cheng Y, Dai C, King AL, Predmore BL, Lefer DJ, et al. A fluorescent probe for fast and quantitative detection of hydrogen sulfide in blood. Angewandte Chemie International Edition. 2011;50:9672–9675. doi: 10.1002/anie.201104236. [DOI] [PMC free article] [PubMed] [Google Scholar]
- Pfeffer M, Ressler C. Beta-cyanoalanine an inhibitor of rat liver cystathionase. Biochemical Pharmacology. 1967;16:2299–2308. doi: 10.1016/0006-2952(67)90217-1. [DOI] [PubMed] [Google Scholar]
- Pietri R, Roman-Morales E, Lopez-Garriga J. Hydrogen sulfide and hemeproteins: Knowledge and mysteries. Antioxidants and Redox Signaling. 2011;15:393–404. doi: 10.1089/ars.2010.3698. [DOI] [PMC free article] [PubMed] [Google Scholar]
- Qian Y, Karpus J, Kabil O, Zhang SY, Zhu HL, Banerjee R, et al. Selective fluorescent probes for live-cell monitoring of sulphide. Nature Communications. 2011;2:495. doi: 10.1038/ncomms1506. [DOI] [PubMed] [Google Scholar]
- Qu K, Lee SW, Bian JS, Low CM, Wong PTH. Hydrogen sulfide: Neurochemistry and neurobiology. Neurochemistry International. 2008;52:155–165. doi: 10.1016/j.neuint.2007.05.016. [DOI] [PubMed] [Google Scholar]
- Sasakura K, Hanaoka K, Shibuya N, Mikami Y, Kimura Y, Komatsu T, et al. Development of a highly selective fluorescence probe for hydrogen sulfide. Journal of the American Chemical Society. 2011;133:18003–18005. doi: 10.1021/ja207851s. [DOI] [PubMed] [Google Scholar]
- Shen X, Pattillo CB, Pardue S, Bir SC, Wang R, Kevil CG. Measurement of plasma hydrogen sulfide in vivo and in vitro. Free Radical Biology and Medicine. 2011;50:1021–1031. doi: 10.1016/j.freeradbiomed.2011.01.025. [DOI] [PMC free article] [PubMed] [Google Scholar]
- Shibuya N, Koike S, Tanaka M, Ishigami-Yuasa M, Kimura Y, Ogasawara Y, et al. A novel pathway for the production of hydrogen sulfide from D-cysteine in mammalian cells. Nature Communications. 2013;4:1366. doi: 10.1038/ncomms2371. [DOI] [PubMed] [Google Scholar]
- Sparatore A, Santus G, Giustarini D, Rossi R, Del Soldato P. Therapeutic potential of new hydrogen sulfide-releasing hybrids. Expert Review of Clinical Pharmacology. 2011;4:109–121. doi: 10.1586/ecp.10.122. [DOI] [PubMed] [Google Scholar]
- Sun YQ, Liu J, Wang P, Zhang J, Guo W. D-luciferin analogues: A multicolor toolbox for bioluminescence imaging. Angewandte Chemie International Edition. 2012;51:8428–8430. doi: 10.1002/anie.201203565. [DOI] [PubMed] [Google Scholar]
- Szabó C. Hydrogen sulphide and its therapeutic potential. Nature Reviews Drug Discovery. 2007;6:917–935. doi: 10.1038/nrd2425. [DOI] [PubMed] [Google Scholar]
- Thorson MK, Majtan T, Kraus JP, Barrios AM. Identification of cystathionine β-synthase inhibitors using a hydrogen sulfide selective probe. Angewandte Chemie International Edition. 2013;52:4641–4644. doi: 10.1002/anie.201300841. [DOI] [PubMed] [Google Scholar]
- Thurbide KB, Aue WA. Chemiluminescent emission spectra of lead, chromium, ruthenium, iron, manganese, rhenium, osmium and tungsten in the reactive flow detector. Spectrochimica Acta Part B: Atomic Spectroscopy. 2002;57:843–852. [Google Scholar]
- Van de Bittner GC, Dubikovskaya EA, Bertozzi CR, Chang CJ. In vivo imaging of hydrogen peroxide production in a murine tumor model with a chemoselective bioluminescent reporter. Proceedings of the National Academy of Sciences. 2010;107:21316–21321. doi: 10.1073/pnas.1012864107. [DOI] [PMC free article] [PubMed] [Google Scholar]
- Wallace JL, Dicay M, McKnight W, Martin GR. Hydrogen sulfide enhances ulcer healing in rats. FASEB Journal: Official Publication of the Federation of American Societies for Experimental Biology. 2007;21:4070–4076. doi: 10.1096/fj.07-8669com. [DOI] [PubMed] [Google Scholar]
- Wang R. Hydrogen sulfide: A new EDRF. Kidney International. 2009;76:700–704. doi: 10.1038/ki.2009.221. [DOI] [PubMed] [Google Scholar]
- Wang R. Physiological implications of hydrogen sulfide: A whiff exploration that blossomed. Physiological Reviews. 2012;92:791–896. doi: 10.1152/physrev.00017.2011. [DOI] [PubMed] [Google Scholar]
- White EH, Roswell DF. Chemiluminescence of organic hydrazides. Accounts of Chemical Research. 1970;3:54–62. [Google Scholar]
- Whiteman M, Moore PK. Hydrogen sulfide and the vasculature: A novel vasculoprotective entity and regulator of nitric oxide bioavailability? Journal of Cellular and Molecular Medicine. 2009;13:488–507. doi: 10.1111/j.1582-4934.2009.00645.x. [DOI] [PMC free article] [PubMed] [Google Scholar]
- Whiteman M, Winyard PG. Hydrogen sulfide and inflammation: The good, the bad, the ugly and the promising. Expert Review of Clinical Pharmacology. 2011;4:13–32. doi: 10.1586/ecp.10.134. [DOI] [PubMed] [Google Scholar]
- Williams EJ, Campbell AK. A homogeneous assay for biotin based on chemiluminescence energy transfer. Analytical Biochemistry. 1986;155:249–255. doi: 10.1016/0003-2697(86)90433-1. [DOI] [PubMed] [Google Scholar]
- Wu LY, Yang W, Jia XM, Yang GD, Duridanova D, Cao K, et al. Pancreatic islet overproduction of H2S and suppressed insulin release in Zucker diabetic rats. Laboratory Investigation. 2009;89:59–67. doi: 10.1038/labinvest.2008.109. [DOI] [PubMed] [Google Scholar]
- Yamaguchi S, Kishikawa N, Ohyama K, Ohba Y, Kohno M, Masuda T, et al. Evaluation of chemiluminescence reagents for selective detection of reactive oxygen species. Analytica Chimica Acta. 2010;665:74–78. doi: 10.1016/j.aca.2010.03.025. [DOI] [PubMed] [Google Scholar]
- Yan X. Unique selective detectors for gas chromatography: Nitrogen and sulfur chemiluminescence detectors. Journal of Separation Science. 2006;29:1931–1945. doi: 10.1002/jssc.200500507. [DOI] [PubMed] [Google Scholar]
- Yang GD, Wu LY, Jiang B, Yang W, Qi JS, Cao K, et al. H2S as a physiologic vasorelaxant: Hypertension in mice with deletion of cystathionine gamma-lyase. Science. 2008;322:587–590. doi: 10.1126/science.1162667. [DOI] [PMC free article] [PubMed] [Google Scholar]
- Yuan H, Chong H, Wang B, Zhu C, Liu L, Yang Q, et al. Chemical molecule-induced light-activated system for anticancer and antifungal activities. Journal of the American Chemical Society. 2012;134:13184–13187. doi: 10.1021/ja304986t. [DOI] [PubMed] [Google Scholar]


