

Abstract
BACKGROUND
Epigenetic dysregulation involving alterations in DNA methylation is a hallmark of various types of cancer, including acute myeloid leukemia (AML). Although specific cancer types and clinical aggressiveness of tumors can be determined by DNA methylation status, the assessment of DNA methylation at multiple loci is not routinely performed in the clinical laboratory.
METHODS
We recently described a novel microsphere-based assay for multiplex evaluation of DNA methylation. In the current study, we validated and used an improved assay [termed expedited HpaII small fragment Enrichment by Ligation-mediated PCR (xMELP)] that can be performed with appropriate clinical turnaround time.
RESULTS
Using the xMELP assay in conjunction with a new 17-locus random forest classifier that has been trained using 344 AML samples, we were able to segregate an independent cohort of 70 primary AML patients into methylation-determined subgroups with significantly distinct mortality risk (P = 0.009). We also evaluated precision, QC parameters, and preanalytic variables of the xMELP assay and determined the sensitivity of the random forest classifier score to failure at 1 or more loci.
CONCLUSIONS
Our results demonstrate that xMELP performance is suitable for implementation in the clinical laboratory and predicts AML outcome in an independent patient cohort.
Cancer is thought of as a disease caused by multiple mutations that confer proliferative advantages to neoplastic cells (1, 2). Extensive investigations have explored the role of sequence alterations in oncogenesis, and mutational assessment of pathologic tissue aids in determining diagnosis, prognosis, and therapy of multiple tumor types (3).
Although the mutational profile of tumor cells is central to tumor biology and the clinical assessment of patients, it does not encompass the entire biologic dysregulation of tumor cells. Much recent work has demonstrated that cancer is not only driven by mutations but also by epigenetic events or disrupted chromatin structure (4). These epigenetic changes occur at multiple levels, including DNA methylation and histone modifications. Not surprisingly, large-scale analyses of epigenetic phenomena have shown clear correlations between epigenetic patterns and patient outcome. Correlations between DNA methylation and clinical prognosis have been observed for many cancers, including glioblastoma, acute myeloid leukemia (AML),6 T-cell and B-cell lymphoblastic leukemia, lung carcinoma, ovarian carcinoma, and melanoma (5–16).
Despite the relationship between DNA methylation and prognosis, assays measuring patterns of methylation are not commonly used in clinical practice. The reasons for this likely involve both techniques and instrumentation required for DNA methylation analysis. Methods for analyzing DNA methylation typically utilize methylation-sensitive restriction enzyme digestion, bisulfite treatment of DNA, or precipitation using proteins specific for methylated DNA, and the choice of technique depends on a number of factors, including cost, resolution required, number of loci interrogated, turnaround time, and instrumentation and technical skills required. Multilocus methylation analysis often involves platforms such as custom-made arrays or high-throughput sequencing, which substantially raise the cost of clinical implementation. Thus, assays utilizing techniques and equipment that are commonplace in pathology laboratories would be ideal.
We recently described a novel assay that simultaneously assesses the DNA methylation status of 18 prognostically important loci in patients with AML (17). This methodology, based on the HpaII small fragment Enrichment by Ligation-mediated PCR (HELP) assay, depends on molecular techniques—restriction digestion, oligonucleotide ligation, and PCR—that are commonplace in a clinical laboratory (18). Unlike HELP, which employs custom-made solid-phase arrays for locus identity and methylation assessment, our assay (termed Microsphere HELP or MELP) uses oligonucleotides coupled to fluorescent microspheres and flow cytometric analysis for multilocus DNA methylation assessment. Microsphere-based techniques are commonly performed for mutation assessment of patients with AML in clinical laboratories (19). Our studies demonstrated that MELP is a quantitative method for locus-specific assessment of methylation levels and is highly correlated with HELP (17). Additionally, a MELP-based DNA methylation classifier using prognostic loci previously identified with the HELP assay segregated tumors into subgroups with significantly distinct outcomes. These data suggested that MELP is a robust method of multilocus DNA methylation quantification that may be useful for assessing prognosis in patients with AML.
We now describe novel developments in both assay methodology and the multivariate classification algorithm used to predict AML prognosis. The optimized MELP technique [expedited MELP (xMELP)] shortens the assay time to make it more appropriate for use in the clinical laboratory (20). Our methylation-based prognostic algorithm is now based on a random forest classifier using a refined 17-locus panel trained from a set of 344 AML samples. With these alterations, we define QC standards for the assay and describe performance characteristics. We further demonstrate that the xMELP assay and new classification algorithm strongly predict overall survival in an independent cohort of 70 primary AML samples. These results indicate that xMELP is suitable for prognostic tumor evaluation in the clinical setting.
Materials and Methods
xMELP ASSAY
xMELP is performed as previously described (17) with the following alterations: digestion and ligation reactions are combined using 500 ng of DNA along with 7.5 μL of annealed oligonucleotides [3 OD/mL JHpaII 12XXXX (XXXX indicates xMELP primers) and 6 OD/μL JHpa24XXXX], 0.5 μL BSA [10 g/L, New Eng-land Biolabs (NEB)], 0.5 μL ATP (100 mmol/L, pH 7.0, NEB), 5 μL digestion buffer (NEB), 4 U MspI or 2 U HpaII (NEB), 2 U T4 DNA ligase (Life Technologies). Total reaction volume is 50 μL. Reactions are performed at 25 °C for 12 h.
Primers used (nomenclature as previously used with XXXX indicating xMELP primers):
JHpaII 12XXXX: CGCCTGTTCAT.
JHpaII 24XXXX: CGACGTCGACTATCCATG AACAGG.
Nucleotides in bold indicate changes to prevent redigestion of ligated products. Underlined nucleotides are involved in annealing to genomic DNA. JHpaII24 XXXX is also used for PCR.
For dilution experiments, genomic DNA was diluted with water or with genomic DNA from peripheral blood of a healthy donor at indicated ratios. Ficoll preparation of bone marrow samples was done according to standard protocol (Stemcell Technologies).
Median fluorescent intensity was measured to derive raw abundance values from Luminex beads as previously described (17). Log2(HpaII/MspI) values were scaled by subtracting the mean log2 ratio for 3 loci (MSPI0406S00318682, MSPI0406S00653944, MSPI0406S00890278) previously shown to represent an unmethylated baseline within AML samples.
TUMOR BANK
The 344-sample Dutch-Belgian Hemato-Oncology Cooperative Group (HOVON) cohort used for training has been previously described (6), and details are provided in the Supplemental Methods in the Data Supplement that accompanies the online version of this article at http://www.clinchem.org/content/vol61/issue1. An independent cohort of 207 AML samples was obtained from the Perelman School of Medicine, University of Pennsylvania, Philadelphia, PA (UPenn). All participants provided informed consent for collection under a protocol approved by the UPenn Institutional Review Board. xMELP was performed on all 207 samples. A subset of this group (n = 70) was randomly selected from the set of participants for whom survival data were available and was used for validation.
LOCUS SELECTION
By use of HOVON methylation data, 18 loci were previously shown to predict outcome in AML (6), and we have described their use with MELP (17). Additionally, we randomly repartitioned the original HOVON data set and used supervised principal components (SuperPC) to identify an additional 9 candidate loci. Methylation at these 27 loci was simultaneously assayed along with methylation at 3 control loci for each AML sample (see online Supplemental Table 1). A subset of the 27 loci was used in the final classification model (see below).
DATA ANALYSIS AND MULTIPLEX CLASSIFICATION
Data analysis was performed using the R statistical software package (R version 3.0.2) in conjunction with the survival (version 2.37–7), MethComp (version 1.22), and scatterplot3d (version 0.3–35) packages (21–24). An R script for analysis and figure creation is included as online Supplemental Data along with associated data files. Random forest survival calculations were performed using the RandomForestSRC package (version 1.4) (25) with 1000 trees. The random forest was trained using the HOVON (n = 344) HELP data after converting the HELP values to equivalent MELP scale values using Deming regression as previously described (17).
Informative loci were identified using a permutation-based method as described in the online Supplemental Methods. After identification of 17 informative loci, we trained a final random survival forest. The output of this random forest, designated as methylation score (M score), represents estimated risk associated with a given sample. A low M score corresponds to a long predicted survival while a high M score predicts shorter survival.
PERTURBATION ANALYSIS
To determine the effect of “failed” loci on the overall score function, we used a Monte Carlo perturbation approach. Briefly, we selected random subsets of 1, 2, 3, 5, or 10 loci to assess the effect of different numbers of “failed” loci. We then selected random samples from our 21 repeat samples, and for each subset of perturbed loci we replaced the values of each locus with a value for the same locus drawn randomly from the cohort of 207 UPenn samples. In this way, we generated a draw of random values that were biologically plausible but incorrect. This process was repeated 100 times for each number of perturbed loci.
Results
We have previously described the MELP assay and shown that it can quantitatively assess levels of DNA methylation at multiple loci (17). Briefly, this assay uses a methylation-insensitive restriction enzyme (MspI) along with its methylation-sensitive isoschizomer (HpaII) to create 2 differentially digested DNA aliquots. Linker-specific Taq-mediated PCR generates pools of amplicons in which relatively short, easily amplifiable products predominate. Amplicons are fluorescently labeled and hybridized to Luminex microspheres, which are then subjected to flow cytometry to quantify amplicon abundance at specific loci. For each sample, median fluorescent intensities (MFI) for each locus being interrogated are normalized to the mean MFI of 3 control unmethylated loci evaluated in the same reaction. Differential normalized signals from the MspI and HpaII digests at each locus are used to identify the level of methylation in the original sample DNA. Notably, this procedure is amenable to multiplexing, and we can successfully quantify >30 loci in a single Luminex experiment utilizing only 2 reaction tubes. Despite the utility of the MELP assay in its original form, our experiments indicated that several alterations could improve its suitability for clinical implementation.
DEVELOPMENT OF XMELP
To improve the turnaround time for clinical methylation assessment, we simplified the original MELP technique using a single base-pair substitution in the oligonucleotides used for linker ligation. In both the HELP and original MELP assays, ligating oligonucleotides to genomic DNA fragments recreates an HpaII/MspI site (17, 18). Because MspI is not heat labile, standard HELP requires a phenol-chloroform extraction to prevent redigestion of ligated products. By changing a single base pair (see Materials and Methods), we are able to maintain the 5′ overhang necessary for genomic DNA annealing while ensuring that the ligated products no longer contain an HpaII/MspI restriction site. With this subtle alteration, the restriction digestion and ligation of MELP can be combined into a single step, reducing the time required for performing MELP by a full day and significantly decreasing the amount of sample manipulation (Fig. 1A). This alteration of the MELP technique (referred to now as expedited MELP or xMELP) was employed to measure the methylation levels at 28 loci (Fig. 1B). The log2([HpaII]/[MspI]), normalized to the mean methylation level at 3 control loci, was determined using both MELP and xMELP, and results were highly correlated at all loci. Thus, we found xMELP to be a valid surrogate of standard MELP and used it in all subsequent analyses.
Fig. 1. Comparison of the standard MELP assay to xMELP.

(A), Schematic of standard MELP and xMELP. Alterations used in xMELP decrease both hands-on labor and turnaround time by a full day. (B), Comparison of methylation levels as measured by MELP and xMELP. DNA from 10 primary AML samples was subjected to both MELP and xMELP. Methylation levels at 28 loci, measured as log2([HpaII]/[MspI]) normalized to the mean methylation level at 3 control loci, was determined. Comparable methylation levels were obtained with the 2 methods at all loci examined. The 28 loci interrogated along with the 3 normalization loci are listed in online Supplemental Table 1.
QC AND REPRODUCIBILITY OF xMELP
We noted occasional xMELP samples showing low fluorescence signals across all loci, suggestive of either inadequate DNA quality (low MspI and HpaII signals) or failure of subsequent reactions (low MspI or HpaII signals). To address the need for a QC metric, we determined mean individual scores (HpaII or MspI) across all loci as a surrogate for global assay performance (Fig. 2A). We then examined the individual HpaII or MspI values obtained at 3 unmethylated control loci used to normalize our results. The low tail of the mean score distribution (Fig. 2A) was associated with control locus values <100 (Fig. 2, B and C). As a result, we established a QC cutoff of 3/3 control loci <100 (median intensity for Luminex analysis) that was used in subsequent analyses.
Fig. 2. QC of xMELP assay.
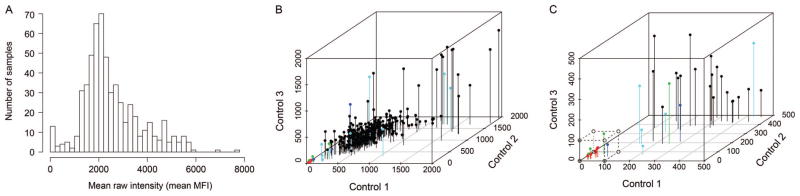
xMELP was performed on 207 primary AML samples (UPenn cohort). (A) After microsphere flow cytometry, mean MFI across 31 loci (listed in online Supplemental Table 1) was determined. Distribution of mean MFI is shown. The relatively large number of samples with low MFI indicates assay failure for these samples. (B), Comparison of MFI from 3 control loci and mean MFI for each sample is shown. MFI of the 3 control loci is plotted. Colors indicate mean MFI (red, ≤50; green, >50, dark blue ≤200, >200, ≤400; cyan >400, ≤800; black, >800). (C), Enlargement of the group of samples with low MFI of control loci. The dotted box indicates those samples for which the assay likely failed, corresponding to an MFI signal of <100 for each of the control loci.
To assess the precision of individual locus measurements, we performed xMELP on 21 frozen cellular aliquots of a single diagnostic bone marrow sample (Fig. 3). Loci used were a combination of the original prognostic group (n = 18) along with an additional 9 loci later identified as potentially prognostic (Materials and Methods) and another locus (β2-microglobulin) that was not found to be prognostic and is used as a negative control in later experiments. To assess intra-and interassay reproducibility, samples were run on 3 separate days (7 independent replicates/day). Because it is not appropriate to calculate %CV with log2-based scores extending below zero, we compared the reproducibility of replicates to the range of M scores measured across 207 AML samples. With the exception of 1 locus (MSPI0406S00697563), fluctuations in the replicate samples were small (median intraassay SD, 0.29; median interassay SD, 0.12) and were significantly less than the variation seen across all samples (median range, 9.4).
Fig. 3. Variability of xMELP-determined methylation levels.
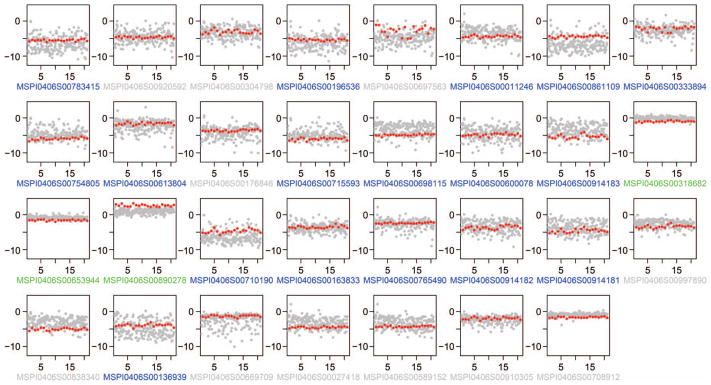
xMELP was performed on the entire primary AML UPenn cohort (n = 207) and on 21 aliquots of a single sample. Methylation levels, measured by log2([HpaII]/[MspI]), for each locus were determined and are shown. Red dots indicate 21 replicates of a single sample, and gray dots represent the ratios for all samples in the UPenn cohort in order to illustrate the range of biological variability. Loci included in the final xMELP classifier are in blue, loci not in the classifier are in gray, normalization loci are in green.
EXPANSION OF CANDIDATE LOCI FOR AML PROGNOSIS
Having established QC criteria and reproducibility parameters for individual loci, we next developed an improved classifier for AML prognosis. Similar to our previous work (17), we used MELP-correlated HELP values from the HOVON AML data set to train this classifier. In the current analysis, however, we used the full HOVON cohort rather than a subset. Further, in contrast to previous classifiers utilizing SuperPC analysis, we used a random forest method to exploit the robust properties of ensemble machine learning methods (26). We recently obtained robust classification results using a random forest classifier to segregate myeloid neoplasms from reactive conditions (27) and wished to utilize a similar approach for AML survival prediction.
To assess which of the 27 potential loci to include in our final model, we used a permutation-based technique (28) to select an informative subset. For each locus, the distribution (n = 5) of the variable importance score in the random forest model was compared with a control distribution (n = 50) derived using permuted data for the given locus. The same analysis was done for the β2-microglobulin locus, whose methylation status was not anticipated to contribute to outcome prediction. Results for each of the 27 loci are shown in Fig. 4A, and 17 loci were identified that have a true importance significantly greater than the control importance (corrected P value of <0.05, Fig. 4B). The final random forest classifier uses these 17 loci. Importantly, the single locus with poor precision characteristics (MSPI0406S00697563, Fig. 3) is not included in this model, nor is the β2-microglobulin locus (MSPI0406S00708912).
Fig. 4. Variable selection and random survival forest.

(A), A comparison of variable importance (x axis) is shown for 28 loci (listed in online Supplemental Table 1). Distributions of importance scores from independently trained random forests on the original data are shown in green; control distributions derived from perturbation analysis are shown in white. Green bars (original values) are not seen for loci in which near complete overlap of original and permuted values is observed. Loci with original > permuted scores (P <0.05) were retained for the final model. (B), 17 retained loci from (A). (C), Error rate (left) and final variable importance (right) for 17 loci in the final 1000-tree random survival forest classifier.
The predictive score generated by this random forest survival classifier reflects patient risk and therefore increases with poorer prognosis (29). To assess the precision of this aggregate prognostic indication, we used the 21 replicate samples to generate an overall a risk score (Fig. 5A). Variation in intrasample score is small compared to the intersample distribution among the 207 UPenn AML samples (overall precision, 14.8% CV; intraassay precision, 13.6% CV; interassay precision, 7.4% CV). Additionally, 6 samples were independently processed and assayed in duplicate; methylation risk scores for all were highly reproducible (Fig. 5B).
Fig. 5. Variability of the overall M score.

(A), M scores for the entire primary AML UPenn cohort (gray dots) and for 21 replicates of a single primary AML sample (red dots) are shown. Variability of M score in the replicates is minimal compared to variability of M scores across the entire UPenn cohort. (B), M scores of 6 duplicate samples. Line of unity is shown. (C), Effect of Ficoll centrifugation and freezing on M scores. DNA from 5 primary AML bone marrow aspirates was isolated prior to Ficoll centrifugation (no Ficoll), after Ficoll centrifugation (fresh), and after both Ficoll centrifugation and cryopreservation in DMSO-containing media (frozen). Comparison of M scores for these samples is shown along with the line of unity. A single fresh sample failed QC (Fig. 2), so only 4 samples are shown for plots that include fresh samples. (D) Effect of normal DNA contamination on M scores. DNA from 2 primary AML white blood cell (WBC) samples was diluted with varying amounts DNA from normal peripheral blood. M scores for each dilution are indicated (blue and red dots). M scores of the entire primary AML UPenn cohort (gray dots) are shown as a comparison of the variability across AML samples. E) Robustness analysis of M score with random locus perturbation. For reference, the bottom of the Fig. shows the range of tertiles of M score seen in 70 patients from the UPenn cohort (see Fig. 6).
Because the prognostic results of xMELP are obtained from mononuclear AML blasts that have been enriched by Ficoll gradient centrifugation and then frozen, and because most clinical samples are not subjected to Ficoll enrichment or freezing before processing, we sought to determine the effects that these 2 procedures would have on xMELP-derived M scores. For this analysis, we obtained multiple fresh bone marrow samples from 5 newly diagnosed AML patients. xMELP was performed on DNA extracted at 3 points: (a) before any manipulation (“no Ficoll”), (b) after Ficoll centrifugation (“fresh”), and (c) after both Ficoll centrifugation and freezing in cryopreservation media (“frozen”). One fresh, Ficoll-purified sample was eliminated owing to QC failure. As shown in Fig. 5C, scores among the 3 types of cellular manipulations are similar, implying that fresh marrow samples are appropriate for xMELP analysis.
These results were somewhat surprising, because we considered that maturing granulocytes in the un-manipulated samples might significantly alter the M score. We therefore sought to determine the minimal blast percentage for which xMELP is valid. We combined varying ratios of genomic DNA from primary AML samples with DNA from normal peripheral blood and performed xMELP on these mixtures. A 75:25 mixture of leukemic:normal DNA retains a similar M score to that of the leukemic sample alone, whereas a 50:50 ratio shows a substantial deviation (Fig. 5D).
Because the amount of DNA that can be obtained from marrow or peripheral blood samples can be highly variable, we also determined the total amount of DNA required for xMELP to yield valid results. We serially diluted DNA from AML samples and performed xMELP on the dilutions. All dilutions for 1 sample showed similar M scores, whereas significant deviations of M scores for a second sample were seen with approximately 20 ng of DNA (see online Supplementary Fig. 1).
One advantage of predictors from multiplex measurements is that the aggregate score may be robust even if a subset of individual components is perturbed. To explore this possibility, we compared the effect of a simulated “failure” of 1, 2, 3, 5, or 10 components to the inherent score variation observed in our 21 replicates. To assess the effect of values that are plausible but wrong, we selected a random replicate from the 21 available, selected a random subset of j loci (j = 1, 2, 3, 5, 10), and replaced the value at that locus with another value randomly chosen from the cohort of 207 UPenn samples. This process was repeated 100 times for each value of j. Given that our replicate sample has a low risk score relative to most other samples, this analysis should provide a conservative estimate of the effects of perturbing our assay, because it is less likely that multiple perturbations will “offset” each other. As expected, the score distribution shifts higher toward the population mean when the number of perturbed loci (j) is increased (Fig. 5E). However, the overall distribution is relatively stable compared with true replicates if a single locus “fails,” suggesting that multiplex analysis provides some buffer against changes in the methylation risk score due to analytical problems at a single locus.
VALIDATION IN AN INDEPENDENT SAMPLE COHORT
Having demonstrated that our assay is reproducible and robust in the presence of defined preanalytical variables, we tested its ability to predict survival in a cohort of samples from 70 AML patients (subset of the 207 tumor samples) for which we obtained overall survival data. Because our classifier was trained on the HOVON data, this UPenn data set represents an entirely independent cohort. xMELP-derived methylation risk scores were determined and samples were sorted into tertiles. Survival analysis showed a highly significant difference between methylation risk score–based cohorts (Fig. 6, P = 0.009), demonstrating the clinical validity of this assay. Taken as a whole, these results strongly suggest that xMELP can predict outcomes of patients with AML in 2 completely independent sets of AML samples (HOVON for training, UPenn for testing) and that xMELP may have clinical utility for AML prognostication.
Fig. 6. Outcome analysis based on M scores.

Using the random forest trained on the HOVON data set, M scores were determined for 70 primary AML samples from the UPenn cohort. Samples were ranked by M score and divided into tertiles. Overall survival for each tertile is plotted (red, lowest M score group, n = 24; blue, middle M score group, n = 23; green, highest M score group, n = 23; P = 0.009, log-rank test). Prob, probability.
Discussion
We previously used MELP to assess DNA methylation in select loci and showed that—at the individual locus level—the assay is specific for the loci of interest, linear over a 3-log range of signal intensity, as quantitative as methods involving real-time PCR, and capable of recapitulating levels of DNA methylation determined by the HELP assay and MassArray Epityper assay (17). These results, coupled with the relatively standard techniques and instrumentation employed, suggested that MELP could be a useful clinical assay for methylation assessment of AML and other diseases.
We have now expanded on the previous study by significantly improving the techniques and analysis, characterizing assay performance (including precision), establishing QC parameters, and demonstrating the predictive potential of xMELP in an independent set of AML samples. Our results further the argument that xMELP can be used in a clinical laboratory setting for determination of prognosis in patients with AML.
With the development of xMELP, we substantially improved the assay technique, the loci used, and the method of analysis. A single base-pair change in primers significantly reduces the amount of hands-on work required for the assay and decreases the turnaround time by a full day. The entire xMELP assay can now be performed in 2 days, well within the optimal temporal window between AML diagnosis and treatment initiation. We showed that xMELP yields virtually identical results regardless of Ficoll blast enrichment, indicating the sample typically received in a clinical lab—unmanipulated bone marrow aspirate—is adequate for xMELP analysis. Dilution experiments with normal DNA indicate that a 25% dilution with normal DNA does not significantly alter methylation risk score, so a 75% blast count may be taken either as a cutoff for assay validity or as an indication that blasts should be enriched by Ficoll centrifugation. This criterion, however, may be too stringent, because methylation patterns of nonblast cells may not be identical to those found in normal peripheral blood cells. Similarly, DNA dilution results suggest that 50 ng may be an optimal, albeit stringent, cutoff for the total amount of DNA required for analysis.
The composite, multilocus analysis of MELP data uses a random forest classifier to determine the methylation risk score. In our analysis of the MELP data, we tried several multiple-variable analytic approaches, including the SuperPC algorithm used in the original HELP/MELP analysis of AML (6, 17, 30), and found that the random forest method yielded robust results. Further, the multiplex classifier retains its predictive value even if a single locus yields an erroneous result.
Assay precision both at the individual locus level and in terms of overall methylation risk is likely sufficient for clinical use. Compared to intersample variation across 207 samples, the intrasample variability is minimal at most loci, including those included in the 17-locus classifier. Formal testing of methylation risk score variation using 21 replicates of the same sample shows a %CV of approximately 15%, and additional experiments showed little variation in duplicates of 6 samples. Importantly, when we divide the UPenn AML cohort into prognostic tertiles, 5/6 replicates are found within the same tertile. Overall, our results indicate a high level of confidence associated with xMELP-based risk score.
Because we obtained an AML cohort (UPenn samples) that is entirely independent of the original HOVON cohort, we used the full HOVON set to train our methylation-based classifier. This scenario is distinct from previous work in which the HOVON dataset was randomly divided into training and test subsets (6, 17). The addition of samples to the training set, along with reanalysis of HELP data for additional informative loci, the elimination of uninformative loci, and the use of the random forest algorithm, further optimized the xMELP risk score. Importantly, testing the xMELP AML risk score on a subset of the UPenn samples for which we currently have outcome data clearly shows that xMELP can segregate AML patients with distinct outcomes. Although preliminary, our xMELP results identify a subset of patients with very aggressive disease for whom standard chemotherapy is likely not beneficial, and for whom alternative treatments, such as up-front bone marrow transplant or experimental regimens, may be warranted. Additionally, the risks of subjecting patients with favorable M scores to aggressive therapies may outweigh the benefits, so these treatment protocols may not be appropriate for this cohort. Further studies will attempt to develop an integrated, multivariate prognosis classification scheme for AML that uses all available factors currently known to influence prognosis to guide clinical management of AML patients.
The prognostic power of our current classifier, as well as assay reproducibility, rapid turnaround time, and technical simplicity, demonstrate the suitability of xMELP for analysis of AML samples in a clinical setting. Given its general applicability, xMELP warrants further exploration for other diseases in which DNA methylation patterns predict clinical outcomes.
Acknowledgments
Research Funding: G.B.W. Wertheim, pilot project grant from the Perelman School of Medicine Hematologic Malignancies Translational Center of Excellence, grant IRG-78-002-35 from the American Cancer Society, and National Institutes of Health (1R21CA185365-01); M. Carroll, National Institutes of Health (1R21CA185365-01 and 1R01CA149566-01A1), Veterans Affairs Administration (1I01BX000918-01), and 5R21CA185365-02 (PDQ5) Integrated Genetic and Epigenetic Prognostication for Acute Myeloid Leukemia; S.R. Master, National Institutes of Health (1R21CA185365-01).
Footnotes
Nonstandard abbreviations: AML, acute myeloid leukemia; HELP, HpaII small fragment Enrichment by Ligation-mediated PCR; MELP, Microsphere HELP; xMELP, expedited MELP; NEB, New England Biolabs; HOVON, Dutch-Belgian Hemato-Oncology Cooperative Group; SuperPC, supervised principal components; UPenn, University of Pennsylvania; M-score, methylation score; MFI, median fluorescent intensity.
Author Contributions: All authors confirmed they have contributed to the intellectual content of this paper and have met the following 3 requirements: (a) significant contributions to the conception and design, acquisition of data, or analysis and interpretation of data; (b) drafting or revising the article for intellectual content; and (c) final approval of the published article.
Authors’ Disclosures or Potential Conflicts of Interest: Upon manuscript submission, all authors completed the author disclosure form. Disclosures and/or potential conflicts of interest:
Employment or Leadership: None declared.
Consultant or Advisory Role: None declared.
Stock Ownership: None declared.
Honoraria: None declared.
Expert Testimony: None declared.
Patents: G.B.W. Wertheim, provisional patent application 62/040,821; M. Carroll, provisional patent application 62/040,821; S.R. Master, provisional patent application 62/040,821.
Role of Sponsor: The funding organizations played no role in the design of study, choice of enrolled patients, review and interpretation of data, or preparation or approval of manuscript.
References
- 1.Hanahan D, Weinberg RA. Hallmarks of cancer: the next generation. Cell. 2011;144:646–74. doi: 10.1016/j.cell.2011.02.013. [DOI] [PubMed] [Google Scholar]
- 2.Vogelstein B, Kinzler KW. The multistep nature of cancer. Trends Genet. 1993;9:138–41. doi: 10.1016/0168-9525(93)90209-z. [DOI] [PubMed] [Google Scholar]
- 3.Watson IR, Takahashi K, Futreal PA, Chin L. Emerging patterns of somatic mutations in cancer. Nat Rev Genet. 2013;14:703–18. doi: 10.1038/nrg3539. [DOI] [PMC free article] [PubMed] [Google Scholar]
- 4.Baylin SB, Jones PA. A decade of exploring the cancer epigenome: biological and translational implications. Nat Rev Cancer. 2011;11:726–34. doi: 10.1038/nrc3130. [DOI] [PMC free article] [PubMed] [Google Scholar]
- 5.Noushmehr H, Weisenberger DJ, Diefes K, Phillips HS, Pujara K, Berman BP, et al. Identification of a CpG island methylator phenotype that defines a distinct subgroup of glioma. Cancer Cell. 2010;17:510–22. doi: 10.1016/j.ccr.2010.03.017. [DOI] [PMC free article] [PubMed] [Google Scholar]
- 6.Figueroa ME, Lugthart S, Li Y, Erpelinck-Verschueren C, Deng X, Christos PJ, et al. DNA methylation signatures identify biologically distinct subtypes in acute myeloid leukemia. Cancer Cell. 2010;17:13–27. doi: 10.1016/j.ccr.2009.11.020. [DOI] [PMC free article] [PubMed] [Google Scholar]
- 7.Bullinger L, Ehrich M, Döhner K, Schlenk RF, Döhner H, Nelson MR, van den Boom D. Quantitative DNA methylation predicts survival in adult acute myeloid leukemia. Blood. 2010;115:636–42. doi: 10.1182/blood-2009-03-211003. [DOI] [PubMed] [Google Scholar]
- 8.Alvarez S, Suela J, Valencia A, Fernández A, Wunderlich M, Agirre X, et al. DNA methylation profiles and their relationship with cytogenetic status in adult acute myeloid leukemia. PLoS One. 2010;5:e12197. doi: 10.1371/journal.pone.0012197. [DOI] [PMC free article] [PubMed] [Google Scholar]
- 9.Borssén M, Palmqvist L, Karrman K, Abrahamsson J, Behrendtz M, Heldrup J, et al. Promoter DNA methylation pattern identifies prognostic subgroups in childhood T-cell acute lymphoblastic leukemia. PLoS One. 2013;8:e65373. doi: 10.1371/journal.pone.0065373. [DOI] [PMC free article] [PubMed] [Google Scholar]
- 10.Nordlund J, Bäcklin CL, Wahlberg P, Busche S, Berglund EC, Eloranta ML, et al. Genome-wide signatures of differential DNA methylation in pediatric acute lymphoblastic leukemia. Genome Biol. 2013;14:r105. doi: 10.1186/gb-2013-14-9-r105. [DOI] [PMC free article] [PubMed] [Google Scholar]
- 11.Sandoval J, Mendez-Gonzalez J, Nadal E, Chen G, Carmona FJ, Sayols S, et al. A prognostic DNA methylation signature for stage I non-small-cell lung cancer. J Clin Oncol. 2013;31:4140–7. doi: 10.1200/JCO.2012.48.5516. [DOI] [PubMed] [Google Scholar]
- 12.Wei SH, Balch C, Paik HH, Kim Y-S, Baldwin RL, Liyanarachchi S, et al. Prognostic DNA methylation biomarkers in ovarian cancer. Clin Cancer Res. 2006;12:2788–94. doi: 10.1158/1078-0432.CCR-05-1551. [DOI] [PubMed] [Google Scholar]
- 13.Sigalotti L, Covre A, Fratta E, Parisi G, Sonego P, Colizzi F, et al. Whole genome methylation profiles as independent markers of survival in stage IIIC melanoma patients. J Transl Med. 2012;10:185. doi: 10.1186/1479-5876-10-185. [DOI] [PMC free article] [PubMed] [Google Scholar]
- 14.Jiang D, Hong Q, Shen Y, Xu Y, Zhu H, Li Y, et al. The diagnostic value of DNA methylation in leukemia: a systematic review and meta-analysis. PLoS One. 2014;9:96822. doi: 10.1371/journal.pone.0096822. [DOI] [PMC free article] [PubMed] [Google Scholar]
- 15.Esteller M, Garcia-Foncillas J, Andion E, Good-man SN, Hidalgo OF, Vanaclocha V, et al. Inactivation of the DNA-repair gene MGMT and the clinical response of gliomas to alkylating agents. N Engl J Med. 2000;343:1350–4. doi: 10.1056/NEJM200011093431901. [DOI] [PubMed] [Google Scholar]
- 16.Chatterton Z, Burke D, Emslie KR, Craig JM, Ng J, Ashley DM, et al. Validation of DNA methylation biomarkers for diagnosis of acute lymphoblastic leukemia. Clin Chem. 2014;60:995–1003. doi: 10.1373/clinchem.2013.219956. [DOI] [PubMed] [Google Scholar]
- 17.Wertheim GBW, Smith C, Figueroa ME, Kalos M, Bagg A, Carroll M, Master SR. Microsphere-based multiplex analysis of DNA methylation in acute myeloid leukemia. J Mol Diagn. 2014;16:207–15. doi: 10.1016/j.jmoldx.2013.10.010. [DOI] [PMC free article] [PubMed] [Google Scholar]
- 18.Figueroa ME, Melnick A, Greally JM. Genome-wide determination of DNA methylation by Hpa II tiny fragment enrichment by ligation-mediated PCR (HELP) for the study of acute leukemias. Methods Mol Biol. 2009;538:395–407. doi: 10.1007/978-1-59745-418-6_20. [DOI] [PubMed] [Google Scholar]
- 19.King RL, Naghashpour M, Watt CD, Morrissette JJD, Bagg A. A comparative analysis of molecular genetic and conventional cytogenetic detection of diagnostically important translocations in more than 400 cases of acute leukemia, highlighting the frequency of false-negative conventional cytogenetics. Am J Clin Pathol. 2011;135:921–8. doi: 10.1309/AJCPJCW6BY0CNIHD. [DOI] [PubMed] [Google Scholar]
- 20.Bertoli S, Bérard E, Huguet F, Huynh A, Tavitian S, Vergez F, et al. Time from diagnosis to intensive chemotherapy initiation does not adversely impact the outcome of patients with acute myeloid leukemia. Blood. 2013;121:2618–26. doi: 10.1182/blood-2012-09-454553. [DOI] [PubMed] [Google Scholar]
- 21.R Core Team. R: a language and environment for statistical computing. R Foundation for Statistical Computing; Vienna, Austria: 2013. [Accessed Month Year]. http://www.R-project.org/ [Google Scholar]
- 22.Therneau T. A package for survival analysis in S. [Accessed Month Year];R package version 2.37–7. 2014 http://CRAN.R-project.org/package3survival.
- 23.Carstensen R, Gurrin L, Ekstrom C, Figurski M. MethComp: Functions for analysis of agreement in method comparison studies. [Accessed Month Year];R package version 1.22. 2013 http://CRAN.R-project.org/package3MethComp.
- 24.Ligges U, Machler M. Scatterplot3d–an R package for visualizing multivariate data. J Stat Soft. 2003;8:1–20. [Google Scholar]
- 25.Ishwaran H, Kolalur UB. Random forests for survival, regression and classification (RF3SRC) [Accessed Month Year];R package version 1.4. 2013 http://CRAN.R-project.org/package3randomForestSRC.
- 26.Hastie T, Tibshirani R, Friedman J. The elements of statistical learning: data mining, inference, and prediction. New York: Springer; 2009. [Google Scholar]
- 27.Raess PW, van de Geijn GJ, Njo TL, Klop B, Sukhachev D, Wertheim G, et al. Automated screening for myelodysplastic syndromes through analysis of complete blood count and cell population data parameters. Am J Hematol. 2014;89:369–74. doi: 10.1002/ajh.23643. [DOI] [PubMed] [Google Scholar]
- 28.Hapfelmeier A, Ulm K. A new variable selection approach using Random Forests. Comp Stat Data Anal. 2013;60:50–69. [Google Scholar]
- 29.Ishwaran H, Kogalur UB, Blackstone EH. Random survival forests. Ann Appl Stat. 2008;2:841–60. [Google Scholar]
- 30.Hastie T, Paul D, Tibshirani R. Prediction by supervised principal components. J Am Stat Assoc. 2006;101:119–37. [Google Scholar]