

Abstract
Selecting the best available preventive and therapeutic measures to avoid disability and death is an important goal for all health care practitioners. To achieve this goal, we need to perform studies that determine the value of these measures. In this article, we discuss the possible study designs that can be used for evaluating new approaches to prevention and treatment. The gold standard study design is a randomized, controlled, double-blind trial. In many instances, a randomized controlled trial may not be ethically or practically feasible. Other study types, such as case series, case-control studies, cohort studies, cross-sectional studies, crossover designs, and open-label studies, may be required to hypothesize and evaluate the link between an exposure or predictor variable and an outcome variable. Various study types pertaining to neonatal-perinatal medicine are reviewed in this article.
Objective
After completing this article the readers should be able to:
Describe various study designs and their strengths and limitations.
Introduction
This article provides a brief overview of principles of epidemiology and clinical research design and covers all the topics required by the American Board of Pediatrics content outline pertaining to study types (and uses the same alphabetical numbering in the content outline) and systematic reviews. The reader is referred to other review books listed in the Suggested Reading section for a complete understanding of study types and epidemiology. (1)(2)(3)(4)(5)
1) Study Types
-
Clinical trials (Figure 1; also an infographic at http://www.fda.gov/downloads/Drugs/ResourcesForYou/Consumers/UCM284393.pdf):
Preclinical: The first step in development of a new drug is bench research using tissue cultures or animal models. Information on mechanism of action, efficacy, toxicity, pharmacokinetics, and pharmacodynamics is obtained from these studies.
The drug sponsor (eg, a pharmaceutical company) applies an Investigational New Drug Application to the Food and Drug Administration (FDA). After approval is obtained from the FDA, the sponsor and principal investigator plan human trials.
Phase I trial: This phase emphasizes safety. It typically involves 20 to 80 healthy volunteers. Occasionally, drugs that cause adverse effects may be evaluated in patients with end-stage disease (eg, anticancer drugs). Information on the drug’s most frequent adverse effects, drug metabolism, and excretion are obtained from phase I studies.
Phase II trial: The goal of phase II trials is to obtain preliminary data on whether the drug works in patients who have a certain disease or condition. It typically involves hundreds of patients. In controlled trials, patients receiving the drug are compared with patients receiving a different treatment (usually a placebo or a different drug). Safety continues to be evaluated, and short-term adverse effects are studied.
Phase III trial: Phase III trials typically involve hundreds or thousands of patients and gather more information on safety and efficacy.
New Drug Application review: If the phase III trial is successful, the sponsor applies for an NewDrug Application to the FDA. This process includes a review of the proposed professional labeling and inspection of the manufacturing facility. If the review is favorable, the FDA may approve the drug for marketing.
Phase IV or postmarketing surveillance: This surveillance is performed by the sponsor (typically the manufacturer), who submits periodic safety updates to the FDA. The MedWatch voluntary system enables physicians and consumers to report adverse events. If important risks are uncovered, risks are added to prescribing information, and drug use may be limited, or in rare instances the drug may be withdrawn from the market.
Retrospective study: A retrospective study uses existing data that have been recorded for nonresearch (such as a clinical database) purposes. The baseline measurements and follow-up, including the exposure and the outcome, have all occurred in the past. The investigator starts at the time of exposure and selects a cohort of patients with the exposure and a comparable cohort without the exposure. Available medical records are used to follow up these patients to evaluate the probability of outcome in the cohort with exposure compared with those without. Patients in the 2 groups are matched based on baseline characteristics so that the risk of outcome is the same in the exposed and control groups except for the exposure of interest.
-
Strengths and limitations of retrospective studies: The main advantages of studies using existing data are speed and cost. A retrospective analysis of an association between caffeine and necrotizing enterocolitis (NEC) can be conducted in a few months using a neonatal intensive care unit (NICU) database with minimal expense. (6)
-
Strengths:
Answers can be obtained rapidly (speed).
Relatively inexpensive (cost).
-
Weaknesses:
The investigator has no control over data collected. The existing data may be incomplete, inaccurate, or measured in ways that are not ideal for answering a research question. If the clinician has erroneously diagnosed a case of focal, spontaneous intestinal perforation as NEC in the NICU database, the investigator conducting a retrospective analysis of this database may assume the patient had NEC.
It is difficult to ensure that the exposed and control groups have the same risk of outcome (other than the exposure). In addition to known baseline characteristics for which the exposed and control groups are matched, there may be unknown prognostic factors that are unevenly distributed in the 2 groups contributing to the outcome.
Bias may be due to many factors. For example, selection bias or detection bias may lead to a spurious association between the predictor variable and outcome in the study sample that does not exist in the population.
Confounding identifies real associations in the population, but these associations are not causal in the direction of interest.
Loss to follow-up may influence results.
-
Case series: Case reports and series are helpful in recognizing and describing new disease processes or rare manifestations and identify emerging health conditions. (7) A case series of the first 1000 patients with AIDS reported that 727 were homosexual or bisexual males and 236 were injection drug users. (8) It did not require a formal control group to conclude that these groups were at higher risk. (3)
-
Strengths and limitations of case series:
-
Strengths:
Help describe rare manifestations and new diseases.
Identify emerging health conditions.
Better suited to describing the characteristics of the disease than identify causality.
-
Limitations:
Purely descriptive and considered to be the weakest form of evidence.
Misleading and may suggest a plausible causal relationship where none exists in real population.
-
Cross-sectional study: The investigator makes all of his/her measurements at a single point in time or within a short period. (3) For example, the association between systemic blood pressure and postmenstrual age can be evaluated in a cross-sectional study in the NICU.
-
Strengths and limitations of cross-sectional studies (9):
-
Strengths:
Prevalence estimation is the proportion of patients who have a disease or condition at one point in time. The relative prevalence of feeding intolerance among human milk–fed preterm infants can be compared with formula-fed preterm infants.
There is no waiting around for the outcome to occur (fast and inexpensive).
Avoids the problem of loss to follow-up.
A cross-sectional study conducted at the beginning of a cohort or clinical trial provides demographic and clinical characteristics at baseline.
-
Weaknesses:
Cannot estimate incidence (the proportion who develop a disease or condition over time).
Difficult to establish causal relationship (risk of possible spurious associations).
Impractical for the study of rare diseases and requires a large sample size.
-
Case-control study: The investigator works backwards and begins by choosing a sample of patients with the outcome (eg, NEC patients or cases) and another group of individuals without the outcome (controls; Figure 2). The outcome variable is chosen first, and the exposure (levels of predictor variable; –eg, human milk vs formula feeding) is evaluated in cases vs controls to see whether there is an association between exposure and outcome.
-
Strengths and limitations of case-control study (10):
-
Strengths:
Relatively inexpensive because of smaller sample sizes.
Because the cases are chosen at the beginning of the study, rare outcomes can be studied using a relatively small sample size (eg, prone vs supine sleeping and sudden infant death syndrome).
Multiple etiologic factors (antibiotic use, histamine2-blocker use, and human milk intake) and predictor variables can be studied. Case-control studies are useful for generating hypotheses about the causes of an outcome variable.
-
Limitations:
Low internal validity (data collection is based on event recall).
High chance of bias because of separate sampling of cases and controls and retrospective measurement of various predictor variables.
Cannot estimate incidence or prevalence.
Only one outcome can be studied, whereas cohort and cross-sectional studies can evaluate multiple outcome variables.
-
Longitudinal study (9): In longitudinal studies, a group of individuals are identified at the outset and are followed up over time. Data collection occurs at repeated predetermined intervals. Cohort studies and repeated cross-sectional studies are longitudinal studies.
-
Strengths and limitations of longitudinal studies:
-
Strengths:
Determine causality.
Monitor trends.
-
Limitations:
Time-consuming.
Expensive.
-
Cohort study: In a prospective cohort study, patients are identified at the beginning of the study based on their exposure status (exposed or not exposed) and followed up for a period from exposure to outcome (Figure 3). (11) Preterm infants exposed to formula and not exposed to formula (exclusively human milk fed) are followed up over time to detect the prevalence of asthma during the first 10 years (outcome). The exposure is self-selected or determined (mother’s decision and/or availability of human milk or formula feed). This is in contrast to randomized trials in which the investigator randomly allocates the exposure (Figure 4). Cohort studies can be prospective or retrospective (see below).
-
Strengths and limitations of a prospective cohort study:
-
Strengths:
Can measure incidence.
Establish temporal association (and strengthens the basis of inferring a causal basis of an association).
Good for common diseases.
Good for rare exposures.
Possible to study associations of an exposure (human milk feeds) with several outcome variables (eg, asthma, neurodevelopmental outcome, and obesity). (12)
-
Limitations:
Expensive because of large sample size and long follow-up.
Not good for rare diseases.
Confounding factors (factors other than the exposure that might influence the outcome).
-
A number of potential biases must be taken into account in conducting cohort studies. (12)
Bias in assessment of the outcome: the pediatrician making the diagnosis of asthma in an infant born preterm knows the history of exposure to infant formula and is aware of the hypothesis being tested.
Information bias or recall bias: the quality of information obtained from exposed (formula fed) and unexposed (exclusively breastfed) preterm infants may be different. A difference in educational background of the mother may alter ability to recall and provide accurate information.
Biases from lack of response due to loss to follow-up.
Analytic bias: epidemiologists and statisticians may have a strong preconception that breast milk is protective against asthma.
-
Retrospective cohort studies (Figure 3): Some of the above limitations, such as duration of follow-up and cost, associated with prospective cohort studies may be reduced by conducting retrospective cohort studies. Instead of prospectively following up preterm infants born in 2014 for 10 years to evaluate risk of developing asthma, investigators may decide to evaluate preterm infants born in 2004. The study design for a cohort remains the same: preterm infants exposed and unexposed to formula based on historical data are combined with outcome (asthma) from present data.
The advantage of the retrospective cohort design is that it is less expensive and fast. The baseline measurements are already made, and the follow-up period is complete.
The main disadvantages are limited control over the approach to sampling and follow up of the population and over the nature and quality of baseline measurements. The existing data may be incomplete, inaccurate, or measured in ways that are not ideal for answering the research question. (3)
-
-
Randomized controlled study: In a clinical trial, the investigator applies an intervention and observes the effect on one of more outcomes (Figure 4).
Random assignment is expected to equally allocate all known and unknown predictor variables in the 2 groups, creating 2 groups with similar prognosis on average. The patients are placed into 2 categories: intervention group (receiving the active treatment, eg, donor human milk) and control group (receiving usual care or inactive treatment, eg, formula feeds). This example illustrates the fact that randomization is not possible in all circumstances. It is not ethically and practically possible to randomize breastfeeding and formula feeding among preterm infants.
-
Blinding (also known as masking, especially in ophthalmologic trials) is the process of ensuring that patients and/or investigators (double-blind) are unaware of the group. In addition to data collectors, outcome adjudicators and data analysts may also be blinded to treatment allocation. Blinding is achieved by use of placebo pills or infusions. Blinding reduces the chance of confounding by postrandomization, co-intervention variables (such as rapid rate of feed volume advancement in donor milk group compared with formula group). In some instances, blinding may not be possible. Two such examples are as follows:
Fetal tracheal occlusion is an intervention to improve lung size in congenital diaphragmatic hernia. However, fetal sham surgery increases the risk of preterm labor and is not ethical. Hence, the control group may not undergo a sham surgery.
In some cases, blinding is not technically possible. In the cooling trial evaluating infants with moderate to severe encephalopathy, allocation is not blinded because the clinical team and parents can easily assess the infant’s temperature.
Inclusion criteria should produce a sufficient number of participants (large sample size of very low birth weight [VLBW] infants) who have a high enough rate of primary outcome (death or neurodevelopmental disability) to achieve adequate power to find a clinically significant effect of the intervention on outcome.
Blocked randomization is a technique to ensure that the number of participants is equally distributed among the study groups. In a study that involves 60 participants, the block size may be 6. Randomization proceeds normally within each block of 6 until 3 VLBW infants are randomized to donor milk or formula group, after which participants are automatically assigned to the other group until the block of 6 is completed. This way the maximum disproportion of allotment of infants to the donor milk and formula groups at a given time will be 3 or less (eg, after enrolling 33 patients, 18:15).
Stratification of participants by a characteristic (such as gestational age or birth weight group, eg, ≤1,000 g vs 1,001–1,500 g) allows investigators to enroll a desired number of participants with a characteristic that may have an influence on the effect of the treatment or its generalizability.
Stratified blocked randomization ensures that an important predictor of the outcome (birth weight and gestational age influence the combined outcome of death and neurodevelopmental disability) is more evenly distributed between the study groups than chance alone would dictate.
Pragmatic clinical trials are randomized controlled trials that are designed to determine the risks, benefits, and costs of an intervention as they would occur in routine clinical practice. They include less restrictive inclusion criteria, a broader range of patients, and many clinical sites (including nonacademic sites) to simulate real-world settings.
-
Strengths and limitations of randomized controlled trials (3):
-
Strengths:
Ability to demonstrate causality—a properly designed randomized, blinded trial can provide the most definitive causal inference of all study designs.
Minimizes the influence of confounding variables.
More than one outcome can be measured —usually a single primary outcome and a few secondary outcomes can be evaluated.
-
Limitations:
Time-consuming and expensive.
May expose participants to potential harm.
Not every research question is amenable to randomized study design. For example, as mentioned above, the study depicted in Figure 3 cannot be performed because breastfeeding is a personal choice. A similar study can be performed among preterm infants without access to maternal breast milk, randomizing these infants to donor human milk or formula (Figure 4).
To ethically conduct a randomized controlled trial, equipoise must exist between the investigative arm and the control arm. Equipoise is a situation in which it is not known which of the 2 possibilities (eg, donor milk or formula) is more likely to achieve the outcome variable (neurodevelopmental outcome at 2 years).
The patients enrolled in a randomized controlled trial may not fully represent the target population for the intervention.
-
Before-after study design (historical controls) (12): If randomization is not possible or will not be used, one possible study design is to compare people who received care before a program was established (donor milk availability for VLBW infants in a NICU) with those who received care after the program or health care measure became available on the outcome variable (incidence of NEC).
-
Strengths and limitations of before-after studies:
-
Strengths:
Inexpensive and fast.
Provide suggestion (although not conclusive) demonstrating the effectiveness of a health care intervention.
-
Limitations:
Data obtained in each of the 2 periods are frequently not comparable in terms of quality or completeness. Often data collected after implementing the program is complete and of research quality. However, data collected before program implementation is from health care records designed and used only for clinical purposes.
Other factors may have changed over time. The NICU may have instituted a bronchopulmonary dysplasia (BPD) prevention bundle or a central catheter–associated bloodstream infection bundle that may have an effect on primary outcome variable (NEC).
-
-
Crossover study: Study designs typically are between group (parallel) comparisons (Figure 4) or within group comparison (eg, incidence of feeding intolerance before and after starting fortification). The crossover design has features of within- and between-group designs. In addition to planned crossover design, patients may also cross over in parallel design trials (unplanned crossover).
Unplanned crossover and intention to treat (12): Figure 5 shows the design of a randomized trial of Nissen fundoplication, comparing it with medical therapy for gastroesophageal reflux disease. Randomization is performed after informed consent is obtained. Some parents of infants assigned to Nissen fundoplication may have second thoughts after randomization and refuse surgery. In addition, some patients assigned to medical therapy may deteriorate and require Nissen fundoplication. This is called unplanned crossover. Ideally, analysis is performed on the basis of intent to treat: patients assigned to the surgical arm at randomization are analyzed as the surgical group (although some patients did not get surgery), and patients randomized to medical arm are analyzed as the medical group (although some patients had surgery).
Planned crossover study (Figure 6): Preterm VLBW infants receiving full expressed breast milk feeds are randomized to standard fortification to 24 kcal/oz with liquid human milk fortifier (group A) or fortification with medium chain triglyceride (MCT) oil to same caloric density (group B). The primary outcome variable is daily weight gain. After 1 week, fortification is stopped in both groups for a week (washout period so that carryover effects of one fortifier to the other group are avoided). After 1 week of the washout period, group B is fortified with liquid fortifier, and group A is fortified with MCT oil (crossover period). Weight gain is compared between groups (A vs B) and also within each group (Figure 6).
-
Strengths and limitations of crossover studies:
Planned crossover studies are attractive and useful because they evaluate within-group and between-group comparisons (Figure 6). Crossover design removes between-patient variation and requires fewer patients.
-
Limitations of planned crossover:
Valid only if there is no residual carryover from the first therapy.
Not applicable if the therapy is surgical or if it cures the disease.
Washout period may deprive the patient of a useful therapy (such as fortification).
Order in which therapy is given may elicit psychological responses and difference in physiologic maturity with increasing postnatal age may influence response.
Open-label study is a type of clinical trial in which the researchers and participants (or parents) know which treatment is being administered. This contrasts with single-blind and double-blind designs. An open-label study may still be randomized.
-
Strengths and limitations of open-label studies:
Strengths: A blinded trial is not possible in certain circumstances involving surgery (abdominal drain vs laparotomy for NEC or intestinal perforation) or physical intervention (optimizing cooling trial for hypoxic ischemic encephalopathy [randomization to 33.5°C or 32°C for 72 or 120 hours]; – duration of therapy and infant’s body temperature are known to caregivers, investigators, and parents).
Limitations: A blinded trial is regarded as being less subject to bias than an open trial because it minimizes the effect of knowledge of treatment allocation on reporting of outcomes.
Post hoc analysis (from Latin post hoc meaning “after this”): Post hoc analysis consists of looking at the data after the experiment has concluded for patterns that were not specified a priori. If the hypothesis was formulated after the data were analyzed, it is known as a post hoc hypothesis. Because spurious associations may be present just by chance, post hoc analysis should only be hypothesis generating and should be tested in future trials to confirm the effect seen.
-
Strengths and limitations of post hoc analysis:
Strengths: A clinically relevant association may be detected during post hoc analysis. In a study evaluating inhaled nitric oxide in pulmonary hypertension, a finding associating respiratory alkalosis with later-onset sensorineural deafness may be detected by post hoc analysis. As noted above, however, this hypothesis ideally should be tested in a future trial before an association can be confirmed. However, such a trial may not be ethically appropriate.
Limitations: In addition to caution regarding interpretation of a finding on post hoc analysis, if the number of analyses increases, some positive results may be due to chance. As the number of hypotheses increase, the α value should be adjusted (Bonferroni correction). So, if 2 hypotheses are being tested in the same sample, the α to assign significance may be .025. The risk of erroneous conclusion increases with post hoc analysis.
Subgroup analyses are defined as comparisons between randomized groups in a subset of the trial cohort. The main reason for performing these analyses is to discover effect modification (interaction) in subgroups, for example, whether inhaled nitric oxide is more effective in reducing the incidence of death or BPD in preterm infants with birth weights greater than 1,000 g compared with infants with birth weights of 1,000 g or less. To preserve the value of randomization, subgroups should be defined by measurements that were made before randomization. The subgroup effect should be one of a small number of hypotheses tested. If a large number of hypotheses are tested, some of the statistically significant findings may be due to chance alone.
-
Strengths and limitations of subgroup analysis:
-
Strengths:
To discover whether the effect of treatment is different based on sex, gestational age, or birth weight.
-
Limitations:
Easy to misuse and can lead to wrong conclusions.
Being smaller than the entire trial population, there may not be sufficient power to find important differences. (3)
-
-
Systematic review and meta-analysis:
-
A systematic review is the assembly, critical appraisal, and synthesis of all relevant studies addressing a clearly formulated clinical question and incorporating strategies to minimize bias. A comprehensive search of the literature is performed to identify, select, and critically evaluate all relevant research using systematic and explicit methods and to collect and analyze data from all relevant studies included in the review. Statistical methods (meta-analysis) may or may not be used to combine the data in the included studies. Systematic reviews are retrospective analyses and, similar to other retrospective research, are subject to bias. To limit bias, the clinical question should be clearly stated and explicit and systematic methods that can be reproduced by others should be used throughout the process. The inclusion and exclusion criteria for the search and selection of studies, the subgroup analyses planned (including the anticipated direction of subgroup effect), and sensitivity analyses planned should all be specified a priori.
The purpose of a systematic review: Systematic reviews summarize the available evidence relating to a specific clinical question. In addition to providing an overall estimate of treatment effect to guide clinical decisions, systematic reviews can also help to inform research by identifying the areas of uncertainty requiring further study and guide policy decisions based on the entire body of evidence.
-
Advantages of adding a meta-analysis to a systematic review and interpreting the results of a meta-analysis.
A meta-analysis is a statistical method to pool effect estimates of individual studies and provide an overall estimate of treatment effect. The results of a meta-analysis are presented in a forest plot (Figure 7). The forest plot has a horizontal scale that displays the possible values of treatment effect. If the effect estimate is a ratio (eg, odds ratio or risk ratio), the scale is logarithmic. Alternatively, if the effect size is presented as a difference (eg, risk difference or difference in means), the scale is linear. On the logarithmic scale, the value of 1 lies on the line of no effect, whereas on the linear scale, the value of 0 lies on the line of no effect. The vertical line in a forest plot is called the line of no effect, and if the confidence interval (CI) crosses this line, it indicates no difference in outcomes in the treatment and comparator arms.
On a forest plot, the treatment effect of each individual study is represented by a square. The point at the center of the square is the point estimate. The relative weight given to each study is represented by the size of the square (usually determined by the study size), the CI is represented by a horizontal line that runs through the center of the block. The pooled effect estimate is represented by a diamond at the end of all individual study estimates. The point estimate of the pooled effect is at the center of the diamond, and the CI is represented by the width of the diamond. If the diamond crosses the line of no effect, this indicates that after combining all relevant studies, there is no significant difference in effect in the treatment vs comparator.
It is not always appropriate to pool results of individual studies in a meta-analysis. Data from different studies can be combined when the studies address a common question and measure and report outcomes similarly. Alternatively, if the studies are very dissimilar or if the studies are at a high risk of bias, leading to a low confidence in the estimate of effect, the data should not be statistically pooled.
-
The advantages of adding a meta-analysis to a systematic review can be summarized in the following points:
The combination provides a pooled quantitative estimate of the effects of the intervention, and the uncertainty associated with the result can be inferred using the CI. Combining studies results in greater power to detect treatment effects and decreases uncertainty (narrower CI and greater precision).
The differences in included studies can be analyzed to explore differences in treatment effect in different study populations and settings.
The comparison of different studies may lead to new ideas and hypotheses for future trials.
-
Limitations of a systematic review:
Because a systematic review is a retrospective review, similar to other retrospective studies, it is at risk of bias.
Use of explicit criteria and critical appraisal of the literature reduce the likelihood of a biased review.
Not recognizing publication bias and bias in the conduct of the studies included in the review may lead to unreliable results. A thorough evaluation of the risk of bias of included studies and assessment of publication bias will limit this possibility. Publication bias is a distortion of the published literature that occurs when published studies are not representative of all studies that have been performed. This bias is secondary to a tendency to submit and publish positive results more often than negative results. (3)
-
Limitations of a meta-analysis:
Careful consideration should be given to the studies that are included in the meta-analysis. The results are a direct reflection of the studies included in the analysis. If the studies included are at a high risk of bias, and the results of the individual studies do not represent the true effect, combining these studies may result in increased precision of the wrong results, giving biased results credibility (garbage in, garbage out). Analyzing the data by different statistical methods may give different results with the same set of studies. Heterogeneity should be considered and explored in the results of the meta-analysis.
-
Figure 1.

Distinguishing among preclinical and phase I, II, III, and IV clinical trials.
IND = Investigational New Drug Application, FDA = Food and Drug Administration, NDA = New Drug Application, PI = principal investigator.
Figure 2.
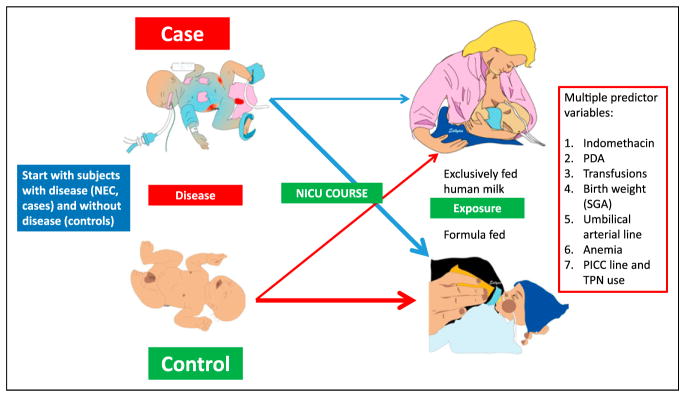
Case-control study. Cases (patients with necrotizing enterocolitis [NEC]) are identified and are matched with controls (eg, preterm infants of the same gestational age and sex born in the same month in the same neonatal intensive care unit [NICU]). Working backwards, investigators can evaluate multiple predictor variables.
PDA = patent ductus arteriosus, PICC = peripherally inserted central catheter, SGA = small for gestational age, TPN = total parenteral nutrition.
Figure 3.

Cohort study. Preterm infants exposed to formula and not exposed to formula born in 2014 form the cohort for a prospective cohort study. They are followed up longitudinally for development of asthma by age 10 years. In a retrospective cohort study, preterm infants born in 2004 are evaluated over time to the current presence of disease (2014). Confounding factors (variables other than the one of interest, eg, feeding) may influence the primary outcome (eg, family history of atopy, socioeconomic status, and severity of bronchopulmonary dysplasia [BPD]). Losses to follow-up may bias the results of a cohort study.
Figure 4.

Randomized controlled and double-blinded clinical trial (modified from the Eunice Kennedy Shriver National Institute of Child Health and Human Development Donor Human Milk and Neurodevelopmental Outcomes in Very Low Birth Weight [VLBW] Infants trial; http://clinicaltrials.gov/ct2/show/NCT01232725). Access to maternal breast milk (MBM) cannot be randomized. Hence, infants with access to MBM are excluded from the trial. Preterm infants without access to MBM form the study population and are randomized to donor human milk and formula. Because the color of these 2 products is different, it is delivered in amber syringes and bottles to blind the caregivers and parents. A double-blind approach indicates that both investigators or clinical team and parents or patients are unaware of the allocation. The primary outcome variable is neurodevelopmental outcome at age 2 years. Patients may be lost to follow-up. A primary outcome and several secondary outcomes may be evaluated. A blinded randomized controlled trial is the gold standard and provides strong direct evidence between exposure and outcome but is time-consuming and expensive.
Figure 5.

Unplanned crossover study in a randomized study of Nissen fundoplication vs lansoprazole medical management. Analysis by treatment would analyze patients who underwent Nissen fundoplication vs patients who were treated with lansoprazole alone. However, intent-to-treat analysis would compare patients randomized to fundoplication (all infants with light yellow onesies) to patients randomized to lansoprazole only (all infants with dark red onesies).
Figure 6.
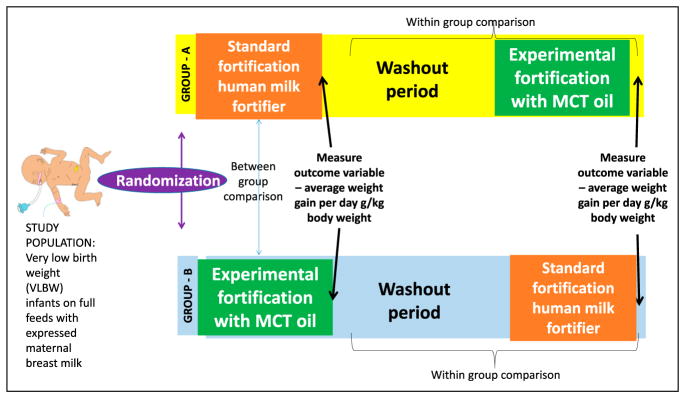
Planned crossover design. Preterm infants (<1,500-g birth weight [very low birth weight (VLBW)]) on exclusive maternal breast milk feeds were randomized to standard fortification to 24 kcal/oz and experimental fortification with medium chain triglyceride (MCT) oil for 1 week. At the end of the week, outcome variable (mean weight gain per day) was measured and compared between the 2 groups. After a washout period of 1 week to avoid residual carryover effect, group A was fortified with MCT oil and group B was fortified with liquid human milk fortifier. Within-group comparisons can be performed between 2 fortifications.
Figure 7.
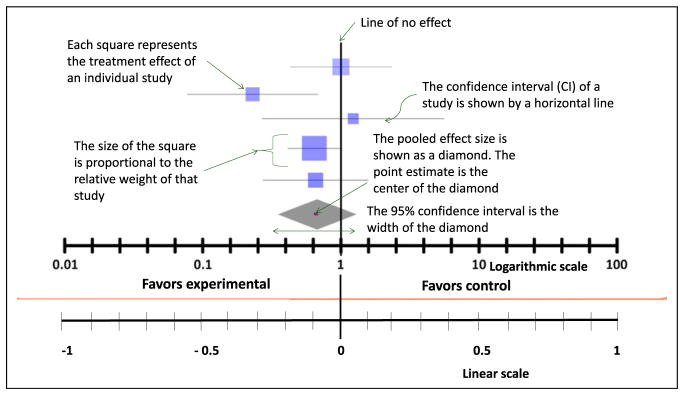
Characteristics of a forest plot. This plot can be shown on a logarithmic scale (when the line of no effect is at 1) or on a linear scale (when the line of no effect is at 0). The squares represent individual treatment effects, and the diamond represents pooled effect. The width of the diamond represents the 95% confidence interval. If the diamond crosses the line of no effect, the meta-analysis does not significantly favor experimental or control group.
The second part of this review covers bias and confounding, causation, incidence and prevalence, screening, sensitivity analysis, and measurement and will appear in a subsequent issue of Neoreviews.
American Board of Pediatrics Neonatal-Perinatal Content Specification.
Understand the purpose of a systematic review.
Understand the advantages of adding a meta-analysis to a systematic review.
Interpret the results of a meta-analysis.
Identify the limitations of a systematic review.
Identify the limitations of a meta-analysis.
Distinguish phase I, II, III, and IV clinical trials.
Recognize a retrospective study.
Understand the strengths and limitations of retrospective studies.
Recognize a case series.
Understand the strengths and limitations of case series.
Recognize a cross-sectional study.
Understand the strengths and limitations of cross-sectional studies.
Recognize a case-control study.
Understand the strengths and limitations of case-control studies.
Recognize a longitudinal study.
Understand the strengths and limitations of longitudinal studies.
Recognize a cohort study.
Understand the strengths and limitations of cohort studies.
Recognize a randomized controlled study.
Understand the strengths and limitations of randomized controlled studies.
Recognize a before-after study.
Understand the strengths and limitations of before-after studies.
Recognize a crossover study.
Understand the strengths and limitations of crossover studies.
Recognize an open-label study.
Understand the strengths and limitations of open-label studies.
Recognize a post-hoc analysis.
Understand the strengths and limitations of post hoc analyses.
Recognize a subgroup analysis.
Understand the strengths and limitations of subgroup analyses.
Abbreviations
- BPD
bronchopulmonary dysplasia
- CI
confidence interval
- MCT
medium chain triglyceride
- NEC
necrotizing enterocolitis
- NICU
neonatal intensive care unit
- VLBW
very low birth weight
Footnotes
Author Disclosure
Drs Manja and Lakshminrusimha have disclosed funding from grant 1R01HD072929-0 (S.L.) and that they are consultants and on the speaker bureau of Ikaria, Inc. This commentary does not contain a discussion of an unapproved/ investigative use of a commercial product/device.
References
- 1.Brodsky D, Martin C. Neonatology Review. Philadelphia, PA: Hanley & Belfus; 2003. [Google Scholar]
- 2.Hermansen M. Biostatistics: Some Basic Concepts. Gainesville, FL: Caduceus Medical Publishers; 1990. [Google Scholar]
- 3.Hulley SB, Cummings SR, Browner WS, Grady DG, Newman TB. Designing Clinical Research. Philadelphia, PA: Wolters Kluwer Health; 2013. [Google Scholar]
- 4.Norman GR, Streiner DL. Biostatistics: The Bare Essentials. Hamilton, Ontario: BC Decker; 2008. [Google Scholar]
- 5.Pagano M, Gauvreau K. Principles of Biostatistics. 2. Boston, MA: Duxbury/Thomson Learning; 2000. [Google Scholar]
- 6.Lampkin SJ, Turner AM, Lakshminrusimha S, et al. Association between caffeine citrate exposure and necrotizing enterocolitis in preterm infants. Am J Health Syst Pharm. 2013;70(7):603–608. doi: 10.2146/ajhp120457. [DOI] [PubMed] [Google Scholar]
- 7.Moore EM, Johnson SB. Research and statistics: case reports, anecdotal evidence, and descriptive epidemiologic studies in pediatric practice. Pediatr Rev. 2009;30(8):323–324. doi: 10.1542/pir.30-8-323. [DOI] [PubMed] [Google Scholar]
- 8.Jaffe HW, Bregman DJ, Selik RM. Acquired immune deficiency syndrome in the United States: the first 1,000 cases. J Infect Dis. 1983;148(2):339–345. doi: 10.1093/infdis/148.2.339. [DOI] [PubMed] [Google Scholar]
- 9.Johnson SL. Research and statistics: a question of time: crosssectional versus longitudinal study designs. Pediatr Rev. 2010;31 (6):250–251. doi: 10.1542/pir.31-6-250. [DOI] [PubMed] [Google Scholar]
- 10.Upadhya K, Rowe P. Research and statistics: case-control studies. Pediatr Rev. 2010;31(2):70–71. doi: 10.1542/pir.31-2-70. [DOI] [PubMed] [Google Scholar]
- 11.Hernandez RG, Rowe PC. Research and statistics: cohort studies. Acad Pediatr Rev. 2009;30(9):364–365. doi: 10.1542/pir.30-9-364. [DOI] [PubMed] [Google Scholar]
- 12.Gordis L. Epidemiology: With STUDENT CONSULT Online Access. Philadelphia, PA: Elsevier Health Sciences; 2013. [Google Scholar]