

Abstract
Ibrutinib (Imbruvica®), a small-drug inhibitor of Bruton tyrosine kinase (BTK), is currently undergoing clinical testing in patients with multiple myeloma (MM), yet important questions on the role of BTK in myeloma biology and treatment are outstanding. Using flow-sorted side population (SP) cells from human myeloma cell lines (HMCLs) and MM primary samples as surrogate fort the elusive multiple myeloma stem cell (MMSC), we found that elevated expression of BTK in myeloma cells leads to AKT/WNT/β-catenin-dependent up-regulation of key stemness genes (OCT4, SOX2, NANOG, MYC) and enhanced self-renewal. Enforced transgenic expression of BTK in myeloma cells increased features of cancer stemness, including clonogenicity and resistance to widely used myeloma drugs, whereas inducible knockdown of BTK abolished them. Furthermore, over-expression of BTK in myeloma cells promoted tumor growth in laboratory mice and rendered SP-derived tumors that contained high levels of BTK more sensitive to the selective, second-generation BTK inhibitor, CGI1746, than SP-derived tumors that harbored low levels of BTK. Taken together, these findings implicate BTK as a positive regulator of myeloma stemness and provide additional support for the clinical testing of BTK-targeted therapies in patients with myeloma.
Keywords: Multiple myeloma stem cell (MMSC), small-molecule inhibitor, cancer stemness genes, mouse model of myeloma, CGI1746
Introduction
Following in the footsteps of exciting clinical data on the efficacy of the small-drug inhibitor of Bruton tyrosine kinase (BTK) (1,2) ibrutinib, in patients with mantle cell lymphoma (MCL) (3) and chronic lymphocytic leukemia (CLL) (4) ibrutinib is now undergoing phase 2 clinical testing for multiple myeloma (MM) – registered online at ClinicalTrials.gov as NCT01478581 and NCT01962792. The promise of BTK as new therapeutic target in MM was first suggested by 3 concurrent preclinical studies demonstrating that inhibition of BTK with 3 different small molecules – ibrutinib (5), LFM-A13 (6) and CC-292 (7) – effectively targets both myeloma cells, including cancer stem cell (CSC)-like cells commonly referred to as MM stem cells (MMSCs), and non-malignant bystander cells in the tumor microenvironment, such as osteoclasts (5–7).
BTK (8) is an X chromosome-encoded member of the Tec protein tyrosine kinase family that has long been known to play a central role in B-cell receptor (BCR) signaling (9,10). More recent findings, though, place BTK in strategic positions of additional signal transduction pathways important for mature B-lymphocytes and plasma cells; e.g., CXCR4-CXCL12 (SDF1) chemokine (11) and toll-like receptor (TLR) (12) signaling. BTK’s pleiotropic functionality in the B-lineage may complicate efforts to elucidate the mechanisms by which targeted inhibition of BTK suppresses neoplastic growth; i.e., the mode of action in MM (5–7) may differ in some respects from that in Waldenström’s macroglobulinemia (13), CLL (14), diffuse large B cell lymphoma (DLBCL) (15), and other blood cancers (16). It is also possible that different subpopulations of tumor cells in the same patient exhibit different degrees of BTK dependency – as suggested by this study, in which MMSCs are shown to be more sensitive to BTK inhibition than bulk myeloma cells. Elevated levels of BTK in myeloma have been reported to prognosticate poor outcome (17), although connections to increased cancer stemness have not been established yet.
The available pipeline of selective BTK inhibitors, such as PCI-32765 (ibrutinib) (18) and CC-292 (19), has recently been enriched by CGI1746 – a promising compound that binds reversibly to BTK (20). With regard to the latter, CGI1746 exhibits minimal, if any, cross-reactivity with the Tec family kinases, ITK (IL-2-inducible T cell kinase) and BMX (BMX non-receptor tyrosine kinase) et al. (20). The high target selectivity of CGI1746 may render it useful for development as second-generation BTK inhibitor able to overcome primary and acquired resistance to ibrutinib (21) as recently reported for MCL (22) and CLL (23), respectively.
In this study we concentrate on the role of BTK in myeloma stemness, and show that BTK is upregulated in side population (SP) cells, a widely used surrogate for the elusive MMSC (24,25). We demonstrate that enforced expression of BTK in HMCLs leads to elevated clonogenic growth, increased expression of pluripotent/embryonic stem cell (iPS/ES) genes, and heightened tolerance to myeloma drugs. Conversely, knockdown of BTK abrogates these changes. We also show that overexpression of BTK in myeloma accelerates tumor formation in NOD-SCID mice, yet renders the tumors more sensitive to CGI1746. Our findings on BTK’s involvement in myeloma stemness led us to postulate that therapeutic targeting of BTK in patients with myeloma may be most effective in an adjuvant setting, when tumor mass is low and MMSC-targeted drugs may be most effective.
Materials and Methods
Myeloma cell lines
The mouse cell line 5TGM1 was obtained from Dr. Gregory R. Mundy (University of Vanderbilt, Nashville, TN). Human cell lines H929, 8226, JJN3 and XG1 were kindly provided by Dr. Simona Colla (M.D. Anderson Cancer Center, TX). ARP1, OCI-MY5, ARK, OPM2, and KMS28PE were kind gifts from Dr. John Shaughnessy (University of Arkansas for Medical Sciences, AR). Cell lines were confirmed to be mycoplasma-free. All myeloma cells were maintained at 37°C and 5% CO2, using RPMI1640 (Gibco, Grand Island, NY) supplemented with 10% heat-inactivated fetal calf serum (Gibco) and penicillin/streptomycin (100 μg/mL, Sigma, St. Louis, MO) as growth medium.
Reagent
BTK inhibitor, CGI1746, was a kind gift from Genentech, Inc (San Francisco, CA). ABCB1 antibody was purchased from Santa Cruz Biotechnology (Dallas, Texas) and other antibodies and LY2940002 were from Cell Signaling Technology (Danvers, MA). Bortezomib was from Millennium (Cambridge, MA); doxorubicin and verapamil were from Sigma.
Flow cytometry
SP cells were enumerated and flow-sorted as described previously (26). Briefly, 1 × 10⁶ cells were suspended in 1mL RPMI1640 media with 10% FBS and 5μg/mL Hoechst 33342, and incubated in 37°C water bath for 90 min. Cells treated with 100μM verapamil were used as negative control. After incubation, cells were stained with CD138-FITC, κ-APC or λ–PE antibodies and resuspended in ice-cold RPMI1640 media with PI (2 μg/mL) for flow analysis or sorting. Cell death assays were performed using Annexin V Apoptosis Detection Kit APC, (eBioscience, San Diego, CA), eFluxx-ID™ Multidrug resistance assay (Farmingdale, NY) was performed as according to the protocol (26).
Quantitative real time-PCR (qPCR)
Total RNA was extracted using RNeasy kit (Qiagen, Germany) and reverse transcribed using oligo dT primers and SuperScript III RT (Invitrogen) (26). Target gene-specific primers and primers for reference genes were purchased from Integrated DNA Technologies (Coralville, IA) or Invitrogen.
Lentiviral gene transduction
Genes were over-expressed or silenced as described previously (27,28). Transduction efficiency was determined by flow cytometry, using a green fluorescent reporter protein (GFP). The BTK promoter region positioned from −596 to 52 of the transcriptional start site was cloned into lentiviral backbone vector driven by GFP. Human NANOG Reporter lentivirus (System Biosciences, Mountain View, CA) was transfected according to the protocol.
Clonogenicity assay
Clonogenic growth was evaluated by seeding 1 × 10⁴ myeloma cells in 0.5 mL RPMI 1640 containing 0.33% agar and 10% FBS (29). MethoCult™ H4535 without EPO (Stem Cell Technologies, Vancouver) was used for serial re-plating.
Cell proliferation and viability assay
Cells were enumerated by trypan blue staining using hemocytometer. IC50 of CGI1746 on MM cells was determined by PrestoBlue™ reagent (Invitrogen).
Western blotting and co-immunoprecipitation (Co-IP) assays
Protein levels in myeloma cells were determined using immunoblotting (26). β-ACTIN and HISTONE 2B were used as benchmarks for total and nuclear proteins, respectively. Co-IPs were performed as described previously (29).
Myeloma xenograft tumors mouse model
Six weeks’ old NOD.Cg-Rag1tm1monInstakita Il2rgtm1wjl/SzJ mice were purchased from the Jackson Laboratory (Bar Harbor, Maine). Experiments were approved under the protocol of the Institutional Animal Care and Use Committee of the University of Iowa (IACUC 1203033). Briefly, 1 × 10⁶ MM cells of ARP1-EV, APR1-BTK OE, H929-SCR and H929-BTK shRNA cells were injected subcutaneously into each mouse (n=5). Seven days post-injection, mice receiving H929 cells were given water containing doxycycline to induce the expression of BTK-shRNA. Tumor size was measured twice a week, and tumor volume (mm3) was calculated as 4π/3 × (tumor diameter/2)3. Studies were terminated once the tumors diameter reached 20 mm.
CGI1746 treatment on the mouse 5TGM1 myeloma model
Around 1 × 10⁶ 5TGM1cell were injected into 10 C57BL/KaLwRij mice from Harlan Laboratories (Netherlands) through tail-vein injection. Mice were divided into 2 groups, CGI1746 (100 mg/kg, SC) treatment group and control group treated with cremophor/ethanol solution for dissolving CGI1746. CGI1746 was treated three times per week beginning 7 days post-injection. Blood drawn occurred weekly with tumor burden determined by blood lgG2b levels via an Elisa IgG2b detection kit (Bethyl Laboratories, TX).
About 5 × 10⁴ 5TGM1 SP or non-SP cells were injected into 20 C57BL/KaLwRij mice. Mice were divided into 4 experimental groups; SP or non-SP control groups treated with cremophor/ethanol solution or CGI1746 (100 mg/kg, SC) as above.
Statistical analysis
The survival data were plotted using Kaplan-meier curve and analyzed by log-rank test. Multiple groups (≥3) were analyzed by one-way ANOVA, and paired groups were analyzed by two-way ANOVA or Student t test. A p<0.05 was considered as significant.
Results
BTK protein levels in patients with myeloma and inhibition of myeloma cells by CGI1746
Microarray-based global gene expression profiling (6) and qPCR (17) have been recently used by other investigators to convincingly demonstrate that BTK mRNA levels are elevated in myeloma cells compared to normal plasma cells. To complement these findings with BTK protein expression data, we immunostained bone marrow biopsies of 34 patients with newly diagnosed myeloma using an antibody to BTK. Designating immunoreactivity in ≥25% of myeloma cells as cutoff for BTK expression, we found 27 (~80%) cases to be positive and 7 (~20%) cases negative. Semi-quantitative evaluation of tissue sections by a hematopathologist identified 3, 9 and 15 cases as BTKHigh, BTKFair and BTKLow, respectively. An example of moderate BTK expression is shown in Figure 1A. Examples of BTKHigh and BTKLow myelomas are depicted in Supplemental Figure 1. Next, we asked whether CGI1746 inhibits HMCLs in vitro. Treatment of ARP1 and OPM2 cells with a dose range of drug (0.2 μM to 50 μM; 48 hrs) resulted in similar levels of cytotoxicity in both cell lines (IC50 ≅ 10 μM; Figure 1B). We further tested CGI1746 effect in 5TGM1 mouse model. Figure 1B (left panel) shows that mice receiving BTK inhibitor survived significantly longer (median survival 57 days) than mice left untreated (median survival 39 days). The survival results were corroborated by measurements of serum levels of IgG2b, a biomarker of 5TGM1 tumor burden. IgG2b rose earlier and more quickly in the control rather than drug-treated mice (Figure 1C, right panel).
Figure 1. BTK protein expression in myeloma patient bone marrow samples and inhibition of human and mouse myeloma cells using CGI1746.

(A) Serial sections of a bone marrow biopsy specimen of a myeloma patient were immunolabeled with antibodies to BTK (left) or CD138 (syndecan 1, right) respectively.
(B) CGI1746 is cytotoxic to human myeloma cells, ARP1 and OPM2.
(C) Kaplan-Meier survival curve of CGI1746 treatment on C57BL/KaLwRij mice following 5TGM1 cells.
Elevated BTK expression is a feature of putative MMSCs
The CD138− subpopulation of cells, which exhibits features of cancer stemness, has been used as a stand-in for studies on MMSCs (30). To determine the expression of BTK in this subpopulation, we used CD138 magnetic beads to fractionate CD138− and CD138+ cells from 10 different cell lines. RT-PCR analysis demonstrated in all cases that BTK was more highly expressed in the CD138− fraction. The magnitude of the increase ranged from a modest 1.5-fold in KMS28PE to nearly 50-fold in OCI-MY5 (Figure 2A). To confirm these findings with a method of MMSC isolation that is widely considered to be more stringent and reliable, we obtained the small but consistently detected side population (SP) from 2 cell lines with moderate to low elevations of BTK: OPM2 and ARP1 (24,26). RT-PCR measurements showed that, compared to main population (MP) cells, SP cells harbored considerably higher BTK mRNA levels than seen in the CD138 assay: a ~150-fold increase in ARP1 and a ~35-fold increase in OPM2 (Figure 2B, top rows). Be this as it may, elevated BTK expression was associated with a marked up-regulation of 3 stem cell genes, NANOG, MYC and SOX2, and a moderate up-regulation of 4 additional stem cell genes: SMO, GLI1, NOTCH1 and OCT4 (Figure 2B). To translate this investigation to patient-derived myeloma samples, we compared the expression of BTK in flow-sorted IgL-restricted (IgLR) SP cells with that in CD138+ MP cells: (26) BTK mRNA levels in the former were on average 2.5 times higher than in the latter (Figure 2C).
Figure 2. Upregulation of BTK is associated with features of stemness in myeloma.

(A) qPCR data indicating ratios of mean BTK mRNA levels (horizontal columns) and standard deviations of the mean (horizontal error bars) of flow-sorted CD138− and CD138+ myeloma cells. For each cell line (n = 10), the mean BTK expression level seen in CD138+ cells was set to 1 and then used as benchmark to calculate the fold-increase in CD138− cells.
(B) qPCR results indicating ratios of mean mRNA levels of CSC-associated genes (horizontal columns) in flow-sorted side population (SP) vs. main population (MP) myeloma cells.
(C) qPCR data indicating ratios of BTK mRNA levels in immunoglobulin light-chain (IgL)-restricted (IgLR) SP cells vs. CD138+ MP cells from 4 patients with myeloma.
(D) Flow histogram depicting the fluorescence intensity profile of ARP1 myeloma cells harboring a lentivirus-encoded green fluorescence protein (GFP) reporter gene driven by the human BTK core promoter. The top and bottom 10 percent of cells featuring high and low GFP expression, respectively, were flow sorted and designated GFPHigh and GFPLow, respectively.
(E) qPCR result indicating that GFPHigh cells contain elevated levels of BTK message compared to GFPLow cells.
(F) Colony growth data demonstrate that ARP1 GFPHigh cells have increased clonogenic potential relative to GFPLow cells. Cell clusters counted as colony are circled. Two independent colonies that begin to merge are indicated by light arrow. Small aggregates of cells not counted as colonies are indicated by dark arrows.
To complement the results described above with a method that yields larger samples of cells than possible using CD138− or SP fractionations, we developed a reporter-based genetic method for flow sorting of myeloma cells according to BTK promoter activity. OCI-MY5, ARP1 and OPM2 cells were transduced with a lentivirus-encoded GFP reporter gene under transcriptional control of the BTK promoter. Cells were flow sorted to collect the top and bottom deciles of GFP expressors (Figure 2D). RT-PCR analysis validated the method by demonstrating that GFPHigh cells harbored approximately 5 times more BTK message than GFPLow cells (Figure 2E). Next we performed serial colony formation assays using 3 consecutive passages of ARP1 cells to evaluate the possibility that BTK promotes clonogenicity. Compared to GFPLowBTKLow cells, GFPHighBTKHigh cells not only exhibited significantly increased clonogenic potential upon initial plating (110 ± 23 vs. 58 ± 13 colonies, p < 0.05, student t test), but also greater capacity for further increase upon 2nd and 3rd re-plating (p = 0.012, one-way ANOVA) (Figure 2F).
Enforced expression of BTK enhances myeloma stemness
To prove BTK is a driver rather than a consequential phenomenon in keeping features of cancer stemness in myeloma, ARP1 and OPM2 cells were transfected with lentiviral particles that encoded a BTK cDNA gene. Western blotting showed that compared to cells infected with non-coding “empty” virus (BTKWT used as control), cells over-expressing BTK (BTKOE) contained elevated amounts of (a) total and phosphorylated BTK, (b) total and phosphorylated PLCγ2, a downstream substrate of BTK in the BCR signaling pathway, and (c) NANOG, a master regulator of stemness (Figure 3A). RT-PCR analysis of the iPS/ES genes OCT4, SOX2, NANOG and LIN28A revealed 5-fold to 8-fold increases in mRNA levels in BTKOE cells compared to BTKWT cells (Figure 3B). Soft agar clonogenicity assays demonstrated BTK-dependent elevations of colony numbers in BTKOE vs. BTKWT cells: 12.9% vs. 8.63% in case of ARP1 and 13.7% vs. 9.94% for OPM2 (results not shown). Next, using the flow cytometric, we found that over-expression of BTK in both ARP1 and OPM2 cells led to a ~3-fold increase in the abundance of SP cells (Figure 3C). To determine whether enforced expression of BTK also increased tumorigenicity of myeloma cells, we subcutaneously injected ARP1 cells into NOD-SCID mice. BTKOE cells generated tumors more effectively than their BTKWT counterparts (Figure 3D).
Figure 3. Enforced expression of BTK in myeloma cells confers features of stemness.
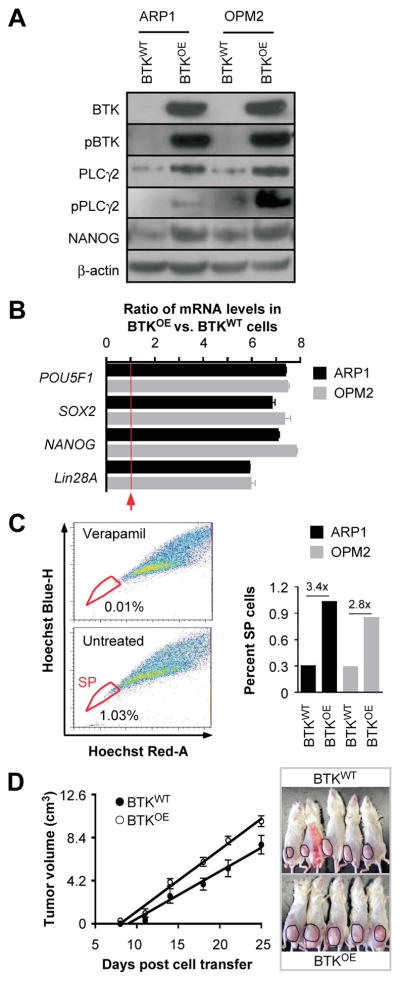
(A) Immunoblot analysis of BTKOE and BTKWT ARP1 and OPM2 myeloma cells.
(B) Bar diagram of qPCR measurements indicating elevated expression of 4 stemness genes in BTKOE compared to BTKWT cells.
(C) Shown to the left are the percentages of SP (indicated in circle) in ARP1-BTK overexpressing cells gated based on verapamil treated cells. The bar graph to the right depicts the fold increase in the SP fraction in BTKOE vs. BTKWT samples.
(D) Time course of tumor growth in NOD-SCID mice indicating that BTKOE cells are more aggressive than BTKWT cells.
BTK promotes drug resistance in myeloma
Because CSCs have been implicated in acquisition of drug resistance in patients with cancer, we investigated whether enforced expression of BTK blunts the response of myeloma cells to widely used myeloma drugs. Clonogenic growth assays demonstrated that regardless of experimental conditions, BTKOE cells produced more colonies than BTKWT cells (Figure 4A). Compared to BTKWT cells, the growth advantage of BTKOE cells treated for 2 weeks with bortezomib (Bz), doxorubicin (Dox) or etoposide (Eto) was more pronounced (2.5-fold to 5.3-fold) than that of BTKOE cells left untreated (1.57-fold) (Figure 4A). Flow cytometric determination of immunoreactivity to annexin V, a marker of apoptotic cell death, revealed a similar picture, as the survival advantage of untreated BTKOE compared to BTKWT cells (33%) increased to levels that ranged from 74% (0.5 nM Bz) to 81% (5 nM Bz) under conditions of treatment (Figure 4B). To elucidate the mechanism by which BTK promotes drug resistance in myeloma, we determined the activity of the ABC transporter efflux pump with the assistance of the eFluxx-ID Gold MDR assay. The mean fluorescence intensity exhibited a strong verapamil-dependent increase in BTKOE cells (50–65%) (Figure 4C, left). In keeping with that, western blotting demonstrated increased expression of the transporter protein, ABCB1, in BTKOE compared to BTKWT cells, and an increase of pBCL2Ser70, a phosphorylated and hyperactive form of the anti-apoptotic protein (Figure 4C, right), while the total form of other BCL2 family genes, BCL2, BCL-XL and MCL1, showed no change (data now shown). Next we performed colony formation assays to assess the possibility that drug efflux pump inhibition restores the sensitivity of BTKOE cells to Bz. Figure 4D shows that exposure of cells to verapamil alone caused little if any change in the clonogenic growth of BTKOE compared to BTKWT cells. However, combination treatment was more effective because the corresponding BTKOE to BTKWT ratios dropped from 5.30 in cells treated with Bz alone to 2.20 in cells treated with Bz and verapamil.
Figure 4. Over-expression of BTK in myeloma cells promotes drug resistance.

(A) Bar diagram depicting percent clonogenic growth of ARP1 myeloma cells that either over-express BTK (BTKOE) or contain normal levels (BTKWT). Shown to the right are representative photomicroscopic images of two soft-agar dishes that contain myeloma cell colonies derived from Bz-treated BTKOE cell (top) and BTKWT cells (bottom).
(B) Diagrammatic representation of percent apoptotic cell death of BTKOE/BTKWT ARP1 cells treated with the same drugs used in panel A. Shown to the right is a typical set of flow histograms, using again treatment with 5 nM Bz as an example.
(C) Gold eFluxx assay data demonstrating that over-expression of BTK results in heightened drug efflux in myeloma cells. The Western blot on the right demonstrates BTK-dependent up-regulation of ABCB1 and pBCL2 in ARP1 and OPM2 cells.
(D) Bar diagram summarizing results of colony formation assays using ARP1 BTKOE/BTKWT ARP1 cells treated with 10 nM verapamil, 5 nM Bz or combination of both drugs. Cells left untreated were used as control. The BTKOE to BTKWT ratios are indicated, analogous to panels A and B.
Inducible down regulation of BTK reduces growth, survival, stemness and tumorigenicity of myeloma cells
We further infected OCI-MY5 and H929 cells with lentivirus that encoded a BTK-targeted shRNA under control of a doxycycline (Dox)-inducible promoter (BTKKD). Cells transduced with a Dox-inducible non-targeting shRNA were used as control (BTKWT). Immunoblotting of whole cell lysates demonstrated decreases in BTK, pBTK, PLCγ2 and pPLCγ2 in BTKKD relative to BTKWT cells (Figure 5A), indicating that BTK-targeted shRNA knockdowns the same genes found to be overexpressed in BTKOE cells (Figure 3A). Activation of poly (ADP-ribose) polymerase and caspases 3, 8 and 9 by proteolytic cleavage in BTKKD cells showed that knockdown of BTK may trigger both intrinsic and extrinsic pathways of apoptosis, and that OCI-MY5 and H929 cells may in fact be “addicted” to high endogenous levels of BTK. Consistent with that, loss of BTK reduced growth and survival of myeloma cells in vitro (Figure 5B–C) and in xenotransplanted NOD-SCID mice (Figure 5D).
Figure 5. Down regulation of BTK in myeloma cells mitigates growth, survival, and stemness.

(A) Western blots of OCI-MY5 and H929 myeloma cells that either under-express BTK due to lentiviral transduction of a BTK–targeted shRNA “knock down” construct (BTKKD) or express BTK at normal levels due to transduction of a non-targeted or “scrambled” shRNA (BTKWT). PARP indicates poly (ADP-ribose) polymerase. Casp3, 8 and 9 denote three different members of the apoptosis-related cysteine peptidase family of caspase proteins.
(B) Line graphs presenting changes in cell number (top) and cell viability (bottom) of BTKKD and BTKWT OCI-MY5 cells grown for 7 days in vitro.
(C) Same as panel B except H929 cells were used.
(D) Time course of tumor growth in NOD-SCID mice, showing that BTKKD cells expand less vigorously in vivo than BTKWT cells.
(E) Evidence indicating that BTK and NANOG are co-regulated in myeloma, and that the BTK-NANOG axis promotes clonogenicity of myeloma cells.
The apparent linkage of BTK and NANOG expression in SP myeloma cells (Figure 2B) and our published findings on the role of NANOG in maintaining myeloma stemness (26) led us to evaluate whether inducible knockdown of BTK in myeloma cells results in down-regulation of NANOG and loss of clonogenicity. OCI-MY5 cells were co-transfected with lentivirus encoding a NANOG promoter-driven GFP reporter and the Dox-inducible BTK shRNA or control knockdown constructs used above (Figure 5E, upper left). Cells were fractionated by flow sorting according to reporter gene expression (GFP+ vs. GFP−) (Figure 5E, upper right), treated with Dox for 48 hrs to down-regulate BTK, and harvested for gene expression analysis using RT-PCR (Figure 5E, lower left). We observed a significant shRNA-dependent reduction of BTK message in both GFP+ and GFP− BTKKD cells compared to BTKWT. Changes in NANOG expression exhibited the same trend: a 5.5-fold drop in GFP+BTKKD vs. GFP+BTKWT cells and a ~13-fold reduction in GFP− BTKKD relative to GFP− BTKWT cells. Clonogenic growth was also dependent on BTK and NANOG levels, as GFP+BTKWT and GFP− BTKWT cells exhibited clonogenicity more or less robustly, yet BTKKD cells failed in that regard (Figure 5E, lower right).
BTK governs, in part, AKT and WNT/β-CATENIN signaling in myeloma
To elucidate the mechanism by which BTK regulates signal transduction in myeloma cells, we sought to identify BTK-interacting proteins using co-immunoprecipitation (Co-IP) analysis in BTKOE ARP1 and OPM2 cells. Figure 6A shows that antibody to BTK (bait) pulled down the WNT/β-CATENIN stabilizer, CDC73 (31). Conversely, antibody to CDC73 pulled down BTK. This suggested physical interaction of the two proteins in myeloma cells. Next we interrogated the WNT/β-CATENIN pathway in the paired BTKOE / BTKWT and BTKKD / BTKWT cell lines described in Figures 3–5. Immunoblotting showed that BTKOE cells harbored increased amounts of β-CATENIN, phosphorylated AKT (pAKT) and phosphorylated GSK3β (pGSK3β), whereas BTKKD cells contained reduced amounts of these proteins relative to WT controls (Figure 6B). BTK directly phosphorylates AKT in B cells. Following up on the results presented in Figure 4C and previous work from our laboratory suggesting that AKT-dependent activation of ABCB1 and BCL2 underlies drug resistance in myeloma (29), we performed a dye efflux assay using the AKT inhibitor, LY2940002. Figure 6C shows that BTKOE cells responded to that treatment by retaining more dye in the cytoplasm – an indication that ABCB1 and related drug efflux proteins require upstream AKT signaling to operate properly in myeloma cells. Immunoblotting supported this interpretation as BTKOE cells treated with LY2940002 contained less ABCB1, pBCL2 and β-CATENIN than their BTKWT counterparts (Figure 6D). Because we have recently shown that CSC-like myeloma cells may overexpress NANOG in a WNT/β-CATENIN-dependent manner (26), we treated BTKOE cells with the β-CATENIN inhibitor CAY10404. Figure 6E shows that this treatment led to decreased NANOG protein levels.
Figure 6. Interrogation of the BTK signaling pathway in myeloma.

(A) Western blot of a co-immunoprecipitation (Co-IP) experiment indicating physical interaction of BTK and CDC73 in BTK-overexpressing ARP1 and OPM2 cells (lanes 1–2). IgG isotype control (lanes 3–4) and whole cell lysates without Co-IP (lanes 5–6) were included for comparison.
(B) Immunoblots demonstrating reciprocal changes in AKT and WNT pathways in BTKOE and BTKKD cells, respectively, relative to their respective BTKWT controls.
(C) Flow cytometry histogram depicting eFluxx assay fluorescence intensity profiles of BTKOE ARP1 and OPM2 cells treated with the indicated AKT inhibitor (bottom panels) or left untreated (top panels).
(D) Immunoblots indicating AKT inhibitor-dependent reductions in ABCB1, pBCL-2 and β-CATENIN levels in BTKOE ARP1 and OPM2 cells. β-ACTIN and HIS2B were used as loading controls.
(E) Immunoblots indicating WNT inhibitor-dependent reductions in NANOG in BTKOE ARP1 and OPM2 cells.
CGI1746 inhibits myeloma-like tumors in mice
We treated BTKOE cells with 10 μM CGI1746 to test the possibility that selective inhibition of BTK affords a treatment option for myeloma including BTKHigh MMSCs (20). Flow cytometric determination of drug efflux capacity using eFluxx dye analysis showed that treatment with CGI1746 significantly reduced this capacity in myeloma cells (Figure 7A). In agreement with that, clonogenic growth of GFPHighBTKHigh cells was more compromised by CGI1746 than that of GFPLowBTKLow cells used as control. In case of ARP1, 1.61 and 7.88 percent of BTKHigh cells either treated with inhibitor or left untreated gave rise to colonies – a ratio of 0.204. The same ratio for BTKLow cells was 0.533, indicating that treatment with CGI1746 affected BTKHigh cells 2.6 times more severely than BTKLow cells. OPM2 cells showed the similar trend as ARP1 cells (Figure 7B). To extend these observations in vivo, we transferred 5TGM1 cells, previously flow-sorted as SP and MP. Figure 7C (left panel) shows that untreated mice harboring SP-derived tumors exhibited the shortest median survival (61 days), followed by untreated mice containing MP-derived tumors (89 days). Treatment of mice with CGI1746 prolonged the median survival in both cases: 119 days in the SP group and “undefined” (after 140 days of observation, at which time the study was terminated) in the MP group. The survival results were corroborated by changes in serum IgG2b M-spike levels, an imperfect but widely used biomarker of tumor burden (Figure 7C, right panel). Figure 7D shows that CGI1746 was also effective in preliminary studies comparing hematopoietic stem cells (HSCs) from BTK-deficient Xid and normal mice.
Figure 7. Preclinical testing of CGI1746.

(A) Flow histograms of eFluxx dye retention assays using BTKOE ARP1 and OPM2 cells treated with CGI1746.
(B) Bar diagram of colony formation results indicating CGI1746-dependent reductions in clonogenicity of GFPHighBTKHigh vs. GFPLowBTKLow myeloma cells.
(C) Kaplan-Meier survival curve (left) of C57BL/KaLwRij mice treated with IV injections of either SP or non-SP 5TGM1 cells, followed by treatment of mice with CGI1746 or solvent control and the right panel is a graph of mean serum IgG2b levels of tumor-bearing mice.
(D) Column diagram presenting results of colony formation assays of hematopoietic stem cells (HSC) obtained from BTK-deficient Xid or normal mice.
(E) Working model on the putative mechanisms by which BTK promotes stemness and drug resistance in myeloma.
Discussion
The main finding of this study is experimental evidence for an important role of BTK in myeloma stemness. A working model of BTK’s function in MMSC is depicted in Figure 7E. Using flow-sorted myeloma SP cells as surrogate for MMSCs, we showed that elevated expression of BTK is associated with both upregulation of key iPS/ES genes (e.g., OCT4, SOX2, NANOG, MYC) and enhanced self-renewal (serial passage of clonogenicity). Enforced expression of BTK in myeloma cells increased features of stemness (e.g., SP, clonogenicity, iPS/ES genes, drug resistance), whereas knockdown of BTK abolished them. In vitro results of this sort were underlined by in vivo studies using laboratory mice, demonstrating that over-expression of BTK in myeloma cells promotes tumor growth and renders SP/BTKHigh tumors derived from 5TGM1 myeloma more sensitive to BTK inhibitor, CGI1746, than their MP/BTKLow tumor counterparts. Although the growth inhibition in vivo was not as potent as in vitro study, there is statistically significant inhibition effect in vivo (p < 0.05). The discrepancy of BTK-shRNA between in vitro and in vivo may be caused tumor environment, because some factors from the environment may rescue partial effects induced by BTK-shRNA.
BTK can now be added to the growing list of candidate myeloma stemness and drug resistance genes that have been uncovered by us (26,28,29,32,33) and others (34). The master stem cell factor NANOG – which is positively regulated by BTK according to this study and by RARα2 according to our previous report (26) – illustrates this point. Upregulation of NANOG, which is often attributed to constitutive WNT/β-CATENIN signaling under conditions of heightened cancer stemness (35), is tightly associated with adverse outcome in solid and hematologic cancers (36). β-CATENIN promotes NANOG expression directly, by virtue of binding to the NANOG promoter, and also indirectly by suppressing TCF-3, a negative regulator of NANOG (37). Our finding that myeloma cells contained increased levels of β-CATENIN in a BTK-dependent manner, and that inhibition of WNT/β-CATENIN signaling using CAY10404 suppressed NANOG in myeloma cells, suggests that inhibition of the WNT/β-CATENIN/NANOG axis may be a promising MMSC-targeted therapy.
In addition to testing promising myeloma drug candidates, such as CGI1746, in tumor transplantation-based mouse models of myeloma, the compounds should also be evaluated in genetically engineered mouse models (GEMMs) in which myeloma-like tumors arise spontaneously. A number of GEMMs driven by constitutive oncogenes, including MYC, BCL2L1 (Bcl-XL), IL6, CCND1 and XBP1, are available for myeloma drug testing, with some of them – particularly Vk*MYC (38), iMycBcl-XL (39), and IL6Myc (40), – already having demonstrated capability to assess objective treatment responses. The genetically and environmentally controlled setting of a preclinical mouse drug study may provide significant benefits compared to a clinical trial.
In conclusion, this study provides preclinical evidence for a role of BTK in myeloma stemness, and directs attention to including BTK inhibitors in MMSC-targeted drug cocktails aimed at eradicating MMSCs and curing myeloma in clinics.
Supplementary Material
Acknowledgments
We wish to thank Gilead and Genentech for providing CGI1746, Justin Fishbaugh, George Rasmussen and Heath Vignes for assistance with flow cytometry and the DNA facility of the University of Iowa for the technical support.
Grant support
This work was supported by: R01CA152105 (to FZ) and R01CA151354 (to SJ) from the NCI; The Leukemia & Lymphoma Society Translational Research Program (to F.Z., 6246-11 and 6094-12); institutional start-up funds from the Department of Internal Medicine, Carver College of Medicine, University of Iowa (to FZ and GT); research award 81228016 from the National Natural Science Foundation of China (to FZ and JS); the P30 CA042014 supported Cell Response and Regulation Program of the Huntsman Cancer Institute, University of Utah (to FZ); The University of Iowa Holden Comprehensive Cancer Center Support Grant P30 CA086862.
Footnotes
Conflicts of interest: None
Disclosure of Potential Conflicts Interest
No potential conflicts of interest were disclosed.
Author’s Contributions
Conception and design: F. Zhan, Y. Yang, G. Tricot
Development of Methodology: Y. Yang, J. Shi, M. Salama, S. Das
Acquisition of data (provided patients, provided reagents): G. Tricot, D. Levasseur
Analysis and interpretation of data: F. Zhan, S. Janz, Y. Yang, J. Shi
Writing, review, and/or revision of the manuscripts: S. Janz, F. Zhan, Y. Yang, G. Tricot, Z. Gu, E. Wendlandt, S. Das, J. Huang, Y. Tao, M. Hao, R. Franqui, D. Levasseur, H. Xu
References
- 1.Vetrie D, Vorechovsky I, Sideras P, Holland J, Davies A, Flinter F, et al. The gene involved in X-linked agammaglobulinaemia is a member of the src family of protein-tyrosine kinases. Nature. 1993;361:226–33. doi: 10.1038/361226a0. [DOI] [PubMed] [Google Scholar]
- 2.Tsukada S, Saffran DC, Rawlings DJ, Parolini O, Allen RC, Klisak I, et al. Deficient expression of a B cell cytoplasmic tyrosine kinase in human X-linked agammaglobulinemia. Cell. 1993;72:279–90. doi: 10.1016/0092-8674(93)90667-f. [DOI] [PubMed] [Google Scholar]
- 3.Wang ML, Rule S, Martin P, Goy A, Auer R, Kahl BS, et al. Targeting BTK with ibrutinib in relapsed or refractory mantle-cell lymphoma. The New England journal of medicine. 2013;369:507–16. doi: 10.1056/NEJMoa1306220. [DOI] [PMC free article] [PubMed] [Google Scholar]
- 4.Byrd JC, Furman RR, Coutre SE, Flinn IW, Burger JA, Blum KA, et al. Targeting BTK with ibrutinib in relapsed chronic lymphocytic leukemia. The New England journal of medicine. 2013;369:32–42. doi: 10.1056/NEJMoa1215637. [DOI] [PMC free article] [PubMed] [Google Scholar]
- 5.Tai YT, Chang BY, Kong SY, Fulciniti M, Yang G, Calle Y, et al. Bruton tyrosine kinase inhibition is a novel therapeutic strategy targeting tumor in the bone marrow microenvironment in multiple myeloma. Blood. 2012;120:1877–87. doi: 10.1182/blood-2011-12-396853. [DOI] [PMC free article] [PubMed] [Google Scholar]
- 6.Bam R, Ling W, Khan S, Pennisi A, Venkateshaiah SU, Li X, et al. Role of Bruton’s tyrosine kinase in myeloma cell migration and induction of bone disease. Am J Hematol. 2013;88:463–71. doi: 10.1002/ajh.23433. [DOI] [PMC free article] [PubMed] [Google Scholar]
- 7.Eda H, Santo L, Cirstea DD, Yee AJ, Scullen TA, Nemani N, et al. A novel Bruton’s tyrosine kinase inhibitor CC-292 in combination with the proteasome inhibitor carfilzomib impacts the bone microenvironment in a multiple myeloma model with resultant antimyeloma activity. Leukemia. 2014 doi: 10.1038/leu.2014.69. [DOI] [PubMed] [Google Scholar]
- 8.Hendriks RW, Yuvaraj S, Kil LP. Targeting Bruton’s tyrosine kinase in B cell malignancies. Nature reviews Cancer. 2014;14:219–32. doi: 10.1038/nrc3702. [DOI] [PubMed] [Google Scholar]
- 9.Kurosaki T, Kurosaki M. Transphosphorylation of Bruton’s tyrosine kinase on tyrosine 551 is critical for B cell antigen receptor function. The Journal of biological chemistry. 1997;272:15595–8. doi: 10.1074/jbc.272.25.15595. [DOI] [PubMed] [Google Scholar]
- 10.Saito K, Scharenberg AM, Kinet JP. Interaction between the Btk PH domain and phosphatidylinositol-3,4,5-trisphosphate directly regulates Btk. The Journal of biological chemistry. 2001;276:16201–6. doi: 10.1074/jbc.M100873200. [DOI] [PubMed] [Google Scholar]
- 11.de Gorter DJ, Beuling EA, Kersseboom R, Middendorp S, van Gils JM, Hendriks RW, et al. Bruton’s tyrosine kinase and phospholipase Cgamma2 mediate chemokine-controlled B cell migration and homing. Immunity. 2007;26:93–104. doi: 10.1016/j.immuni.2006.11.012. [DOI] [PubMed] [Google Scholar]
- 12.Kenny EF, Quinn SR, Doyle SL, Vink PM, van Eenennaam H, O’Neill LA. Bruton’s tyrosine kinase mediates the synergistic signalling between TLR9 and the B cell receptor by regulating calcium and calmodulin. PLoS One. 2013;8:e74103. doi: 10.1371/journal.pone.0074103. [DOI] [PMC free article] [PubMed] [Google Scholar]
- 13.Yang G, Zhou Y, Liu X, Xu L, Cao Y, Manning RJ, et al. A mutation in MYD88 (L265P) supports the survival of lymphoplasmacytic cells by activation of Bruton tyrosine kinase in Waldenstrom macroglobulinemia. Blood. 2013;122:1222–32. doi: 10.1182/blood-2012-12-475111. [DOI] [PubMed] [Google Scholar]
- 14.de Rooij MF, Kuil A, Geest CR, Eldering E, Chang BY, Buggy JJ, et al. The clinically active BTK inhibitor PCI-32765 targets B-cell receptor- and chemokine-controlled adhesion and migration in chronic lymphocytic leukemia. Blood. 2012;119:2590–4. doi: 10.1182/blood-2011-11-390989. [DOI] [PubMed] [Google Scholar]
- 15.Davis RE, Ngo VN, Lenz G, Tolar P, Young RM, Romesser PB, et al. Chronic active B-cell-receptor signalling in diffuse large B-cell lymphoma. Nature. 2010;463:88–92. doi: 10.1038/nature08638. [DOI] [PMC free article] [PubMed] [Google Scholar]
- 16.Hantschel O, Rix U, Schmidt U, Burckstummer T, Kneidinger M, Schutze G, et al. The Btk tyrosine kinase is a major target of the Bcr-Abl inhibitor dasatinib. Proceedings of the National Academy of Sciences of the United States of America. 2007:10413283–8. doi: 10.1073/pnas.0702654104. [DOI] [PMC free article] [PubMed] [Google Scholar]
- 17.Liu Y, Dong Y, Jiang QL, Zhang B, Hu AM. Bruton’s tyrosine kinase: potential target in human multiple myeloma. Leukemia & lymphoma. 2014;55:177–81. doi: 10.3109/10428194.2013.794458. [DOI] [PubMed] [Google Scholar]
- 18.Honigberg LA, Smith AM, Sirisawad M, Verner E, Loury D, Chang B, et al. The Bruton tyrosine kinase inhibitor PCI-32765 blocks B-cell activation and is efficacious in models of autoimmune disease and B-cell malignancy. Proceedings of the National Academy of Sciences of the United States of America. 2010;107:13075–80. doi: 10.1073/pnas.1004594107. [DOI] [PMC free article] [PubMed] [Google Scholar]
- 19.Evans EK, Tester R, Aslanian S, Karp R, Sheets M, Labenski MT, et al. Inhibition of Btk with CC-292 provides early pharmacodynamic assessment of activity in mice and humans. J Pharmacol Exp Ther. 2013;346:219–28. doi: 10.1124/jpet.113.203489. [DOI] [PubMed] [Google Scholar]
- 20.Di Paolo JA, Huang T, Balazs M, Barbosa J, Barck KH, Bravo BJ, et al. Specific Btk inhibition suppresses B cell- and myeloid cell-mediated arthritis. Nat Chem Biol. 2011;7:41–50. doi: 10.1038/nchembio.481. [DOI] [PubMed] [Google Scholar]
- 21.Burger JA, Buggy JJ. Bruton tyrosine kinase inhibitor ibrutinib (PCI-32765) Leukemia & lymphoma. 2013;54:2385–91. doi: 10.3109/10428194.2013.777837. [DOI] [PubMed] [Google Scholar]
- 22.Ma J, Lu P, Guo A, Cheng S, Zong H, Martin P, et al. Characterization of ibrutinib-sensitive and -resistant mantle lymphoma cells. British journal of haematology. 2014 doi: 10.1111/bjh.12974. [DOI] [PubMed] [Google Scholar]
- 23.Woyach JA, Bojnik E, Ruppert AS, Stefanovski MR, Goettl VM, Smucker KA, et al. Bruton’s tyrosine kinase (BTK) function is important to the development and expansion of chronic lymphocytic leukemia (CLL) Blood. 2014;123:1207–13. doi: 10.1182/blood-2013-07-515361. [DOI] [PMC free article] [PubMed] [Google Scholar]
- 24.Jakubikova J, Adamia S, Kost-Alimova M, Klippel S, Cervi D, Daley JF, et al. Lenalidomide targets clonogenic side population in multiple myeloma: pathophysiologic and clinical implications. Blood. 2011;117:4409–19. doi: 10.1182/blood-2010-02-267344. [DOI] [PMC free article] [PubMed] [Google Scholar]
- 25.Nara M, Teshima K, Watanabe A, Ito M, Iwamoto K, Kitabayashi A, et al. Bortezomib Reduces the Tumorigenicity of Multiple Myeloma via Downregulation of Upregulated Targets in Clonogenic Side Population Cells. PloS one. 2013;8:e56954. doi: 10.1371/journal.pone.0056954. [DOI] [PMC free article] [PubMed] [Google Scholar]
- 26.Yang Y, Shi J, Tolomelli G, Xu H, Xia J, Wang H, et al. RARalpha2 expression confers myeloma stem cell features. Blood. 2013;122:1437–47. doi: 10.1182/blood-2013-02-482919. [DOI] [PMC free article] [PubMed] [Google Scholar]
- 27.Zhan F, Colla S, Wu X, Chen B, Stewart JP, Kuehl WM, et al. CKS1B, overexpressed in aggressive disease, regulates multiple myeloma growth and survival through SKP2- and p27Kip1-dependent and -independent mechanisms. Blood. 2007;109:4995–5001. doi: 10.1182/blood-2006-07-038703. [DOI] [PMC free article] [PubMed] [Google Scholar]
- 28.Shi L, Wang S, Zangari M, Xu H, Cao TM, Xu C, et al. Over-expression of CKS1B activates both MEK/ERK and JAK/STAT3 signaling pathways and promotes myeloma cell drug-resistance. Oncotarget. 2010;1:22–33. doi: 10.18632/oncotarget.105. [DOI] [PMC free article] [PubMed] [Google Scholar]
- 29.Zhou W, Yang Y, Xia J, Wang H, Salama ME, Xiong W, et al. NEK2 Induces Drug Resistance Mainly through Activation of Efflux Drug Pumps and Is Associated with Poor Prognosis in Myeloma and Other Cancers. Cancer cell. 2013;23:48–62. doi: 10.1016/j.ccr.2012.12.001. [DOI] [PMC free article] [PubMed] [Google Scholar]
- 30.Matsui W, Wang Q, Barber JP, Brennan S, Smith BD, Borrello I, et al. Clonogenic multiple myeloma progenitors, stem cell properties, and drug resistance. Cancer research. 2008;68:190–7. doi: 10.1158/0008-5472.CAN-07-3096. [DOI] [PMC free article] [PubMed] [Google Scholar]
- 31.James RG, Biechele TL, Conrad WH, Camp ND, Fass DM, Major MB, et al. Bruton’s tyrosine kinase revealed as a negative regulator of Wnt-beta-catenin signaling. Sci Signal. 2009;2:ra25. doi: 10.1126/scisignal.2000230. [DOI] [PMC free article] [PubMed] [Google Scholar]
- 32.Wu X, Shi J, Wu Y, Tao Y, Hou J, Meng X, et al. Arsenic trioxide-mediated growth inhibition of myeloma cells is associated with an extrinsic or intrinsic signaling pathway through activation of TRAIL or TRAIL receptor 2. Cancer biology & therapy. 2010;10:1201–14. doi: 10.4161/cbt.10.11.13669. [DOI] [PMC free article] [PubMed] [Google Scholar]
- 33.Zhou W, Yang Y, Gu Z, Wang H, Xia J, Wu X, et al. ALDH1 activity identifies tumor-initiating cells and links to chromosomal instability signatures in multiple myeloma. Leukemia. 2013 doi: 10.1038/leu.2013.383. [DOI] [PMC free article] [PubMed] [Google Scholar]
- 34.Tanno T, Lim Y, Wang Q, Chesi M, Bergsagel PL, Matthews G, et al. Growth Differentiating Factor 15 enhances the tumor initiating and self-renewal potential of multiple myeloma cells. Blood. 2013 doi: 10.1182/blood-2013-08-524025. [DOI] [PMC free article] [PubMed] [Google Scholar]
- 35.Shin K, Lee J, Guo N, Kim J, Lim A, Qu L, et al. Hedgehog/Wnt feedback supports regenerative proliferation of epithelial stem cells in bladder. Nature. 2011;472:110–4. doi: 10.1038/nature09851. [DOI] [PMC free article] [PubMed] [Google Scholar]
- 36.Wang ML, Chiou SH, Wu CW. Targeting cancer stem cells: emerging role of Nanog transcription factor. OncoTargets and therapy. 2013;6:1207–20. doi: 10.2147/OTT.S38114. [DOI] [PMC free article] [PubMed] [Google Scholar]
- 37.Xu C, Xie D, Yu SC, Yang XJ, He LR, Yang J, et al. beta-Catenin/POU5F1/SOX2 transcription factor complex mediates IGF-I receptor signaling and predicts poor prognosis in lung adenocarcinoma. Cancer research. 2013;73:3181–9. doi: 10.1158/0008-5472.CAN-12-4403. [DOI] [PubMed] [Google Scholar]
- 38.Chesi M, Matthews GM, Garbitt VM, Palmer SE, Shortt J, Lefebure M, et al. Drug response in a genetically engineered mouse model of multiple myeloma is predictive of clinical efficacy. Blood. 2012 doi: 10.1182/blood-2012-02-412783. [DOI] [PMC free article] [PubMed] [Google Scholar]
- 39.Lee EC, Fitzgerald M, Bannerman B, Donelan J, Bano K, Terkelsen J, et al. Antitumor activity of the investigational proteasome inhibitor MLN9708 in mouse models of B-cell and plasma cell malignancies. Clin Cancer Res. 2011;17:7313–23. doi: 10.1158/1078-0432.CCR-11-0636. [DOI] [PMC free article] [PubMed] [Google Scholar]
- 40.Duncan K, Rosean TR, Tompkins VS, Olivier A, Sompallae R, Zhan F, et al. (18)F-FDG-PET/CT imaging in an IL-6- and MYC-driven mouse model of human multiple myeloma affords objective evaluation of plasma cell tumor progression and therapeutic response to the proteasome inhibitor ixazomib. Blood cancer journal. 2013;3:e165. doi: 10.1038/bcj.2013.61. [DOI] [PMC free article] [PubMed] [Google Scholar]
Associated Data
This section collects any data citations, data availability statements, or supplementary materials included in this article.