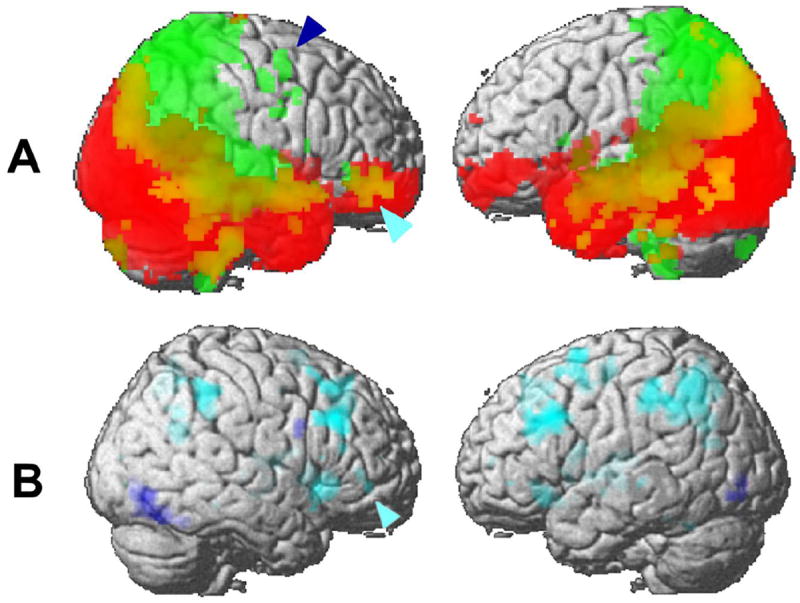
Figure 3.

(A) Population maps of the dorsal and ventral pathways projected onto a three-dimensional template brain. Terminal points of tractography (n > 5) from the activated area in the right IPS are shown in green, and terminal points of tractography (n > 5) from the activated area in the right FG are shown in red. Overlap areas from the two pathways were shown in yellow. The dark blue arrowhead indicates the right SFG, and light blue arrowheads indicate the right ventral IFG. See also Supplementary Fig. S2.
(B) Activation maps superimposed on a three-dimensional brain during the encoding (dark blue) and maintenance (light blue) phases of the combined condition. The image on the left side represents the right hemisphere, and includes all activated areas with a height threshold of p < 0.001 (uncorrected). The light blue arrowhead indicates the right ventral IFG.
