Abstract
Saccharomyces cerevisiae selectively uses good nitrogen sources (glutamine) in preference to poor ones (proline) by repressing GATA factor-dependent transcription of the genes needed to transport and catabolize poor nitrogen sources, a physiological process designated nitrogen catabolite repression (NCR). We show that some NCR-sensitive genes (CAN1, DAL5, DUR1,2, and DUR3) produce two transcripts of slightly different sizes. Synthesis of the shorter transcript is NCR-sensitive and that of the longer transcript is not. The longer transcript also predominates in gln3Δ mutants irrespective of the nitrogen source provided. We demonstrate that the longer mRNA species arises through the use of an alternative transcription start site generated by Gln3p-binding sites (GATAAs) being able to act as surrogate TATA elements. The ability of GATAAs to serve as surrogate TATAs, i.e. when synthesis of the shorter, NCR-sensitive transcripts are inhibited, correlates with sequestration of enhanced green fluorescent protein (EGFP)-Gln3p in the cytoplasm in a way that is indistinguishable from that seen with EGFP-Ure2p. However, when the shorter, NCR-sensitive DAL5 transcript predominates, EGFP-Gln3p is nuclear. These data suggest that the mechanism underlying NCR involves the cytoplasmic association of Ure2p with Gln3p, an interaction that prevents Gln3p from reaching it is binding sites upstream of NCR-sensitive genes.
Arginine transport into Saccharomyces cerevisiae is mediated by several permeases; one is the low Km (10 µm) basic amino acid permease responsible for arginine uptake at low external concentrations. This “biosynthetic” permease is encoded by ARGP/CAN1 (1). Kinetic characterization of arginine transport by Can1p was conducted in ammonia-grown cells (1). That Can1p is produced and functions in ammonia medium distinguished it from the high Km, “catabolic” general amino permease (GAP1) that transports a variety of amino acids (2). Gap1p is produced only in medium containing a poor nitrogen source (2, 3). These early studies gave rise to the accepted notion that CAN1 expression was insensitive to nitrogen catabolite repression (NCR).1
NCR is the physiological process by which good nitrogen sources (glutamine, asparagine, and ammonia) are used in preference to poor ones (proline, allantoin, γ-aminobutyrate, and glutamate) (3–5). NCR-sensitive transcription of genes required for uptake and catabolism of poor nitrogen sources is mediated by UASNTR elements (4, 5). UASNTR, also referred to as GATA elements since they contain the core sequence GATAA, are the binding sites for the NCR-sensitive transcriptional activators Gln3p and Gat1p/Nil1p (4, 5). In the presence of excess nitrogen, Ure2p, a cytoplasmic prion-precursor protein (6, 7), inhibits the operation of Gln3p and Gat1p (8 –12). The observation that antibody against a fusion protein containing the Gln3p GATA-zinc finger could immunoprecipitate a Ure2p sized protein, when both proteins were overproduced, suggested that Ure2p regulation of Gln3p involved formation of a Gln3p-Ure2p complex (13). A similar mechanism was hypothesized, although not demonstrated, for Ure2p regulation of Gat1p.
A paradox concerning Can1p synthesis began to emerge in a study of the role played by Can1p in the NCR sensitivity of arginine-induced CAR1 (arginase) expression (14). The critical observation was that heterologous overproduction of Can1p (driven by the ADH1 promoter) resulted in arginine-induced CAR1 expression becoming insensitive to NCR (14). This result suggested that a portion of NCR sensitivity of CAR1 expression was derived from NCR-sensitive inducer exclusion (14). NCR-sensitive CAN1 expression was subsequently demonstrated by Northern blot analysis (15). The paradox arises in trying to rectify that the original characterization of Argp/Can1p was performed under conditions of strong NCR with the observation that CAN1 expression is highly NCR-sensitive.
The present work provides a potential explanation of this paradox. Two mRNA species are transcribed from CAN1. One species is Gln3p-dependent and NCR-sensitive, and a second, slightly longer species, is present only under opposite conditions, i.e. strong NCR or deletion of GLN3. The longer mRNA is much less abundant than the shorter one. Similar profiles are also observed with DAL5, DUR1,2, and DUR3. We find that the CAN1 GATA sequences are available, in gln3Δ mutants and during growth with glutamine as nitrogen source, to serve as surrogate TATA elements. Utilization of an upstream start site accounts for the increased size of the NCR-insensitive transcript. Finally, EGFP-Gln3p is nuclear during times of Gln3p-dependent gene expression. When that expression is inhibited, EGRP-Gln3p is localized to the cytoplasm. This may account for the exposure of GATA sequences and their availability to serve as surrogate TATA elements when the function of Gln3p is inhibited or its cognate gene is deleted.
MATERIALS AND METHODS
Growth Conditions
S. cerevisiae strains used in this work were as follows: TCY1 (MATα,lys2,ura3), RR91 (MATα,lys2,ura3,gln3Δ∷hisG), GYC86 (MATa,his3,leu2,trp1,ura3/MATα, his3,leu2,trp1,ura3), TCY57 (Matα,lys2,ura3,trp1∷hisG, leu2∷hisG,GAL1,10-URE2), RRTCY57 (Matα,lys2,ura3,trp1∷hisG,leu2∷hisG,GAL1,10-URE2/Mata,lys2,ura3, trp1∷hisG,leu2∷hisG,GAL1,10-URE2), RJ71 (MATα,lys2,ura3, gat1Δ∷hisG-URA3-hisG), RJ72 (MATα,lys2,ura3, gln3Δ∷hisG, gat1Δ∷hisG-URA3-hisG), JCY125 (Matα,lys2,ura3,ure2Δ∷URA3), JCY37 (MATα,lys2,ura3,gln3∷hisG,ure2Δ∷URA3), BY4742 (MATα, his3D1,leu2D0,lys2D0,ura3D0), BY4742-10305 (Matα,his3D1,leu2D0, lys2D0,ura3D0,can1Δ∷kanX4) (Research Genetics).
Strains TCY1, RR91, RJ71, RJ72, JCY125, JCY37, BY4742, and BY4742-10305 were grown to A600 = 0.3–0.5 in Wickerham’s medium (0.6% glucose, 0.1% nitrogen source). TCY57 and RRTCY57, transformed with pRR482, or GYC86, transformed with pNVS2, pNVS22, or pRR482, were grown overnight in YNB with 0.5% ammonia and 2% raffinose (GYC86) or glucose (TCY57 and RRTCY57) to A600 = 0.25–0.80 for microscopy or A600 = 0.4–0.6 for RNA isolation. Auxotrophic requirements were supplemented as necessary, including addition of 30 µg/ml l-glutamine to the medium of strains RR91 and RR72. GCY86 transformants were induced by adding galactose (final concentration, 4%). TCY57 and RRTCY57 transformants were induced by transferring washed cells to YNB galactose (4%), ammonia (0.5%) medium. Cultures were induced for 3 or more hours.
Plasmid Constructions
To construct CAN1 pRR467, pRR465, and pRR478, pRS316 was digested with SalI, the ends blunted with Klenow polymerase, and then digested with BamHI. The 2.5-kb BamHI-NruI fragment from CAN1 pTLC1 was isolated and ligated into pRS316 yielding pRR426. A 610-base pair CAN1 promoter fragment was created using PCR and cloned into the EagI-BamHI sites of pRR426 to yield pRR467. The method used for creating pRR465 and pRR478 was the same except that mutagenic primers were used in the PCR reaction. All constructs were verified by DNA sequencing.
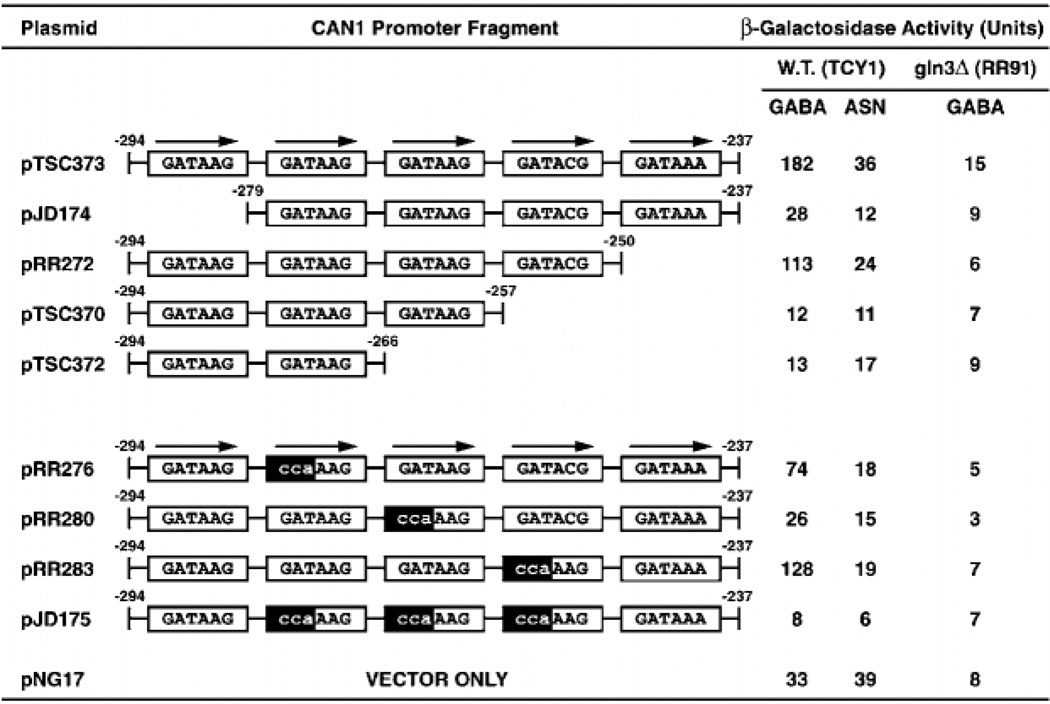
Plasmids in Fig. 5 were constructed by cloning synthetic oligonucleotides into the SalI and EagI sites of pNG17 (identical to pNG15 (16) except that the polylinker is in the opposite orientation).
Fig. 5. Reporter (lacZ) expression supported by CAN1 promoter fragments cloned into heterologous expression pNG17.
Coordinates of the fragments are indicated above their termini, and lowercase letters indicate mutant bases. Cells were grown in minimal medium with γ-aminobutyrate (GABA) or asparagine as sole nitrogen source. W.T., wild type.
EGFP-URE2 pNVS22 was constructed by cloning the 1.1-kb EcoRI-SalI fragment from pAA19 into pNVS2 (17).
EGFP-GLN3 pRR482 was constructed by digesting pRR314 with PstI, blunting the ends with T4 DNA polymerase, and secondarily digesting with XhoI to yield the 2.9-kb vector backbone. The 2.3-kb XhoI-NruI fragment from pRR228 was ligated into the backbone fragment to yield pRR479. The 2.7-kb NdeI-HindIII fragment from pRR479 was finally cloned into pNVS2 digested with NdeI and HindIII. All junction sequences were sequenced prior to use.
Northern Blot Analysis
Total and poly(A)+ RNA were prepared as described (15). Hybridizations were performed as described (18) with the following exception. In Fig. 2, blots were washed twice for 30 min each with 2× SSC, 1% SDS (55 °C), and once with 1 liter of 0.2× SSC at room temperature to accommodate the shorter probes. Probes were generated using PCR products as described (18). The control probe was complementary to HHT1 (histone H3) but also cross-hybridizes with HHT2 (histone H3) mRNA.
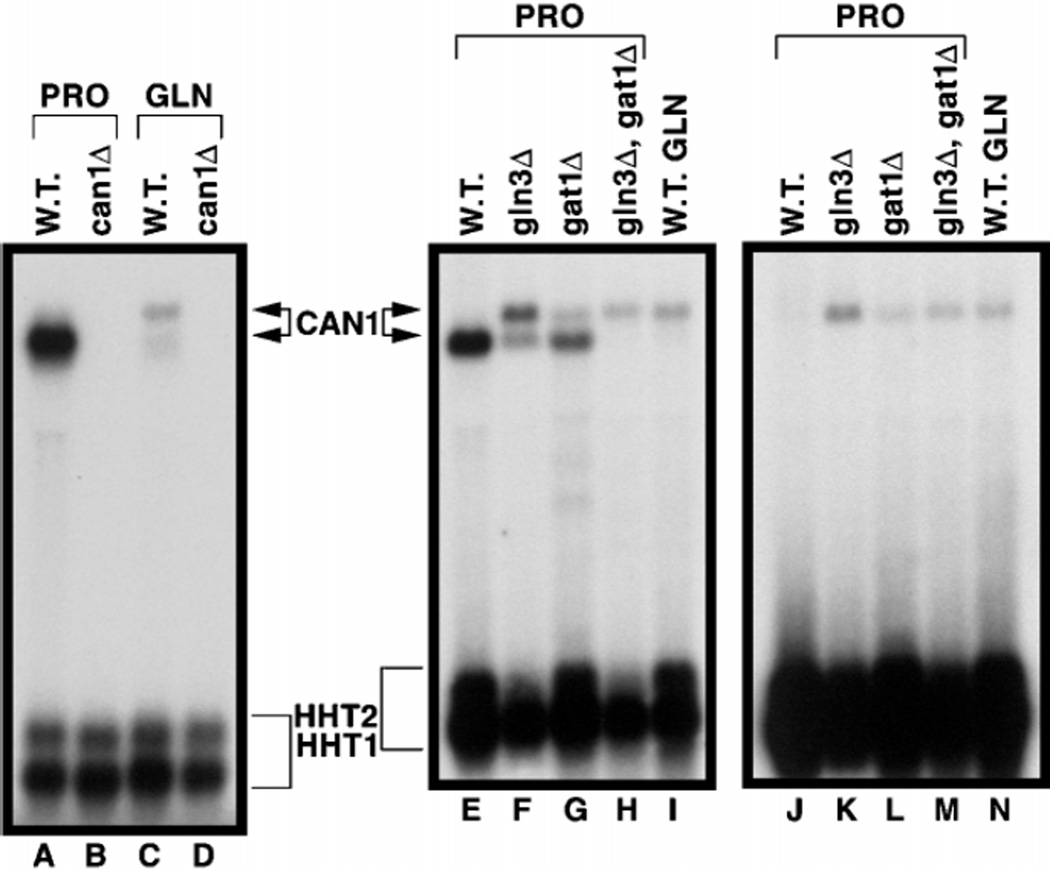
Fig. 2. Northern blot analysis demonstrating that both CAN1 probe-specific mRNA species derive from CAN1.
CAN1 probe (+22 to +1348) was hybridized to RNA isolated from wild type (W.T.) (lanes A and C) or can1Δ (lanes B and D) cells grown in either minimal glucose-proline (PRO) or glucose-glutamine (GLN) medium. To determine the source of the additional nucleotides in the longer transcript, CAN1 probe P13 (−226 to +42, lanes E–I) or P12 (−226 to −87, lanes J–N) was hybridized to RNA isolated from wild type (lanes E and J), gln3Δ (lanes F and K), gat1Δ (lanes G and L), and gln3Δgat1Δ (lanes H and M) cells grown in minimal glucose-proline (PRO) or wild type (lanes I and N) cells grown in minimal glucose-glutamine (GLN) medium.
Primer Extension
Oligonucleotides (CAN1 +92 to +119) were labeled using T4 Polynucleotide Kinase and purified using G-25 chromatography. 5 µg of poly(A) RNA was combined with the labeled primer and incubated 1 h (60 °C) in 250 mm KCl, 10 mm Tris, pH 8.0, and 1 mm EDTA. 2.5 units of avian myeloblastosis virus-reverse transcriptase (Promega) was added, and the reaction mixture was adjusted to 10 mm MgCl2, 20 mm Tris, pH 8.5, 10 mm dithiothreitol, and 250 µm dNTPs; after 1 h incubation (37 °C) products were analyzed on a 6% sequencing gel.
Fluorescence Microscopy
After induction with galactose, 1-ml samples of the cultures were centrifuged, resuspended in 100–200 µl of medium, and 5 µl transferred onto poly-l-lysine-coated slides (Sigma) viewed with a combination of epi-fluorescence and white light using the × 100 objective of a Zeiss Axiophot microscope equipped with a GFP filter set. Photographs were imported into Photoshop 4.0.
For in vivo 4′,6-diamidino-2-phenylindole (DAPI, Sigma) staining, 1 ml of induced cells was harvested by centrifugation and resuspended in 150 µl of medium + 1.5 µl of DAPI (1 mg/ml). After shaking for 30 min at 30 °C, cells were again pelleted, resuspended in 150 µl of media alone, and 5 µl transferred to a poly-l-lysine slide (Sigma) for analysis as described above. DAPI-staining material was pseudocolored red and superimposed on the EGFP image. The images were superimposed exclusively using the cell margins for proper alignment.
RESULTS
Nitrogen Source-dependent Species of CAN1 mRNA
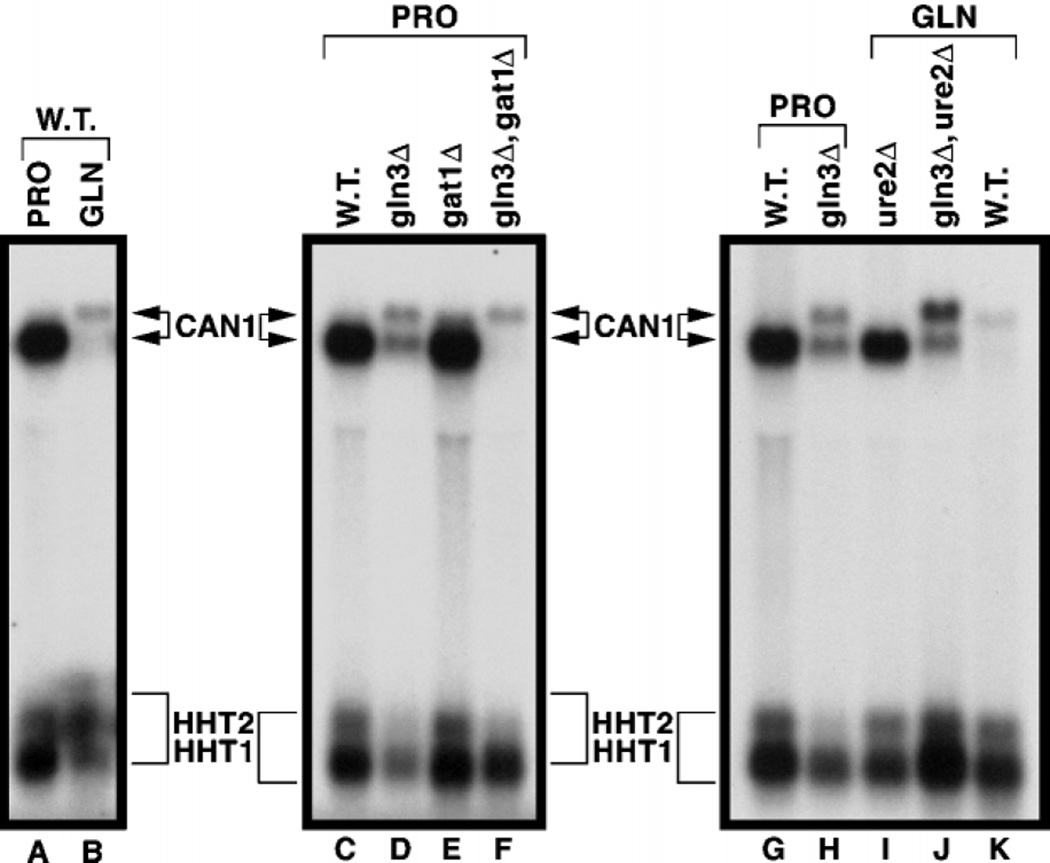
In previous work on NCR-sensitive gene expression, we noticed that two RNA species hybridized to a CAN1-specific probe (15, 19). Our objective here was to identify the events giving rise to them. With a derepressing nitrogen source (proline) large amounts of a single mRNA species (designated the “lower species” because of its mobility) are produced (Fig. 1, lanes A, C, and G). With a repressive nitrogen source (glutamine), the lower species markedly decreases (Fig. 1, lane B) and a more slowly migrating species (designated the “upper species”) appears; the difference in mobilities predict that the species differ by 110–140 nucleotides. High levels of the lower species occur in wild type and a gat1Δ mutant (lanes C and E), are diminished in a gln3Δ mutant (lane D), and are undetectable in a gln3Δ gat1Δ mutant (lane F). In other words, the lower species is regulated like any well studied NCR-sensitive gene, e.g. DAL5 or DAL80 (5, 20). The upper species, in contrast, is expressed only in a gln3Δ or when cells are grown under repressive conditions (with glutamine) (Fig. 1, lanes B, D, and F), i.e. its regulation is just opposite that of the lower one. We observed two transcripts and similar patterns of expression with DAL5, DUR1,2, and DUR3 (Fig. 7 and data not shown). Close inspection of Fig. 1, lane E, reveals a transcript (intermediate mobility) in the gat1Δ RNA that is not present in the gln3Δgat1Δ double mutant. Since repressed CAN1 transcription and appearance of the upper CAN1 transcript were coincident, we determined whether Ure2p influenced the appearance of these species. The lower species increased sharply, as expected, in a ure2Δ mutant provided with glutamine as nitrogen source (Fig. 1, lanes I and K). In contrast, the upper transcript was not present in a ure2Δ but reappeared in a ure2Δgln3Δ (lanes I–K).
Fig. 1. Northern blot analysis of steady-state CAN1 mRNA profiles from wild type (W.T., lanes A, C, and G), gln3Δ (lanes D and H), gat1Δ (lane E), and gln3Δgat1Δ (lane F) cells grown in minimal glucose-proline (PRO) medium or wild type (B and K), ure2Δ (lane I), and gln3Δure2Δ (lane J) cells grown in minimal glucose-glutamine (GLN) medium.
The probe was CAN1 sequence +22 to +1348 (translational start is +1). Histone H3 (HHT1/ HHT2) mRNA was assayed for loading and transfer efficiency.
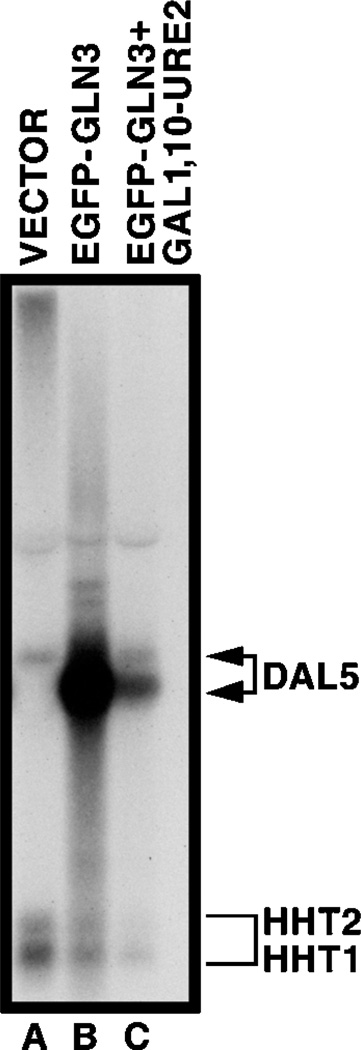
Fig. 7. Northern blot analysis of DAL5 expression in wild type GYC86 transformed with either vector pNVS2 (lane A), GAL1,10-EGFP-GLN3 pRR482 (lane B), or GAL1,10-URE2 overexpressing RRTCY57 transformed with pRR482.
Conditions were identical to those in Figs. 8 and 9. The probe was DAL5 sequence +1 to +1600.
The Two CAN1 mRNAs Possess Different 5′ Termini
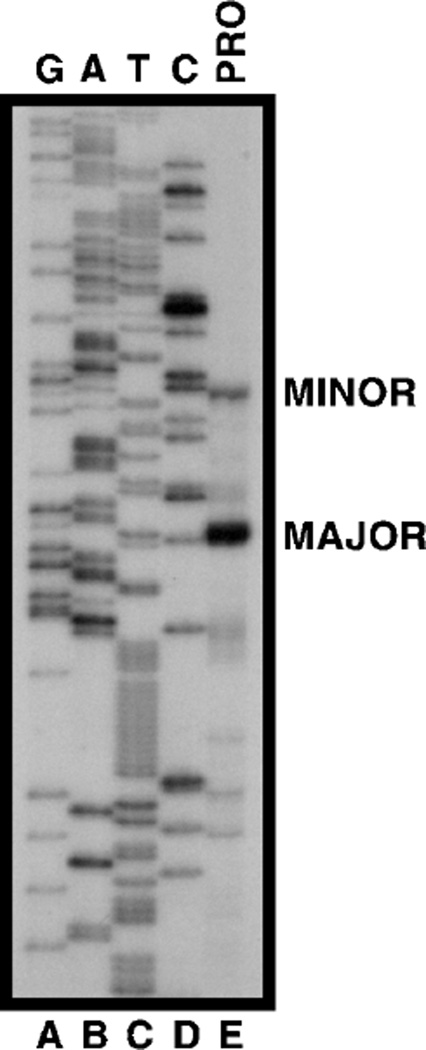
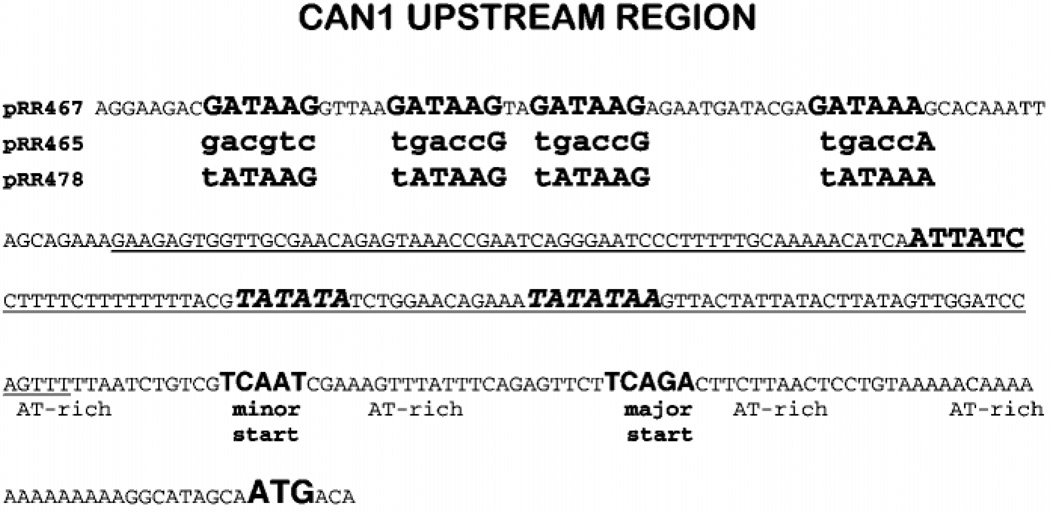
To determine whether the two species were an artifact of crosshybridization, a can1Δ was analyzed. Neither species was present in the deletion mutant arguing that both derived from CAN1 transcription (Fig. 2, lanes A–D). In addition, these blots were probed with a single-stranded CAN1 RNA probe to show that neither transcript was derived from the opposite strand (data not shown). Primer extension analysis of RNA from proline-grown cells demonstrated major and minor start sites at −45 and −46, and −74, respectively (Fig. 3, lane E), downstream of the TATA sequences (Fig. 4). These sites, which are preceded and followed by AT-rich regions, occur within sequences similar to the initiator motif (TCAGT or CA(G/T)T) reported earlier (21, 22) (Fig. 4). To determine whether the upper species began at a more distal site than the lower species, two probes were synthesized. Both RNA species hybridized to probe P13 (−226 to +42, Fig. 2, lanes E–I). Only the upper species hybridized to probe P12 (−226 to −87, Fig. 2, lanes J–N), showing the two species differed at their 5′ termini.
Fig. 3. Primer extension mapping of CAN1 transcriptional start sites in cells grown in minimal glucose-proline (PRO) medium.
cDNA from a reverse transcriptase reaction using a primer containing the CAN1 sequence (+92 to +119) was analyzed on a sequencing gel (lane E) next to sequencing reactions (lanes A–D) carried out with the same primer. Major (MAJOR) and minor (MINOR) start sites are indicated.
Fig. 4. Structure of the CAN1 promoter.
Pertinent sequences are in bold type, and lowercase letters indicate mutant bases in otherwise wild type plasmids whose identities are indicated at the left. Underlined sequence corresponds to probe P12.
Characterization of the Four Clustered CAN1 GATAA Sequences
The CAN1 upstream region contains a cluster of four GATAA sequences (Fig. 4), the hallmark of NCR-responsive UASNTR elements mediating Gln3p- and/or Gat1p-dependent transcription. Not all such GATAA clusters, however, support NCR-sensitive transcription; a GATAA cluster in the PUT1 gene alone does not support NCR-sensitive transcription (23). To assay whether the CAN1 GATA cluster supported transcription with characteristics of a typical NCR-sensitive gene, we cloned a synthetic DNA fragment containing the GATAA cluster into a heterologous expression construct, pNG17. Parent CAN1 pTSC373 supported NCR-sensitive, Gln3p-dependent reporter gene expression (Fig. 5). Deletions removing one or more of these GATA sequences decreased β-galactosidase production (Fig. 5, upper panel). Mutating one or all of the interior three GATAs in pTSC373 also decreased lacZ expression (Fig. 5, lower panel). In all cases, residual lacZ expression was NCR-sensitive and Gln3p-dependent. These data argue that the CAN1 GATA cluster contains UASNTR elements similar to those in the DAL7 and DAL80 promoters.
CAN1 GATA Sequences Serve as Surrogate TATA Elements in gln3Δ Strains
A potential explanation of the results in Figs. 1 and 2 is suggested by the overall layout of the CAN1 promoter. Approximately 100–150 nucleotides separate the GATAA and TATAA sequences (Fig. 4), a distance roughly the same as the difference between the upper and lower CAN1 species (Fig. 1). Therefore, it is conceivable that in repressive medium or with a gln3Δ, the clustered GATAAs serve as TATA sites for CAN1 transcription resulting in a more upstream start site and longer RNA.
Several reports lend credence to this hypothesis. (i) Gurarente and coworkers (24) reported three different TATA sequences activate CYC1 transcription at different subsets of sites 60–120 nucleotides downstream (24). (ii) In saturation mutagenesis of a TATAA, substitution of GATAA for TATAA yielded a phenotype distinguishable from other substitutions that were totally inactive (25). (iii) A randomly selected DNA fragment containing the sequence 5′-ATTATCATTTAATTAC-3′ successfully replaced a yeast TATA (26). (iv) Purified yeast TFIID protein binds to a GATA sequence albeit less well than to a TATA sequence (Fig. 2B of Ref. 27). (v) Aird et al. (28), confirming and extending the findings of Fong and Emerson (27), concluded that a GATA sequence in the rat PF4 promoter (−31 to −28) functions as a TATA element and binds TATA-binding protein in the absence of GATA-1p but not its presence. From these observations we concluded that it might be possible for the CAN1 GATAA to serve as a TATA element, although a poor one.
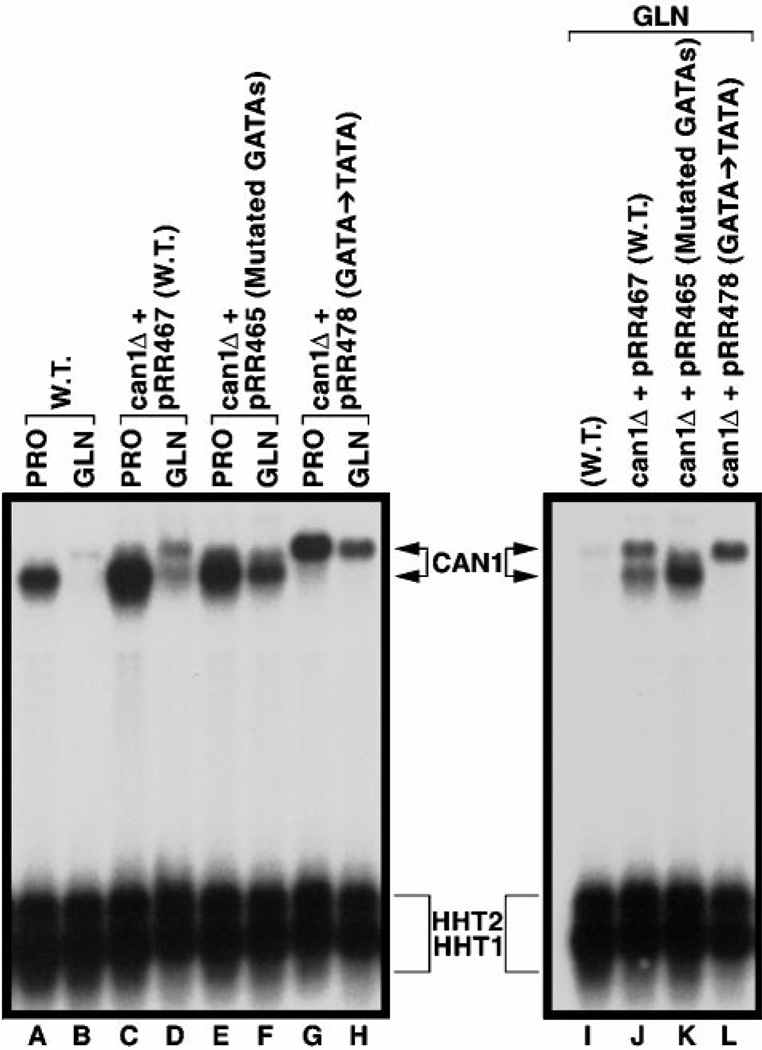
If the upper species results from the CAN1 GATAAs functioning as TATAs, its presence should depend upon the integrity of the GATAAs. To test this hypothesis, we cloned a full-length CAN1 gene, including its promoter region, into CENVI pRS316 and transformed the product (pRR467) into can1Δ strain BY4742-10305. When the transformant is grown with either proline or glutamine as the nitrogen source, the plasmidborne CAN1 gene responds in the same way as its genomic counterpart with the exception that the plasmid-borne gene supports more expression (Fig. 6, lanes A–D). We repeated this experiment replacing CAN1 pRR467 with can1 pRR465 in which each of the clustered GATAAs was mutated (Fig. 4). As predicted by the hypothesis, the upper species was absent in RNA samples from the pRR465 transformant irrespective of the nitrogen source (Fig. 6, lanes E and F); the result is more easily seen when the RNA samples from glutamine-grown cells are resolved in adjacent lanes (Fig. 6, lanes J and K). Therefore, one or more of the mutated GATAAs are required for production of the upper RNA species.
Fig. 6. Northern blot analysis of steady-state CAN1 mRNA profiles when upstream GATA sequences are mutated.
RNA was isolated from wild type (W.T., lanes A, B, and I) or can1Δ cells transformed with pRR467 (lanes C, D, and J), pRR465 (lanes E, F, and K) or pRR478 (lanes G, H, and L) grown in either minimal glucose-proline (PRO) or minimal glucose-glutamine (GLN) medium and hybridized with a CAN1 probe (+22 to +1348). The blot containing lanes I–L is provided to facilitate a more direct comparison of the sizes of the CAN1 mRNA species from cells grown in minimal glucose-glutamine (GLN) medium.
Finally, we examined the effect of mutating the GATAA cluster to TATA sites by changing GATAA to tATAA (pRR478) (Fig. 4). Note that a G → T substitution in a GATAA element destroys its UASNTR function (16). Not only was transcriptional initiation, under repressive nitrogen conditions, returned to the distal 5′ start site, but it became the start site under derepressing conditions as well (Fig. 6, lanes G, H and L). All of the upper species in this figure represent extension of the 5′-untranslated region as shown by Northern analysis using the 5′-specific probe, P12 (data not shown).
Two additional observations appear in Fig. 6, lanes E, F, and K. First, residual NCR-sensitive expression of the lower species remains in the pRR465 transformant (lanes E and F). This most likely derives from the CAN1 promoter in pRR465 being wild type except for the GATA cluster mutations and hence containing two additional GATAA sequences, one just upstream of the native TATAA (Fig. 4). Second, an intermediate species present in Fig. 1, lane E, is again present in Fig. 6, lanes F and K. It may also account for the upper portions of signals in Fig. 6, lanes C and E, but resolution is insufficient to make that conclusion confidently. This species depends upon the absence of Gat1p and the presence of Gln3p (Fig. 1, lanes E and F). Importantly, it disappears in the pRR478 transformant containing TATAA elements in place of the GATAA cluster (Fig. 6, lanes G, H, K, and L). We concluded the lower and intermediate species in Fig. 6, lanes E, F, and K, derived from unmutated GATA sequences remaining in pRR465 and, hence, did not investigate them further.
Gln3p Appears in the Nucleus Only When There Is Gln3p-dependent Transcription
The above experiments demonstrate that CAN1 transcription in repressive medium is functionally equivalent to CAN1 transcription in a gln3Δ (Fig. 1, lanes A–D). In both cases, CAN1 GATAAs appear able to function as TATA elements, although weak ones, leading to the hypothesis that the GATAA sequences are available to bind TATA-binding protein. The pertinent question is why does Gln3p fail to bind to the GATA sequences under repressive conditions? (i) Is Gln3p in the nucleus but modified so as to prevent binding to GATA sequences? (ii) Is Gln3p absent from the nucleus? We correlated the location of Gln3p in the presence and absence of Gln3p-dependent transcription using EGFP-GLN3 fusion pRR482 transformed into wild type strain GYC86. After growth in YNB raffinose ammonia medium, and 3 or more hours induction with galactose, cultures were harvested for Northern blot analysis or viewed microscopically. This plasmid and the preceding conditions were used because they were the only ones that yielded sufficient fluorescence for photomicroscopy. Cultures treated in this way express the Gln3p-dependent, NCR-sensitive DAL5 gene at high levels (Fig. 7, lane B). Although NCR-sensitive gene expression would normally be repressed under the conditions of this experiment (Fig. 7, lane A), we have shown elsewhere that overexpression of a GATA factor gene suppresses NCR sensitivity (39). A high percentage of cells treated in this way exhibit galactose induction-dependent nuclear fluorescence (Fig. 8), which co-localizes with DAPI-staining material (Fig. 8, O–Q). Although Gln3p is found predominantly in the nucleus, there is faint cytoplasmic staining as well.
Fig. 8. EGFP-GLN3 expressed in wild type strain GYC86 transformed with pRR482.
Cells and slides were prepared as described under “Materials and Methods.” Images in frames A–N, R, and S were made using a GFP filter set. Frames O–Q demonstrate co-localization of GFP fluorescence (frame P) and DAPI-positive staining (frame O). In Frame Q, DAPI-positive staining was pseudo-colored red. The image containing the pseudo-colored material was then superimposed on the image in frame P. The two images in frame Q were aligned using only the margins of the cells, not the DAPI- or GFP-positive regions.
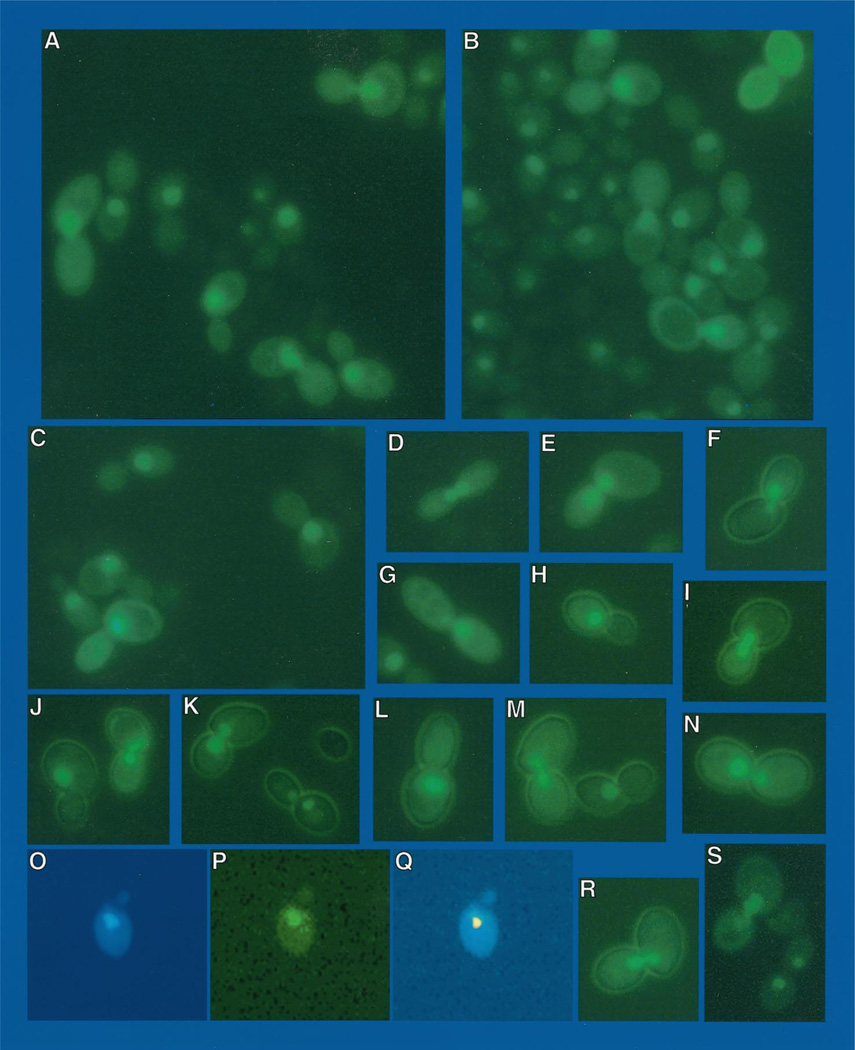
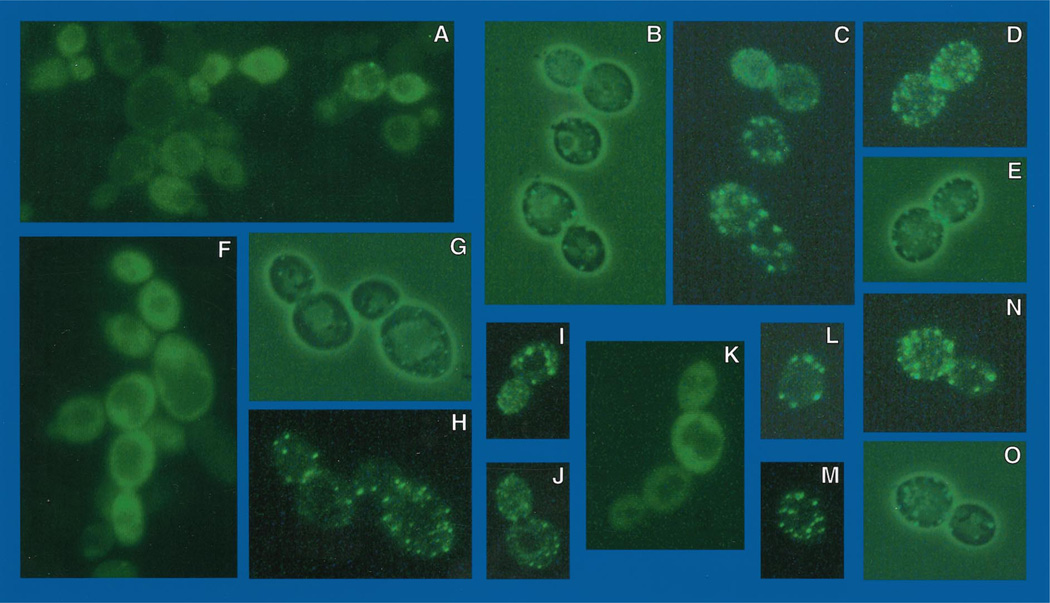
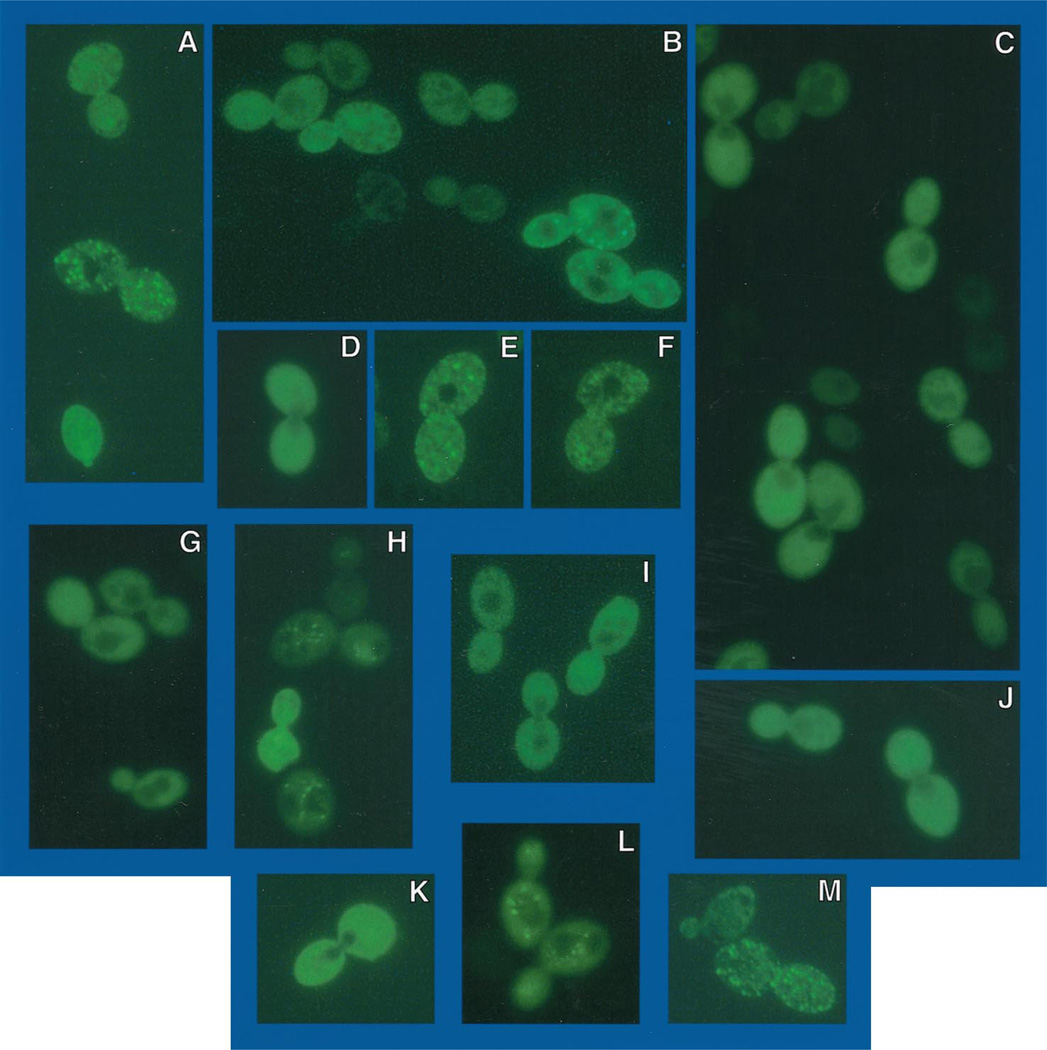
To determine the location of Gln3p under conditions where its function is repressed by Ure2p, we transformed pRR482 into RRTCY57 (and TCY57), containing an integrated copy of GAL1,10-URE2; hence both Ure2p and EGFP-Gln3p are overproduced. Under these conditions, which are similar to those used to show immunoprecipitation of Gln3p-Ure2p (13), DAL5 expression is greatly diminished (Fig. 7, lane C). In addition, the longer DAL5 transcript observed under repressive growth conditions also appears (Fig. 7, lane C). When transformants are viewed shortly after induction with galactose (3 h), nuclear fluorescence is absent; fluorescent material is rather distributed evenly throughout the cytoplasm but not the vacuole (Fig. 9, A, F, and K). After longer induction (4–5 h), fluorescent material is localized almost exclusively in punctate spots (Fig. 9, B–E, H–J, and L–N). We observed many instances in which the fluorescent spots were situated around the periphery of the cell (Fig. 9, C, D, H, and L–N). In others, the spots were situated adjacent to the vacuole (Fig. 9I). As a control, the experiment in Fig. 9 was repeated using EGFP-URE2 pNVS22 (Fig. 10). The fluorescent material was distributed similarly to that of EGFP-Gln3p in cells overproducing Ure2p (Fig. 9). Early after induction EGFP-Ure2p, fluorescence was uniformly distributed throughout the cytoplasm (Fig. 10, C, D, G, and I–K). Later (4–5 h) fluorescence was punctate (Fig. 10, A, B, E, F, H, L, andM), and in some instances the punctate spots again surrounded the vacuole (Fig. 10L). The results with EGFP-Ure2p are the same as those previously reported by Wickner and colleagues (29).
Fig. 9. EGFP-GLN3 expressed in GAL1,10-URE2 strain TCY57 that overproduces Ure2p.
Cell and slide preparation were as in Fig. 8 except where noted otherwise. Frames B, E, G, and O were viewed with visible and UV light to show the morphology of the cells. Frames A, C, D, F, H, and I–N were viewed with UV light and GFP filter set. Cells in frames A, F, and K were viewed 3 h post-induction with 4% galactose, and the remainder were viewed at 4–5 h post-induction. Data obtained with TCY57 and RRTCY57 were identical.
Fig. 10. EGFP-URE2 expressed in strain GYC86 transformed with pNVS22.
Cell and slide preparation were as in Fig. 9. Cells in frames B, C, D, G, and I–K were viewed at 3 h, frames A, E, F, and M at 5 h, and frames H and L at 6 h post-induction with 4% galactose.
DISCUSSION
We have shown that CAN1 expression generates two transcripts as follows: (i) a rapidly migrating species with a profile characteristic of NCR-sensitive, Gln3p-dependent expression, and (ii) a less rapidly migrating species whose profile is just the opposite, present only when RNA is prepared from wild type cells cultured in glutamine medium or in gln3Δ and gln3Δgat1Δ mutants. The requirement of the clustered CAN1 GATAA or TATAA sequences for the upper species to appear suggests that these GATA sequences can serve as surrogate TATAA elements under repressive growth conditions or when GLN3 is deleted. Similar functioning of GATAA sequences as surrogate TATA elements has been reported for higher eucaryotic cells (26–28). The presence of “variant TATAs” (GATAAs) situated upstream of the normal CAN1 TATAA can account for the production of the longer CAN1 mRNA species we observed earlier (15, 19). Our EGFP-Gln3p and EGFP-Ure2p experiments correlate the localization of Gln3p with its ability to support transcription. When Gln3p-mediated transcription is high, Gln3p is localized to the nucleus, and when transcription is minimal, Gln3p is cytoplasmic. The nearly identical intracellular localization of EGFP-Gln3p in a cell overproducing Ure2p and EGFP-Ure2p is consistent with the formation of a Ure2p-Gln3p complex as suggested earlier (13). When these correlations are considered in light of experiments showing that the extent of NCR-sensitive transcription depends upon the relative levels of GATA factor and Ure2p production (39), they argue that NCR is imposed by Gln3p complexing with Ure2p which prevents it from reaching its target GATAA-binding sites in the nucleus.
During the preparation of this manuscript, four reports of experiments investigating the role played by TOR proteins in starvation appeared simultaneously and reached conclusions more or less similar to one another and to ours (30–33). The most detailed experiments were those of Hall and collaborators (30) which led them to conclude that when cells grown in rich medium are treated with the immunosuppressant drug, rapamycin, Gln3p is dephosphorylated in a Sit4p-dependent manner and enters the nucleus. In rich medium, Gln3p is predominantly cytoplasmic. An earlier report by Edskes et al. (34) identified Mks1p as another of the regulatory molecules that compose the signal transduction pathway that regulates Gln3p operation. Therefore, regulation of NCR-sensitive transcription can be anticipated to share characteristics of the cytoplasmic-nuclear trafficking that regulates operation of the PHO and stress-sensitive transcription factors (35–37). However, much remains to be done before all of the existing (and sometimes conflicting) data can be rectified, and a complete, cohesive picture of NCR-sensitive transcription and its relation to nitrogen starvation is understood. In this regard, it is pertinent to note that although some effects of nitrogen starvation are similar to those observed in relief of NCR, the two processes have been shown to be quite distinct (38). Therefore, it would be surprising if the nitrogen starvation and NCR control pathways are found to be identical.
Acknowledgments
We thank Dr. A. T. Abul-Hamd for URE2 pAA19, the UT Yeast Group for suggested improvements to the manuscript, and Tim Higgins for preparing the figures.
Footnotes
This work was supported by National Institutes of Health Grant GM-35642.
The abbreviations used are: NCR, nitrogen catabolite repression; kb, kilobase pair; DAPI, 4′,6-diamidino-2-phenylindole; GFP, green fluorescent protein; EGFP, enhanced green fluorescent protein.
REFERENCES
- 1.Grenson M, Mousset M, Wiame JM, Bechet J. Biochim. Biophys. Acta. 1966;127:325–338. doi: 10.1016/0304-4165(66)90387-4. [DOI] [PubMed] [Google Scholar]
- 2.Grenson M, Hou C, Crabeel M. J. Bacteriol. 1970;103:770–777. doi: 10.1128/jb.103.3.770-777.1970. [DOI] [PMC free article] [PubMed] [Google Scholar]
- 3.Cooper TG. In: The Molecular Biology of the Yeast Saccharomyces: Metabolism and Gene Expression. Strathern JN, Jones EW, Broach J, editors. Cold Spring Harbor, NY: Cold Spring Harbor Laboratory; 1982. pp. 39–99. [Google Scholar]
- 4.ter Schure EG, van Riel NA, Verrips CT. FEMS Microbiol. Rev. 2000;24:67–83. doi: 10.1111/j.1574-6976.2000.tb00533.x. [DOI] [PubMed] [Google Scholar]
- 5.Cooper TG. Mycota. 1996;3:139–169. [Google Scholar]
- 6.Wickner RB. Science. 1994;264:566–569. doi: 10.1126/science.7909170. [DOI] [PubMed] [Google Scholar]
- 7.Maddelein M-L, Wickner RB. Mol. Cell Biol. 1999;19:4516–4524. doi: 10.1128/mcb.19.6.4516. [DOI] [PMC free article] [PubMed] [Google Scholar]
- 8.Courchesne WE, Magasanik B. J. Bacteriol. 1988;170:708–713. doi: 10.1128/jb.170.2.708-713.1988. [DOI] [PMC free article] [PubMed] [Google Scholar]
- 9.Coffman JA, Rai R, Cunningham T, Svetlov V, Cooper TG. Mol. Cell. Biol. 1996;16:847–858. doi: 10.1128/mcb.16.3.847. [DOI] [PMC free article] [PubMed] [Google Scholar]
- 10.Coffman JA, el Berry HM, Cooper TG. J. Bacteriol. 1994;176:7476–7483. doi: 10.1128/jb.176.24.7476-7483.1994. [DOI] [PMC free article] [PubMed] [Google Scholar]
- 11.Drillen R, Aigle M, Lacroute F. Biochem. Biophys. Res. Commun. 1973;53:367–372. doi: 10.1016/0006-291x(73)90671-2. [DOI] [PubMed] [Google Scholar]
- 12.Drillien R, Lacroute F. J. Bacteriol. 1972;109:203–208. doi: 10.1128/jb.109.1.203-208.1972. [DOI] [PMC free article] [PubMed] [Google Scholar]
- 13.Blinder D, Coschigano P, Magasanik B. Bacteriol. 1996;178:4734–4736. doi: 10.1128/jb.178.15.4734-4736.1996. [DOI] [PMC free article] [PubMed] [Google Scholar]
- 14.Cooper TG, Kovari L, Sumrada RA, Park H-D, Luche RM, Kovari I. J. Bacteriol. 1991;174:48–55. doi: 10.1128/jb.174.1.48-55.1992. [DOI] [PMC free article] [PubMed] [Google Scholar]
- 15.Daugherty JR, Rai R, ElBerry HM, Cooper TG. J. Bacteriol. 1993;175:64–73. doi: 10.1128/jb.175.1.64-73.1993. [DOI] [PMC free article] [PubMed] [Google Scholar]
- 16.Bysani N, Daugherty JR, Cooper TG. J. Bacteriol. 1991;173:4977–4982. doi: 10.1128/jb.173.16.4977-4982.1991. [DOI] [PMC free article] [PubMed] [Google Scholar]
- 17.Scott S, Dorrington R, Svetlov V, Beeser AE, Distler M, Cooper TG. J. Biol. Chem. 2000;275:7198–7204. doi: 10.1074/jbc.275.10.7198. [DOI] [PMC free article] [PubMed] [Google Scholar]
- 18.Cox K, Pinchak AB, Cooper TG. Yeast. 1999;15:703–713. doi: 10.1002/(SICI)1097-0061(19990615)15:8<703::AID-YEA413>3.0.CO;2-Z. [DOI] [PubMed] [Google Scholar]
- 19.Coffman JA, Rai R, Cooper TG. J. Bacteriol. 1995;177:6910–6918. doi: 10.1128/jb.177.23.6910-6918.1995. [DOI] [PMC free article] [PubMed] [Google Scholar]
- 20.Coffman JA, Rai R, Loprete DM, Cunningham T, Svetlov V, Cooper TG. J. Bacteriol. 1997;179:3416–3429. doi: 10.1128/jb.179.11.3416-3429.1997. [DOI] [PMC free article] [PubMed] [Google Scholar]
- 21.Kraus RJ, Murray EE, Wiley SR, Zink NM, Loritz K, Gelembiak GW, Mertz JE. Nucleic Acids Res. 1996;24:1531–1539. doi: 10.1093/nar/24.8.1531. [DOI] [PMC free article] [PubMed] [Google Scholar]
- 22.Bucher PRG. Nucleic Acids Res. 1986;14:1009–1026. [Google Scholar]
- 23.Rai R, Daugherty JR, Cooper TG. Yeast. 1995;11:247–260. doi: 10.1002/yea.320110307. [DOI] [PubMed] [Google Scholar]
- 24.Hahn S, Hoar ET, Guarente L. Proc. Natl. Acad. Sci. U. S. A. 1985;82:8562–8566. doi: 10.1073/pnas.82.24.8562. [DOI] [PMC free article] [PubMed] [Google Scholar]
- 25.Chen W, Struhl K. Proc. Natl. Acad. Sci. U. S. A. 1988;85:2691–2695. doi: 10.1073/pnas.85.8.2691. [DOI] [PMC free article] [PubMed] [Google Scholar]
- 26.Singer VL, Wobbe CR, Struhl K. Genes Dev. 1990;4:636–645. doi: 10.1101/gad.4.4.636. [DOI] [PubMed] [Google Scholar]
- 27.Fong TC, Emerson BM. Genes Dev. 1992;6:521–532. doi: 10.1101/gad.6.4.521. [DOI] [PubMed] [Google Scholar]
- 28.Aird WC, Parvin JD, Sharp PA, Rosenberg RD. Proc. Natl. Acad. Sci. U. S. A. 1994;269:883–889. [PubMed] [Google Scholar]
- 29.Edskes HK, Gray VT, Wickner RB. Proc. Natl. Acad. Sci. U. S. A. 1999;96:1498–1503. doi: 10.1073/pnas.96.4.1498. [DOI] [PMC free article] [PubMed] [Google Scholar]
- 30.Beck T, Hall MN. Nature. 1999;402:689–692. doi: 10.1038/45287. [DOI] [PubMed] [Google Scholar]
- 31.Cardenas ME, Cutler NS, Lorenz M, Di Como CJ, Heitman J. Genes Dev. 1999;13:3271–3279. doi: 10.1101/gad.13.24.3271. [DOI] [PMC free article] [PubMed] [Google Scholar]
- 32.Hardwick JS, Kuruvilla FG, Tong JK, Shamji AF, Schreiber S. Proc. Natl. Acad. Sci. U. S. A. 1999;96:14866–14870. doi: 10.1073/pnas.96.26.14866. [DOI] [PMC free article] [PubMed] [Google Scholar]
- 33.Hardwick JS, Tong JK, Schreiber SL. Nat. Genet. 1999;23:49. [Google Scholar]
- 34.Edskes HK, Hanover JA, Wickner RB. Genetics. 1999;153:585–594. doi: 10.1093/genetics/153.2.585. [DOI] [PMC free article] [PubMed] [Google Scholar]
- 35.Oshima Y. Genes Genet. Syst. 1997;72:323–334. doi: 10.1266/ggs.72.323. [DOI] [PubMed] [Google Scholar]
- 36.Gorner W, Durchschlag E, Martinez-Pastor MT, Estruch F, Ammerer G, Hamilton B, Ruis H, Schuller C. Genes Dev. 1998;12:586–597. doi: 10.1101/gad.12.4.586. [DOI] [PMC free article] [PubMed] [Google Scholar]
- 37.Reiser V, Ruis H, Ammerer G. Mol. Biol. Cell. 1999;10:1147–1161. doi: 10.1091/mbc.10.4.1147. [DOI] [PMC free article] [PubMed] [Google Scholar]
- 38.Beeser AE, Cooper TG. J. Bacteriol. 1999;181:2472–2476. doi: 10.1128/jb.181.8.2472-2476.1999. [DOI] [PMC free article] [PubMed] [Google Scholar]
- 39.Cunningham TS, Andhare R, Cooper TG. J. Biol. Chem. 2000;275:14408–14414. doi: 10.1074/jbc.275.19.14408. [DOI] [PMC free article] [PubMed] [Google Scholar]


