. 2015 Feb 4;4:e06156. doi: 10.7554/eLife.06156

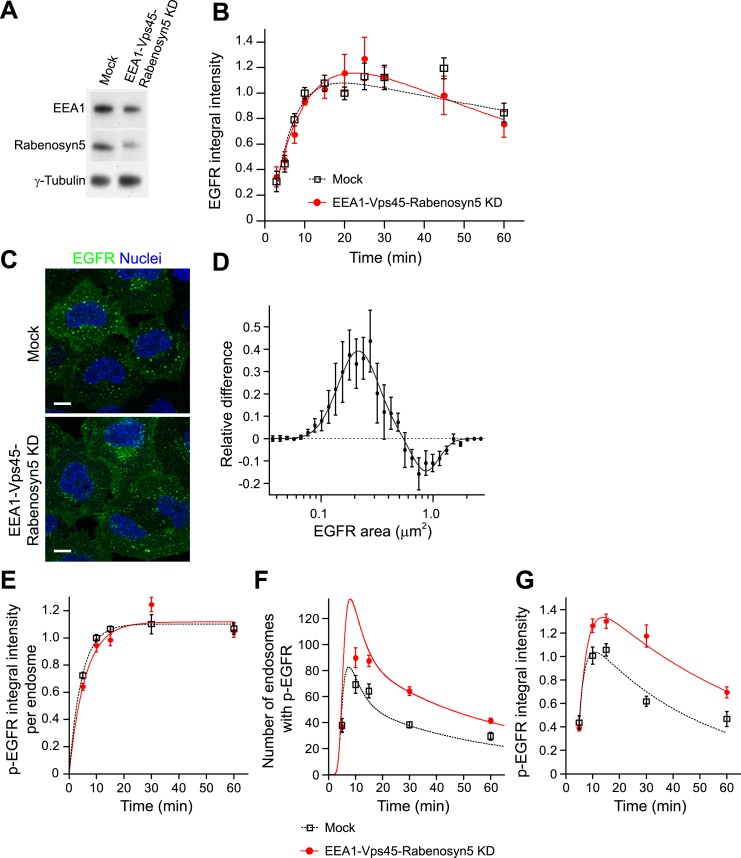
Figure 4. Increasing the number and life-time of p-EGFR endosomes results in prolonged EGFR activation.

(A) Protein down-regulation of EEA1 and Rabenosyn5 72 hr after siRNA transfection. RT-PCR showed an 80% reduction in Vps45 mRNA levels (data not shown). (B) Time course of EGFR integral intensity in endosomes after partial protein depletion of EEA1, Rabenosyn5, and Vps45 (red curve) or mock treatment (black curve). Cells were given a 1-min pulse of 10 ng/ml EGF, washed and chased for the indicated time points before fixation. (C) Representative images of HeLa EGFR BAC cells after EEA1, Rabenosyn5, and Vps45 knock-down or treatment with transfection reagent only (mock). Scale bars, 10 μm. (D) Shift in the EGFR-endosome area distribution toward smaller endosomes after EEA1, Rabenosyn5, and Vps45 knock-down. The values of the histograms of endosome area distribution for the control and knock-down conditions were normalized and subtracted. The curve shows the relative increase (above zero) or reduction (below zero) in the number of endosomes for each area bin (in logarithmic scale) (for details see ‘Materials and methods’ and Figure 6—figure supplement 2). Experimental points were fitted with two log-normal distributions. (EG) Changes in p-EGFR endosomes in EEA1, Rabenosyn5, and Vps45 knock-down (red curve) or mock-treated (black curve) cells after continuous stimulation with 10 ng/ml EGF. Time courses of the mean integral intensity of p-EGFR per endosome (E), mean number of p-EGFR endosomes determined experimentally (squares) or predicted by the mathematical model (solid curves) for a 37% endosomes fusion rate (red curve) compared to control (black curve) (F), and total p-EGFR integral intensity in endosomes (G) measured as in Figure 1. Intensity curves were normalized to the intensity value at 10 min for mock-treated cells. Experimental points show mean ± SEM. All measurements were done in three independent experiments with a total of ∼150 cells per time point or condition. Time courses were fitted as in Figure 1.

DOI: http://dx.doi.org/10.7554/eLife.06156.025

Figure 4.

Figure 4—figure supplement 1. Knock-down of fusion machinery does not change EGFR distribution at the plasma membrane in HeLa cells.

Figure 4—figure supplement 1.

Cells were stimulated with 100 ng/ml EGF-AlexaFluor 488 for 10 min on ice to prevent receptor endocytosis. The AlexaFluor 488 signal was enhanced by detection with a specific antibody to detect the amount of EGFR at the plasma membrane. Scale bar, 10 μm. (A) Representative images of HeLa EGFR BAC cells after EEA1, Rabenosyn5, and Vps45 knock-down or treatment with transfection reagent only (mock). (B) Total intensity of EGF-AlexaFluor 488 (Mean ± SEM) in knock-down or control cells. The total intensity was normalized to the fraction of the area covered by cells. Measurements were done in three independent replicates with a total of ∼150 cells per time point or condition.

Figure 4—figure supplement 2. Knock-down of fusion machinery does not change EGFR degradation in HeLa cells.

Figure 4—figure supplement 2.

(AB) Time course of EGFR degradation after partial protein depletion of the three endosomal fusion components EEA1, Rabenosyn5, and Vps45 or mock treatment and continuous stimulation with 10 ng/ml EGF for the indicated times in the presence of 10 μg/ml cyclohexamide in HeLa EGFR BAC cells. (A) Representative EGFR and γ-Tubulin Western blots and (B) their quantification for EEA1, Rabenosyn5, and Vps45 knock-down (red curve) or mock-treated (black curve) samples. Points show mean ± SEM from three independent experiments. Lines are linear fits to the experimental points.

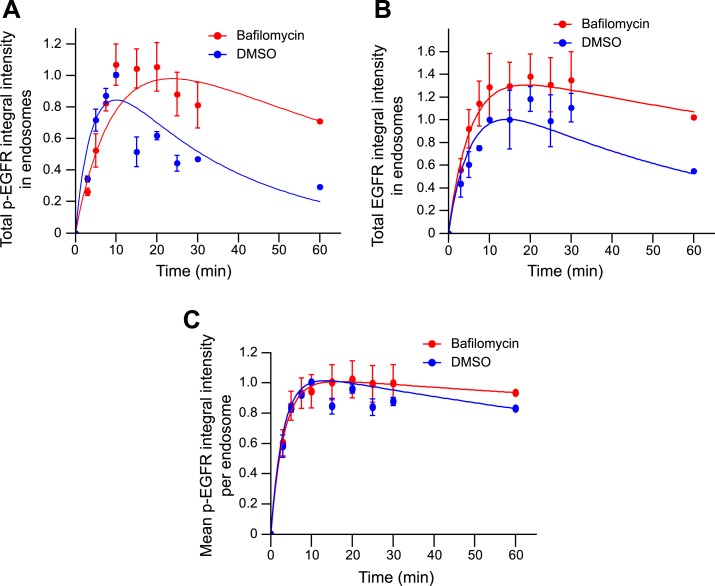
Figure 4—figure supplement 3. Blocking endosome acidification with Bafilomycin increases both total EGFR and p-EGFR, but not the mean amount of p-EGFR per endosome.

Figure 4—figure supplement 3.

(A) Time course of p-EGFR integral intensity in endosomes after incubation with 50 nM BafilomycinA1 (red curve) or 1% DMSO (blue curve) for 30 min and during the remaining of the time course. (B) Time course of EGFR integral intensity in endosomes after incubation with 50 nM BafilomycinA1 (red curve) or 1% DMSO (blue curve) for 30 min and during the remaining of the time course. (C) Time course of the mean p-EGFR integral intensity per endosome after incubation with 50 nM BafilomycinA1 (red curve) or 1% DMSO (blue curve) for 30 min and during the remaining of the time course. Experimental points show mean ± SEM. All measurements were done in three independent experiments with a total of ∼150 cells per time point and condition. Time courses were fitted as in Figure 1.