Abstract
Traditionally, ballistocardiogram (BCG) has been measured using large and stationary devices. In this work, we demonstrate a portable and continuous BCG monitor that is wearable at the ear. The device has the form factor of a hearing aid and is wirelessly connected to a PC for data recording and analysis. With the ear as an anchoring point, the device uses a MEMS tri-axial accelerometer to measure BCG at the head. Morphological differences exist between head BCG and traditional BCG, but the principal peaks (J waves) and their vectors are preserved. The frequency of J waves corresponds to heart rate, and when used in conjunction with an electrocardiogram's (ECG) R wave, the timing of J waves yields the RJ interval. Results from our clinical study show linear correlation between the RJ interval and the heart's pre-ejection period during hemodynamic maneuvers, thus revealing important information about cardiac contractility and its regulation.
I. Introduction
Ballistocardiogram (BCG) is a measure of the body's mechanical reaction to the blood ejected during systole. BCG was pioneered by the works of Gordon and Starr, who demonstrated the medical merits of BCG with its ability to measure heart rate and cardiac output [1] [2].
Additional physiological significance has been discovered with the combined usage of BCG and electrocardiogram (ECG), which yields the RJ interval, defined as the delay between ECG's ventricular depolarization (R wave) and BCG's principal peak (J wave) [3] [4]. The RJ interval is shown to correlate to the heart's pre-ejection period (PEP), which relates to cardiac contractility [4] [5] [6].
Since BCG's inception, the standard method of BCG measurement has involved the subject lying on a low friction bed. The displacement of the bed is then captured as BCG. Recently, alternative methods using a pneumatic chair or a strain-sensing foot scale have proven successful [7] [8]. However, all of these methods require a large and stationary BCG measurement device that provides only intermittent measurements of the BCG.
Meanwhile, the magnetic resonance imaging (MRI) society has recognized ballistocardiographic head movements as a source of motion artifacts in MRI [9] [10], which motivated us to seek the BCG measurement at the head. This approach enables a significant reduction of the device size. Inspired by hearing aids, we choose the ear as the measurement location. The ear offers mechanical anchoring and stability in a discreet manner with minimal use of adhesives [11].
In this work, we demonstrate a wearable and wireless system for continuous BCG monitoring that is worn at the ear and has the form factor of a hearing aid [12]. This device allows for long-term measurements of head BCG in various postures, and when combined with ECG, can yield the RJ interval.
II. System Description
To sense the BCG at the head in a portable and wearable manner, we use a MEMS tri-axial digital accelerometer. Because head BCG is in the range of 10mGp−p, a highly sensitive and low noise accelerometer is needed. We choose Bosch's BMA180 accelerometer for its 14-bit resolution and 0.69mGRMS of measured noise at 10Hz bandwidth with ±2G range.
The accelerometer is housed inside a modified hearing aid case, which is anchored to the ear through an ear bud. In addition to the accelerometer, the device contains an ECG frontend (for RJ interval measurements), power management circuits, a microcontroller, a 2.4GHz wireless transceiver, and a lithium coin cell battery. Wireless data is received at a PC via a custom-made USB dongle. The PC analyzes and plots the data in real time using MATLAB, which also performs 1 – 10Hz bandpass filtering of the accelerometer data. The entire system is shown in Fig. 1 with labeled components.
Fig. 1.
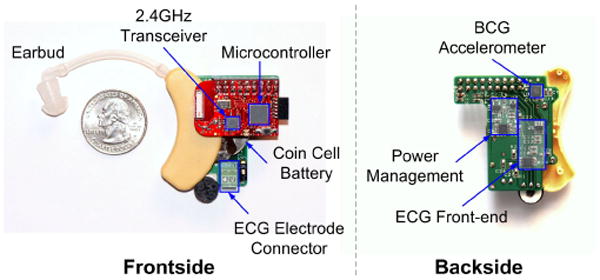
The front and back sides of the wearable head BCG monitor with labeled components.
Fig. 2 shows the device being worn at the ear. In its current prototype, the device is large because it uses discrete components for ease of testing. Work is currently underway to significantly reduce the device size by using custom integrated circuits and by removing the debugging components.
Fig. 2.
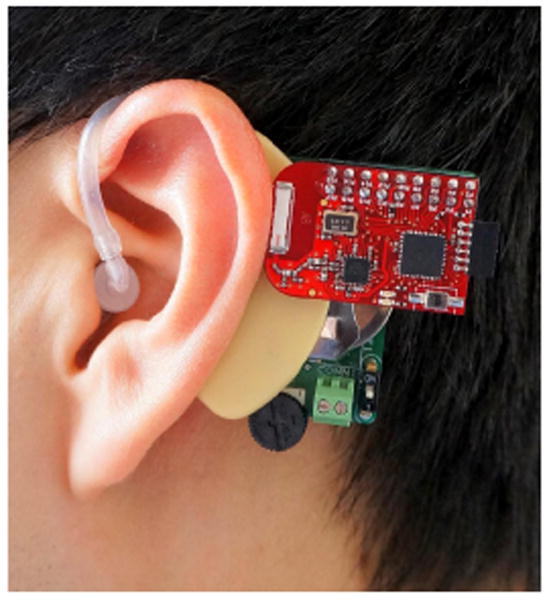
The wireless head BCG monitor being worn at the ear.
III. Measuring Head Ballistocardiogram
Fig. 3 shows a BCG measurement at the head in the upright standing posture. The morphology of the head BCG differs from the traditional full-body BCG because motion is constrained in the y-axis (headward-footward direction) by the ground. However, the axis with the dominant BCG signal remains the y-axis, which is also the axis of blood volume shifts that cause the traditional BCG signal. More specifically, the principal peak (J wave) is in the headward (positive y) direction. This is consistent with the fact that the J wave is due to an opposite reaction to the footward (negative y) acceleration of blood in the descending and abdominal aorta [13].
Fig. 3.
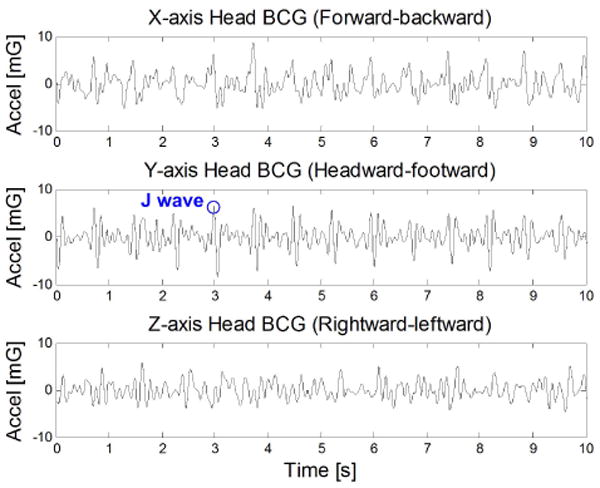
Measured tri-axial head BCG in the standing posture.
To demonstrate that head BCG can be measured in different postures, Fig. 4 shows the y-axis (headward-footward) measurements in standing, sitting, and supine postures. The y-axis is the dominant axis of head BCG in all three positions. However, in the supine position, the higher frequency accelerations are dampened by static friction with the stationary bed.
Fig. 4.
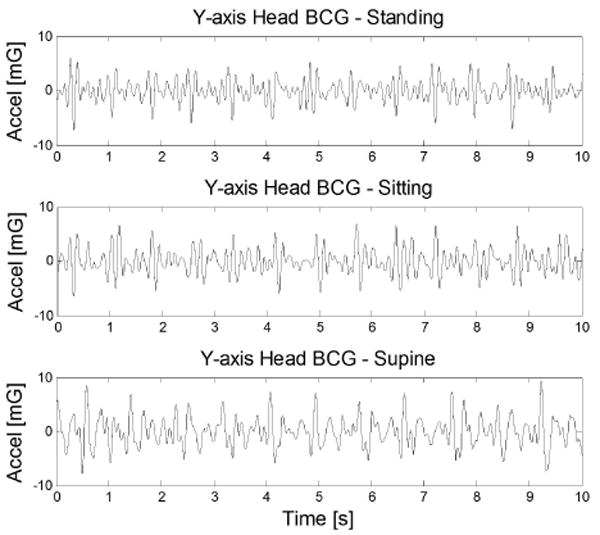
Measured y-axis head BCG in various postures.
Because head BCG is in the range of only 10mGp−p, it can only be measured in states of relative rest. For example, walking generates excessive acceleration of hundreds of mG's that are in the same frequency range as head BCG, thus effectively masking the BCG signal. However, for the target application of long term wearable monitoring, it is possible to form trends from measurements throughout the day when the wearer is not moving excessively.
IV. Measuring Head Electrocardiogram for R-wave Timing
To obtain the RJ interval, the ECG's R wave timing is needed. To avoid ECG wires from the ear to the chest, we measure ECG locally near the ear [12]. In this configuration, one electrode is placed on the mastoid area, while the second electrode is placed on the upper neck. To reduce electrode area, no third driven-right-leg electrode is used. Instead, any common mode interference is reduced digitally. Fig. 5 shows simultaneously measured head ECG and head BCG.
Fig. 5.
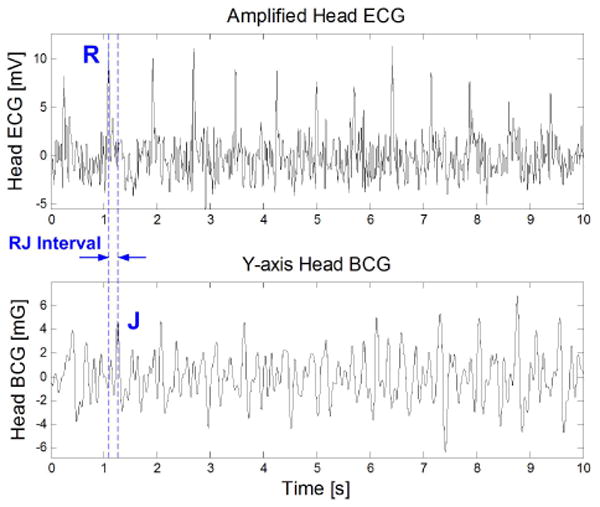
Simultaneously measured head ECG and head BCG (y-axis) with RJ interval denoted.
One can observe in Fig. 5 that head ECG has a lower signal-to-noise ratio compared to chest ECG. This is due to its farther distance from the heart and its shorter inter-electrode distance. However, this signal quality is sufficient for this application because only the R-wave timing is needed.
V. Heart Rate Measurements
A clinical study is performed (MIT IRB protocol #1104004449) consisting of postural changes, head-up tilt, and Valsalva maneuvers.
To demonstrate the ability to extract heart rate from head BCG, Fig. 6 shows simultaneously extracted heart rates from ECG and head BCG from four subjects in postures of standing, sitting, and supine.
Fig. 6.
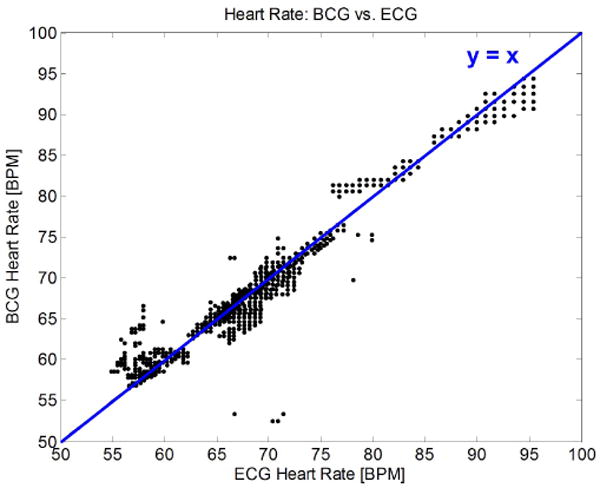
A comparison of simultaneously measured heart rates from head BCG and ECG, using 1,330 seconds of data from four subjects in postures of standing, sitting, and supine. The perceived decrease in data resolution at higher heart rates is due to time quantization from sampling.
As shown in Fig. 6 and Table I, head BCG can be employed to continuously monitor heart rate in states of rest with accuracy near that of ECG, but without the use of electrodes or adhesives.
Table 1. Mean absolute error of measured heart rate from head BCG compared to ECG, using the dataset in Fig. 6.
| Posture | Standing | Sitting | Supine |
|---|---|---|---|
| Mean absolute HR error [beats/min] | 0.72 | 1.27 | 0.84 |
VI. RJ Interval Measurements
The RJ interval is defined as the delay between ECG's R wave and BCG's J wave (Fig. 5). As previously mentioned, the RJ interval's physiological relevance lies in its correlation to pre-ejection period (PEP). The BCG and ECG signals at the head have low amplitudes in the respective ranges of 10mGp−p and 30μVp−p, thus leading to low signal-to-noise ratios. To automatically extract RJ intervals from these two signals, we use cross-correlation as described in [12].
For the study subjects, two hemodynamic maneuvers are performed to induce changes in PEP. The RJ interval is measured by the ear device, while the PEP is simultaneously measured using a BioZ Impedance Cardiograph (ICG).
Fig. 7 shows an example of measured RJ interval and PEP from a subject who performed a Valsalva maneuver from 50s to 80s. During the strain, PEP lengthens because the ventricular filling volume is decreased due to the intra-thoracic pressure [6] [14]. The PEP's increase of approximately 20ms is corresponded by an equal increase in the RJ interval.
Fig. 7.
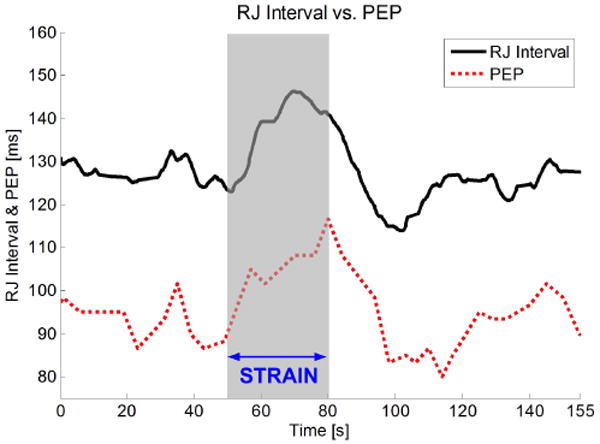
Simultaneously measured RJ interval and PEP during a Valsalva maneuver.
In the head-up tilt maneuver, the subject lies on a tilt table, and is tilted between 0° (supine) and 75° (tilted). An example of simultaneously measured RJ interval and PEP is shown in Fig. 8.
Fig. 8.
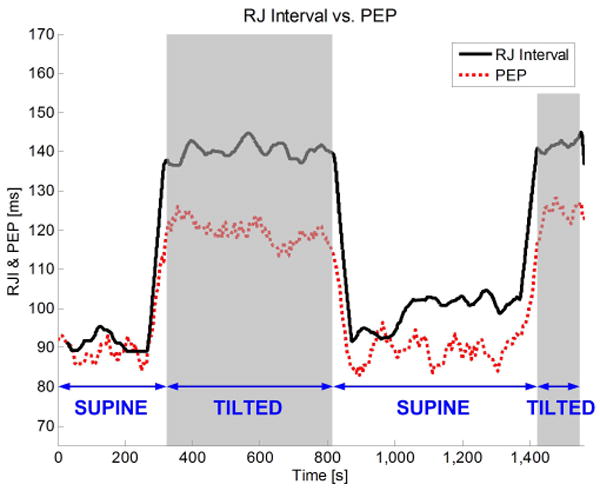
Simultaneously measured RJ interval and PEP on a subject that is tilted twice.
From Fig. 8, we see that PEP increases when the body is tilted. This increase is caused by the reduction of ventricular filling volume due to venous pooling [6] [14]. Similarly, the RJ interval also increases when the body is tilted. However, the changes in RJ interval are greater than in PEP. We hypothesize that this is because the RJ interval contains not only the PEP, but also a short duration of pulse transit time (PTT). In detail, the end of the PEP is marked by the opening of the aortic valve, but the J wave occurs after the blood wave has transited into the descending and abdominal aorta. The RJ interval's inclusion of this short duration of PTT leads to errors in estimating the PEP.
Fig. 9 plots the beat-to-beat RJ interval versus PEP for the subjects in the study. As expected, the RJ interval exhibits a linear dependence on PEP in all subjects. However, there is subject-to-subject variation in the relationship between RJ interval and PEP. Again, the cause of this variation by PTT is hypothesized. In particular, the tilt test alters the subject's blood pressure, which changes PTT. Therefore, any subject-to-subject variation in blood pressure during the tilt test will lead to variations in RJ interval. Another hint to the inclusion of PTT is that the best-fit slopes of all subjects in Fig. 9 are greater than unity. This is consistent with the fact that when tilted upright, blood pressure decreases and PTT increases, thus making RJ interval increase more than PEP during the same maneuver. Additional processing is being investigated to improve PEP estimation by canceling the PTT component.
Fig. 9.
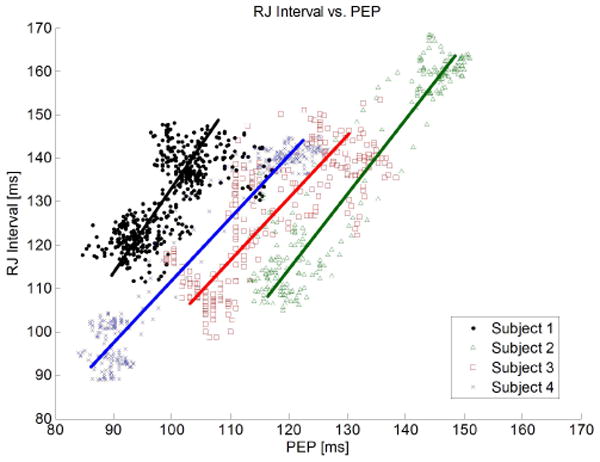
Beat-to-beat RJ interval and PEP among four subjects during 17 head-up tilt maneuvers, consisting of 1,341 beats.
VII. Conclusions and Future Work
In summary, measurement results from a wearable BCG monitor at the ear have been demonstrated. This device allows continuous and wireless measurements of head BCG when the subject is not in motion. One direct application of head BCG is heart rate monitoring without using electrodes. However, with the addition of ECG, the RJ interval can be extracted. Our clinical study confirms that the RJ interval correlates to PEP during maneuvers that change the hemodynamic state of our test subjects. PEP is an important heart interval that relates to cardiac contractility and its control by the autonomic nervous system.
Work is currently underway to replace the existing radio with a Bluetooth radio that enables communication with portable devices such as smartphones for mobile monitoring. Meanwhile, integrated circuits are being designed to consolidate the discrete components to substantially decrease the size of the device. Future work also includes transitioning the heart interval analysis from the PC to the on-board microcontroller, which will drastically reduce the average power consumption of the radio.
Acknowledgments
The authors would like to thank Dr. Thomas Heldt (MIT), Tom O'Dwyer (Analog Devices Inc.), Catherine Ricciardi (MIT), and Ilene Horvitz for their assistance. Human subject testing was conducted at the MIT Catalyst Clinical Research Center under IRB approval #1104004449 and grant #UL1 RR025758.
This work was supported in part by the MIT Medical Electronic Device Realization Center (MEDRC).
Contributor Information
David Da He, Email: davidhe@mit.edu.
Eric S. Winokur, Email: ewinokur@mit.edu.
Charles G. Sodini, Email: sodini@mtl.mit.edu.
References
- 1.Gordon JW. On certain molar movements of the human body produced by the circulation. J Anat Physiol. 1877;11:533–536. [PMC free article] [PubMed] [Google Scholar]
- 2.Starr I, Rawson AJ, Schroeder HA, Joseph NR. Studies on the estimation of cardiac output in man, and of abnormalities in cardiac function, from the heart's recoil and the blood's impacts; the ballistocardiogram. American J Physiol. 1939;127(1):1–28. [Google Scholar]
- 3.Shin JH, Lee KM, Park KS. Non-constrained monitoring of systolic blood pressure on a weighing scale. Physiol Meas. 2009;30:679–693. doi: 10.1088/0967-3334/30/7/011. [DOI] [PubMed] [Google Scholar]
- 4.Inan OT, Etemadi M, Wiard RM, Kovacs TA, Giovangrandi L. Non-invasive Measurement of Valsalva-induced Hemodynamic Changes on a Bathroom Scale Ballistocardiograph. IEEE Eng in Med and Bio Conf. 2008 Aug;:674–677. doi: 10.1109/IEMBS.2008.4649242. [DOI] [PubMed] [Google Scholar]
- 5.Etemadi M, Inan OT, Wiard RM, Kovacs GTA, Giovangrandi L. Non-Invasive Assessment of Cardiac Contractility on a Weighing Scale. IEEE Eng in Med and Bio Conf. 2009 Sep;:6773–6776. doi: 10.1109/IEMBS.2009.5332508. [DOI] [PubMed] [Google Scholar]
- 6.Stafford RW, Harris WS, Weissler AM. Left Ventricular Systolic Time Intervals as Indices of Postural Circulatory Stress in Man. Circulation. 1970;41:485–492. doi: 10.1161/01.cir.41.3.485. [DOI] [PubMed] [Google Scholar]
- 7.Kim KK, et al. A new method for unconstrained pulse arrival time measurement on a chair. J Biomed Eng Res. 2006;27:83–88. [Google Scholar]
- 8.Inan OT, Etemadi M, Wiard RM, Giovangrandi L, Kovacs GTA. Robust ballistocardiogram acquisition for home monitoring. Physiol Meas. 2009;30(2):169. doi: 10.1088/0967-3334/30/2/005. [DOI] [PubMed] [Google Scholar]
- 9.Bonmassar G, et al. Motion and Ballistocardiogram Artifact Removal for Interleaved Recording of EEG and EPs during MRI. NeuroImage. 2001;16(4):1127–1141. doi: 10.1006/nimg.2002.1125. [DOI] [PubMed] [Google Scholar]
- 10.Benar CG, et al. Quality of EEG in simultaneous EEG-fMRI for epilepsy. Clinical Neurophysiology. 2003;114(3):569–580. doi: 10.1016/s1388-2457(02)00383-8. [DOI] [PubMed] [Google Scholar]
- 11.He D, Winokur ES, Heldt T, Sodini CG. The ear as a location for wearable vital signs monitoring. IEEE Eng in Med and Bio Conf. 2010 Sep;:6389–6392. doi: 10.1109/IEMBS.2010.5627309. [DOI] [PubMed] [Google Scholar]
- 12.He D, Winokur ES, Sodini CG. A continuous, wearable, and wireless heart monitor using head ballistocardiogram (BCG) and head electrocardiogram (ECG) IEEE Eng in Med and Bio Conf. 2011 Sep;:4729–4732. doi: 10.1109/IEMBS.2011.6091171. [DOI] [PubMed] [Google Scholar]
- 13.Weissler AM. Noninvasive Cardiology. Grune and Stratton, Inc.; New York, NY, USA: 1974. [Google Scholar]
- 14.Ermishkin VV, et al. Beat-by-beat changes in pre-ejection period during functional tests evaluated by impedance aortography: a step to a left ventricular contractility monitoring. Int'l Conf Elec Bioimpedance. 2007;17(14):655–658. [Google Scholar]


