

Abstract
Sequencing and exome-chip technologies have motivated development of novel statistical tests to identify rare genetic variation that influences complex diseases. Although many rare-variant association tests exist for case-control or cross-sectional studies, far fewer methods exist for testing association in families. This is unfortunate, because cosegregation of rare variation and disease status in families can amplify association signals for rare variants. Many researchers have begun sequencing (or genotyping via exome chips) familial samples that were either recently collected or previously collected for linkage studies. Because many linkage studies of complex diseases sampled affected sibships, we propose a strategy for association testing of rare variants for use in this study design. The logic behind our approach is that rare susceptibility variants should be found more often on regions shared identical by descent by affected sibling pairs than on regions not shared identical by descent. We propose both burden and variance-component tests of rare variation that are applicable to affected sibships of arbitrary size and that do not require genotype information from unaffected siblings or independent controls. Our approaches are robust to population stratification and produce analytic p values, thereby enabling our approach to scale easily to genome-wide studies of rare variation. We illustrate our methods by using simulated data and exome chip data from sibships ascertained for hypertension collected as part of the Genetic Epidemiology Network of Arteriopathy (GENOA) study.
Introduction
Many recent genetic studies of complex human traits have been designed to determine the effects of rare or less-common genetic variants on phenotype. These studies have used either next-generation sequencing technology (which enables complete interrogation of single-nucleotide variants throughout the human genome) or cheaper alternatives like the Illumina HumanExome Beadchip, which provides genotypes for nearly 250,000 markers, primarily protein-altering variants, that were identified from large-scale resequencing efforts (details on the Beadchip design available online; see Web Resources). These new technologies have spurred the development of powerful new statistical approaches for rare-variant association testing of complex traits. However, the majority of such tests are tailored for use in either case-control or population-based studies that assume unrelated subjects. Fewer rare-variant association tests exist for family-based studies, which is unfortunate because families are uniquely suited for studying rare variants.
Family-based studies of rare variants possess many valuable attributes that population studies lack. Rare susceptibility variants are likely to be enriched in affected relatives and therefore be easier to detect relative to population-based counterparts.1,2 Family-based tests of rare-variant association can also be made robust to population stratification,3 which is important given recent work suggesting that existing common-variant-based methods to correct for stratification might not be as effective in studies of rare variants.4,5 Several projects have initiated collection of families for rare-variant analysis, including studies of epilepsy6 and simplex autism.7 Additionally, other projects have begun analysis of rare variants in familial samples collected from past linkage studies. One such project is the Genetic Epidemiology Network of Arteriopathy (GENOA) study,8 which has genotyped a large collection of African American sibships with hypertension for the Illumina HumanExome Beadchip. Other linkage studies were funded for rare-variant analysis via a NIH funding opportunity titled “Life After Linkage: The Future of Family Studies” (RFA-HL-12-007) that was sponsored by the National Heart, Lung, and Blood Institute.
To fully capitalize on the opportunities presented by sequencing family members originally recruited into linkage studies, it is necessary to develop new statistical tools for rare-variant analysis in such projects. Although several rare-variant methods exist for family-based analysis, some are entirely restricted to quantitative traits.9–12 Other family-based tests for use in complex diseases3,13–15 require information from both affected and unaffected individuals for inference. For the many linkage studies that collected only affected sibs, there might not be data from unaffected family members that can be used for inference. The use of historical controls is unappealing because of potential bias from population stratification4 as well as the need to account for differences in sequencing coverage.16 Thus, a statistical approach for rare-variant analysis in affected sibships that is self-contained and that does not require information from unaffected subjects is appealing.
We propose a strategy for association testing of rare variants in affected sibships that is motivated by the notion that, among affected sibling pairs, we would expect to observe more copies of rare susceptibility variants on haplotypes shared identical by descent by the pair than on haplotypes not shared identical by descent. We can evaluate this hypothesis without knowledge of haplotype phase by using an efficient-score test derived from an estimating-equation model. In this model, we regress the number of copies of rare variants an affected sib pair possesses on the number of loci they share that are identical by descent. Many family-based studies already have identity by descent (IBD) information from earlier linkage studies or GWASs but, if this is not the case, such information can be obtained from sequence data or common SNPs found on the Illumina HumanExome Beadchip. Although our approach uses IBD information for association testing, it is not a test of linkage and, as we will show, can detect rare-variant association signals in regions that do not harbor a significant linkage signal.
With our framework, we derive both “linear” or “burden” tests, which collapse multiple rare variants within a region of interest into a single composite variable and then test for association between that variable and IBD status,17–21 and “quadratic” or “variance-component” tests that compare pairwise similarity in IBD status to genotypic similarity within the sample.22,23 Adaptive procedures that combine aspects of both the burden and variance-component classes of tests are also possible24 but are not considered here. As we will show, our strategy is robust to confounding as a result of population stratification and can handle sibships of arbitrary size. Unlike existing rare-variant tests of complex diseases in pedigrees, our approach is tailored for analysis of datasets comprised entirely of affected sibships. That is, the approach does not require variant information from unaffected relatives, although such information can be used to assist in estimating IBD sharing among affected siblings. The test has a closed form and p values can be obtained analytically, which facilitates genome-wide analysis. In subsequent sections, we derive our rare-variant association test and illustrate the approach by using both simulated sequence data as well as exome-chip data from affected sibships collected by the GENOA study.
Materials and Methods
Assumptions and Notation
We assume we possess sequence or exome-chip data from a collection of N affected sibships of arbitrary size. We assume sibship j (j = 1, …, N) is comprised of Mj affected siblings that can be partitioned into Sj = (Mj)(Mj − 1) / 2 possible pairs. We consider the analysis of a gene or region and let R denote the number of polymorphic rare-variant sites observed in the gene or region (with a rare variant defined as a variant whose frequency is less than some threshold value, such as 0.01 or 0.05). We define Tij as the total number of copies of rare variants at the R sites possessed by the ith sib pair in the jth sibship. If desired, we can up- or down-weigh the contributions of specific rare variants over others in the Tij count by applying site-specific weights using information such as minor-allele frequency19,22 or functional information;21 in this case, Tij denotes the weighted sum. We further define Zij as the estimated number of copies of the gene/region shared identical by descent by the ith sib pair in the jth sibship, which we can infer via the Lander-Green25 algorithm (or an extension that allows for linkage disequilibrium among markers26), as implemented in software packages like MERLIN.27
Proposed Model
Our model assumes the mean and variance in the number of copies of rare causal variants on haplotypes inherited by an affected sibling pair differ depending on whether the haplotype is inherited identical by descent or not. We define the mean and variance of the number (or weighted sum) of rare variants on a parental haplotype inherited identical by descent as μ1 and , respectively. Similarly, we define μ0 and as the mean and variance of the number (or weighted sum) of rare variants on a parental haplotype that is not inherited identical by descent by the affected pair. If a sib pair shares zero haplotypes identical by descent, then the pair possess two independent maternal haplotypes that are not shared identical by descent and two independent paternal haplotypes that are not shared identical by descent. If a sib pair shares one haplotype identical by descent, then the pair possesses two identical haplotypes (shared identical by descent) inherited from one parent and two distinct independent haplotypes (not shared identical by descent) inherited from the other parent. If the pair shares two haplotypes identical by descent, then the pair possesses two identical maternal haplotypes (shared identical by descent) and two identical paternal haplotypes (shared identical by descent). Based on this information, we can derive the mean and variance of Tij conditional on the IBD sharing Zij as
| (Equation 1) |
and
| (Equation 2) |
Our primary interest is to test the null hypothesis that H0: μ0 = μ1. To simplify presentation, we reparameterize our model by defining δ = μ1 − μ0 so that we can rewrite Equation 1 as
| (Equation 3) |
and reconfigure our primary null hypothesis to be H0: δ = 0. Based on Equations 2 and 3, we can perform inference on the parameter δ by solving the following estimating equations for (μ0, δ):
| (Equation 4) |
where Wij = (Var(Tij|Zij))−1. We are primarily interested in a 1-sided test of H0: δ = 0 versus HA: δ > 0 because, given the non-random ascertainment of affected sibships, we anticipate rare risk variants to be observed on segments shared identical by descent. However, we can also perform the standard 2-sided test of H0: δ = 0 versus HA: δ ≠ 0, if desired, to allow for the possibility of rare protective variants observed in regions not shared identical by descent by an affected sib pair. We note that analysis via Equation 4 is robust to confounding due to population stratification because, although ancestry might correlate with the number of copies of rare variants in a region, ancestry will not correlate with IBD sharing in a region under the null hypothesis that the genetic variation we are testing is neither causal nor in linkage disequilibrium with other causal regions.
Inference on δ within Equation 4 requires estimates of the variance parameters and shown in Equation 2. To estimate these parameters, we first calculate the sample variance for the number (or weighted sum) of rare variants possessed by affected sib pairs sharing 0, 1, or 2 alleles identical by descent and denote these quantities by , and , respectively. Based on Equation 2, we can then estimate the variance parameters by solving the system of equations
Defining and , we then estimate the variance parameters as . We then use these estimates to define Wij in Equation 4. If IBD state is known only probabilistically, we assign each sib pair to its most probable IBD state when calculating .
In the formulation of Equation 4, we assumed that we inferred the IBD sharing variable Zij with certainty. Although this assumption probably holds when inferring IBD information from sequence data, the use of sparser SNP sets from the exome chip for estimation might lead to IBD uncertainty. In this case, we specify Zij as the expected IBD dosage by using , where the estimated IBD probabilities are calculated by MERLIN.27 We can insert such IBD dosage variables directly into the mean model in Equation 3. To model Wij = (Var(Tij|Zij))−1 for a pair with uncertain IBD sharing, we assign the IBD state to be the most-likely IBD sharing category. Although this leads to misspecification of Var(Tij|Zij), we note that such misspecification does not affect the validity of our estimation-equation testing framework and only potentially affects the power.
Efficient Score Function and Test Statistics
Rather than solve a system of two equations (Equation 4), we can instead simplify the problem by finding the efficient score for δ from the weighted regression of Tij on Zij. After first normalizing the weights Wij, we define the centered count and IBD variables as and , respectively. As we show in Appendix A, the efficient score to test H0: δ = 0 based on Equation 4 is proportional to
| (Equation 5) |
To construct the estimated variance accounting for within-sibship correlation of sib pairs, we use a robust variance estimator that accounts for cluster membership.28 This variance estimator has the form
| (Equation 6) |
With Equations 5 and 6, we can then construct a closed-form burden test to assess H0: δ = 0 by writing
Under H0: δ = 0, YBurden follows a standard normal distribution.
In addition to a burden test, we can also consider a variance-component test of rare-variant association analogous to SKAT.22 The approach assumes that δ follows a random effect with mean 0 and variance τ and then considers a score test of H0: τ = 0. Such a variance-component test might be preferable to the burden test YBurden if we expect, in addition to rare susceptibility variants in regions shared identical by descent, the possibility that a region might harbor rare protective variants on regions not shared identical by descent by an affected sib pair. We can use the efficient score framework to construct such a test by summing the squared contribution of the efficient score function at each variant site. By definition, , where Tijr denotes the total number of rare variants possessed at variant site r (r = 1, …, R) by sib pair i in sibship j. Because R is fixed and rare variants typically exhibit low linkage disequilibrium, we expect , suggesting that we choose Wijr = Wij as calculated previously, because the weights we use are normalized. Similar to Equation 6, we can define and then define our variance-component test statistic as
Under the null hypothesis, YVC follows a mixture of chi-square distributions29 where the λ parameters denote the eigenvalues of the R by R matrix Σ, where row r and column r’ element of the matrix has the form
As before, this variance estimator accounts for within-sibship correlation.28 We can analytically calculate the p value of YVC via Davies method.30
Application to Simulated Datasets
We evaluated the size and power of our test for rare-variant association testing in sibships by using simulated sequence data. With COSI,31 we generated 10,000 haplotypes of length 10 kb whose variation patterns emulated those observed in HapMap CEU (Utah residents with ancestry from northern and western Europe from the CEPH collection) samples. To generate data with confounding by population stratification, we similarly simulated 10,000 haplotypes whose variation patterns mimicked those observed in HapMap YRI (Yoruba in Ibadan, Nigeria) samples. For each population sample, we generated sequence data for a sibship by first randomly sampling two haplotypes for each parent: parents were either both European for simulations without confounding, or both European or both African for simulations with confounding. We then randomly transmitted one maternal and one paternal haplotype to each offspring in a sibship, keeping track of the inheritance flow in the family to derive pair-wise IBD sharing among all pairs of siblings.
We then modeled the probability of disease for an index proband within a sibship by using a logistic function that has an intercept, a term for African origin (for simulations with confounding), and an additive model for each risk variant (for models evaluating power). For each simulation scenario, we chose the intercept to yield an overall disease prevalence of 0.03. African origin increased the odds of disease by a factor of 4 for simulations with confounding. For power simulations, we assumed 15% of rare (minor allele frequency [MAF] < 0.05) variants were causal with the magnitude of the log odds ratio given by c|log10(MAF)|, where we chose c to be log(4)/4, log(6)/4, or log(8)/4, corresponding to a causal risk variant with a MAF of 0.0001 having a disease odds ratio of 4, 6, or 8, respectively. For some power simulations, we assumed that all causal variants increased risk for disease. For other power simulations, we assumed that half of causal variants increased risk and the other half were protective and decreased risk. We then randomly sampled the disease outcome for the index proband and discarded the sibship if the index proband was unaffected.
Given that the index proband is affected, we then generated disease outcomes for each of the proband’s siblings assuming a total sibship size of 2, 3, or 4 with the following model. Let y1 and y2 denote the disease status (y = 1 denotes affected) for the index proband and an additional sibling, respectively. Further, define g1 and g2 as the genotype vectors for rare susceptibility variants at the test gene possessed by the index proband and additional sibling, respectively. Also, let a be an indicator of African origin for the two siblings. We must specify P(y2 = 1|y1 = 1,g1,g2,a); the probability the additional sibling is affected conditional on the index proband being affected and conditional on the rare-susceptibility genotypes and ancestry of both siblings. To do this, we define a conditional version of Risch’s sibling recurrence risk ratio32 as λC = P(y2 = 1|y1 = 1,g1,g2,a)/P(y2 = 1|g1,g2,a), which models the overall risk of disease due to shared sibling effects conditional on the sibling’s ancestry and genotypes at the rare risk variants in the gene of interest. We rewrite λC as a function of our probability of interest as P(y2 = 1|y1 = 1,g1,g2,a) = λCP(y2 = 1|g1,g2,a). By making the reasonable assumption that P(y2 = 1|g1,g2,a) = P(y2 = 1|g2,a) (risk of disease of the additional sibling is independent of the genotype information of the index proband conditional on the additional sibling’s own genotype and the ancestry of the sibship), our probability of interest simplifies to P(y2 = 1|y1 = 1,g1,g2,a) = λCP(y2 = 1|g2,a). We then model this probability by varying the value of λC among values of 2, 4, and 8 (with larger value indicating increased global risk of disease due to shared sibling effects) and specifying P(y2 = 1|g2,a) via the same logistic function used to generate the disease phenotype for the index proband. Data for each successive sib are sampled conditional on the index proband but independently of the disease status of subsequent sibs.
With this model, we generated disease outcomes for 1, 2, or 3 successive sibs independently to obtain data for sibships of size 2, 3, or 4, respectively. We retained the sibship for analysis if the resulting disease data satisfied the ascertainment criterion and discarded the sibship otherwise. Our primary ascertainment criterion was that the sibship possess at least two affected siblings but, for sibships of size 3 and 4, we also considered a criterion requiring three or more affected siblings for analysis. For a given simulation model, we prospectively generated sequence and phenotype data on sibships until we achieved a targeted number of sibships that fulfilled the ascertainment criterion.
Application to GENOA Dataset
The GENOA study,8,33 which forms a component of the NHLBI Family Blood Pressure Program,34 seeks to identify genetic variants that influence risk for hypertension and arteriosclerotic/atherosclerotic complications involving the heart, brain, kidneys, and peripheral arteries. As part of the study, GENOA ascertained a cohort of African American sibs from Jackson, Mississippi, in which ≥2 siblings had essential hypertension diagnosed prior to the age of 60. 1,854 subjects were enrolled in the initial study and approximately 80% were re-recruited for a second exam many years later. Clinical data collected on such subjects include essential hypertension status as well as quantitative and qualitative outcomes related to lipid metabolism and organ function. This study was approved by the institutional review boards at the parent institutions of all participating laboratories involved in GENOA.
The GENOA investigators genotyped 1,429 samples for 233,507 SNPs on the Illumina HumanExome Beadchip. After standard data cleaning to remove problematic individuals and SNPs, the final sample for analysis consisted of 1,392 participants in 623 sibships. We summarize the distribution of sibships in Table 1. GENOA investigators used PLINK35 to estimate genome-wide IBD sharing among relative pairs to confirm putative pedigree structure. To infer site-specific IBD sharing in the GENOA sibships for use in our proposed tests, we used 4,448 common autosomal SNPs specifically included on the Illumina HumanExome Beadchip to infer inheritance flow. We identified the sex-averaged linkage map position for each of these SNPs from the Rutgers Map v.336 (see Web Resources). With this information, we first used MERLIN27 to identify likely genotyping errors for the 4,448 SNPs in the GENOA families and subsequently set such problematic genotypes to be missing. We then applied MERLIN on the cleaned genotype data to infer IBD sharing among GENOA family members at 1 centiMorgan (cM) intervals across the autosomes.
Table 1.
Distribution of Sibship Size in GENOA Dataset
| Sibship Size | Count |
|---|---|
| 1 (singleton) | 204 |
| 2 | 226 |
| 3 | 101 |
| 4 | 53 |
| 5 | 23 |
| 6 | 8 |
| 7 | 6 |
| 8 | 2 |
With our rare-variant association test, we performed two sets of analyses with affected siblings in GENOA. We first studied GENOA affected siblings with essential hypertension (MIM 145500); published sibling recurrence risk ratios for hypertension range between 1.5 and 3.5.37 We analyzed rare and less-common variants (MAF ≤ 0.05) found in a set of candidate genes containing common variation previously associated with blood pressure in independent African American GWAS samples.38 We next focused on GENOA affected siblings with obesity (MIM 601665); published sibling recurrence risk ratios for obesity range between 2.6 and 4.2.39 We analyzed rare and less-common variants found in genes harboring common variation previously associated with body-mass index (BMI) in independent African American GWASs.40 For each set of analyses, we removed unaffected siblings prior to association testing. We show the distribution of GENOA affected sibships with the hypertension and obesity phenotypes in Table 2. As shown in the table, there are a total of 847 affected sibling pairs that are hypertensive and 697 affected sibling pairs that are obese. Of these sib pairs, 484 overlap between the two datasets, so that the proportion of hypertensive sib pairs that were also obese was 0.57 while the proportion of obese sib pairs that were also hypertensive was 0.69.
Table 2.
Distribution of Affected Sibships in GENOA
| Sibship Size | Count with Hypertension | Count with Obesity |
|---|---|---|
| 2 | 204 | 183 |
| 3 | 75 | 68 |
| 4 | 35 | 26 |
| 5 | 12 | 9 |
| 6 | 4 | 1 |
| 7 | 0 | 1 |
| 8 | 1 | 1 |
| Total Number of Pairs | 847 | 697 |
| Number of Pairs with Both Hypertension and Obesity | 484 | |
We identified the physical location of each tested gene from the UCSC Genome Browser41 and included all variants on the Illumina HumanExome Beadchip with MAF ≤ 0.05 from 20 kb upstream of the start of the gene position to 20 kb downstream beyond the end of the gene position. We found the corresponding linkage map position (sex averaged) for each gene by using Rutgers Map v.3 and extracted the IBD sharing of the GENOA affected sibships at that position from our MERLIN output. We considered both YBurden and YVC and performed both unweighted analyses as well as more standard analyses that weighted rare variants inversely proportional to their MAF (using a weight corresponding to as suggested by others19).
Simulations with Uncertainty in IBD Sharing
In the power simulations described previously, we assumed that IBD sharing among affected sib pairs was known exactly when constructing YBurden and YVC. By using next-generation sequencing data, we would expect to infer IBD with near certainty. However, for sparser data like the common SNPs found on the Illumina HumanExome Beadchip, ambiguity in IBD sharing is a possibility. To investigate the impact of IBD uncertainty on our approaches, we looked at pairwise IBD estimates among affected siblings in GENOA across the candidate genes that we explored in this article. We provide a histogram of these estimates in Figure S1. We repeated the simulations described previously but, instead of using the true IBD sharing for each pair, we induced ambiguity in IBD sharing by sampling from the distribution of IBD estimates observed in the GENOA pairs. Specifically, if a pair’s true IBD sharing was 0, we sampled the observed IBD sharing from the distribution of GENOA IBD estimates between 0 and 0.5. If true IBD sharing was 1, we sampled an observed IBD from GENOA estimates between 0.5 and 1.5. Finally, if true IBD sharing was 2, we sampled an observed IBD estimate from the GENOA estimates between 1.5 and 2.
Results
Type I Error Results
We performed null simulations to ensure that YBurden and YVC had appropriate size under different conditions. Figure 1 shows quantile-quantile (QQ) plots for the two tests in a situation where the sample consisted entirely of subjects of European ancestry. The top half of Figure 1 shows the QQ plots assuming a sample size of 500 sibships of size 2 (top left) or of size 4 (top right), and the bottom half of Figure 1 shows QQ plots for sample sizes of 1,000 sibships of size 2 (bottom left) or of size 4 (bottom right). For each design, we analyzed 10,000 replicates of the data assuming λC = 4 (we show QQ plots under the same models when λC = 8 in Figure S2). The results show that both statistics have appropriate type I error under the null and, based on results that assumed sibships of size 4, appropriately account for the dependency among observations due to within-sibship correlation.
Figure 1.
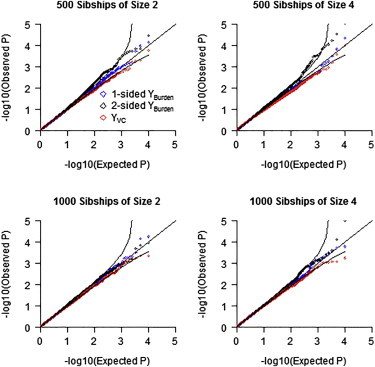
Quantile-Quantile Plots of Observed p Values versus Expected p Values on –log10 Scale for the YBurden and YVC Tests under the Null Hypothesis for Samples of European Ancestry
Top left shows QQ plot for 500 sibships of size 2, top right shows 500 sibships of size 4, bottom left shows 1,000 sibships of size 2, and bottom right shows 1,000 sibships of size 4. Each set of results based on 10,000 replications with λC = 4.
The type I error simulations shown in Figure 1 assumed samples entirely of European ancestry (no confounding). Figure 2 shows QQ plots for simulations with confounding, assuming a sample size of 500 sibships of size 2 (top left) or of size 4 (top right), or a sample size of 1,000 sibships of size 2 (bottom left) or of size 4 (bottom right). For each model, we analyzed 10,000 replicates of the data assuming λC = 4 (we provide QQ plots for λC = 8 in Figure S3). The results show that both tests are valid in the presence of confounding resulting from population stratification.
Figure 2.
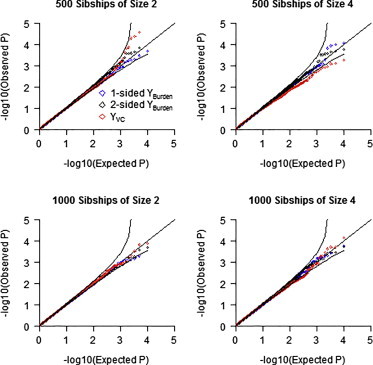
Quantile-Quantile Plots of Observed p Values versus Expected p Values on –log10 Scale for the YBurden and YVC Tests under the Null Hypothesis with Samples of Both African and European Ancestry
Odds ratio of disease for African versus European ancestry is 4. Top left shows QQ plot for 500 sibships of size 2, top right shows 500 sibships of size 4, bottom left shows 1,000 sibships of size 2, and bottom right shows 1,000 sibships of size 4. Each set of results based on 10,000 replications with λC = 4.
Power Results
In Figure 3 we compare the power of YBurden and YVC for simulated data on affected sib pairs of European ancestry. For all simulations we assumed λC = 4. Power was markedly higher for all tests when all causal alleles are risk alleles. However, even when half the causal alleles are protective, we observed that both the 1-sided and 2-sided YBurden test outperformed YVC. This result is in contradistinction to results showing that variance-component tests generally outperform burden tests in case-control and cross-sectional studies when the proportion of causal variation is small.22 We believe the reason we observe this phenomenon is that the sampling of affected sibs implies the presence of cosegregating risk alleles in the family, which in turn implies rare risk variants are shared identical by descent. Protective variants preferentially found on haplotypes not shared identical by descent would probably have a smaller effect than risk variants for two reasons. First, each sib already has enough risk alleles to cause disease. Second, recall that haplotypes in affected sibships not shared identical by descent are like untransmitted haplotypes in a transmission-disequilibrium test; the distortion of allele frequencies in untransmitted haplotypes is typically much smaller than that in transmitted haplotypes. In a related finding, Jiang et al.42 observed burden tests to be more powerful than variance-component tests in the study of case-parent trios, even when a gene harbored an equal mixture of rare and protective variants. Based on our findings, we recommend using the 1-sided YBurden test as the primary analytic tool for rare-variant testing in affected sibships.
Figure 3.
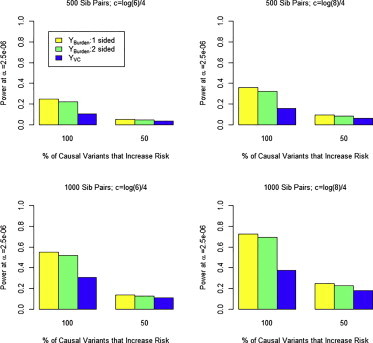
Power of YBurden and YVC Tests at α = 2.5 x 10⁻⁶
Data were generated under a model where 15% of variants with MAF ≤ 0.05 were causal with effect on log(OR) of c⋅|log10(MAF)| (for risk variants) and −c⋅|log10(MAF)| (for protective variants). Results are shown for c = log(6)/4 and 500 sib pairs (top left), c = log(6)/4 and 1,000 sib pairs (top right), c = log(8)/4 and 500 sib pairs (bottom left), and c = log(8)/4 and 1,000 sib pairs (bottom right). Each set of results based on 1,000 replications with λC = 4.
We also performed simulations to compare the power of our rare-variant association tests for affected sibships to the power of a case-control study having the same sample size. We assumed samples comprised of M individuals that were collected under one of three possible designs. First, we generated sequence data prospectively under a case-control design assuming M/2 case subjects and M/2 control subjects, and we analyzed the data via a logistic-regression burden test that regressed disease status on the total number of rare variants possessed by a subject. Second, we generated data on M/2 affected sib pairs and analyzed the data via our 1-sided YBurden test. Finally, we generated data on M/3 families, each having three affected sibs (sib trios) and analyzed the data again with our 1-sided YBurden test. Although ascertainment of siblings based on three or more affected individuals is rare, we were curious to see whether increasing the genetic load by requiring three affected sibs would increase the power even as the number of sibships decreased.
Figure 4 provides power comparisons at α =2.5 x 10⁻⁶ (corresponding to a Bonferroni correction for testing 20,000 independent genes) of case-control, affected sib pair, and affected sib trio designs assuming 1,000 or 2,000 total sampling units. For all simulations, we used only samples of European ancestry and assumed that all causal variants increased risk. We varied the value of λC among the values of 2, 4, and 8 with corresponding power results shown in the top, middle, and bottom panels of Figure 4. In all scenarios, the results show that sampling affected sibships is more powerful than the using a case-control sample assuming the same number of sampling units. Figure 4 also shows that the power of sib trios is considerably higher than sib pairs, suggesting that more stringent ascertainment criteria can improve the ability to detect rare susceptibility variation. We should note that the 1-sided YBurden test has appropriate size for affected sib trios (see Figure S4). Further, when we repeated the simulations summarized in Figure 4, using the “observed” IBD sharing estimated in the GENOA sibs in place of the true IBD sharing, we observed negligible power loss for our method, compared to using the true IBD for a pair (see Figure S5).
Figure 4.
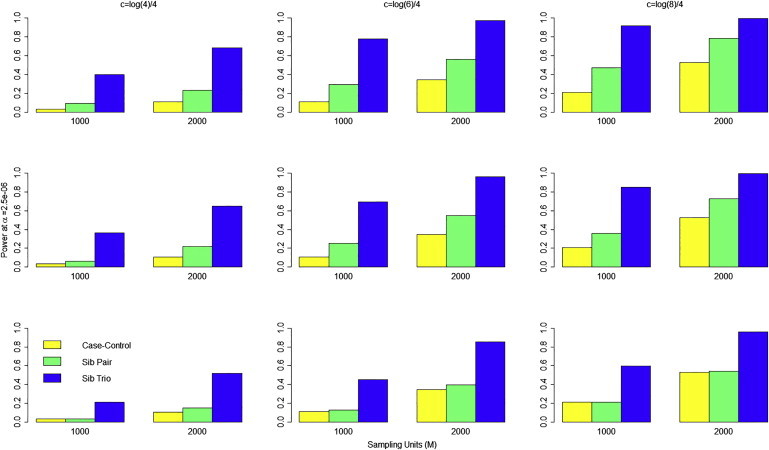
Power at α = 2.5 x 10⁻⁶ to Detect Rare Susceptibility Variants under Different Sampling Designs Assuming a Fixed Number of M Sampling Units
Yellow bar denotes power using M/2 cases and M/2 controls using logistic-regression burden test. Green bar denotes power for M/2 affected sib pairs using 1-sided YBurden test. Blue bar denotes power for M/3 affected sib trios using 1-sided YBurden test. Results are shown for c = log(4)/4 (left column), c = log(6)/4 (middle column), and c = log(8)/4 (right column). Top row, λC = 2; middle row, λC = 4; bottom row, λC = 8. Each set of results based on 1,000 replications assuming 15% of rare variants are causal with 100% of causal variants increasing risk.
Figure 4 also shows that the power of the 1-sided YBurden test generally decreases with increasing value of λC. This trend occurs because an increase in λC represents an increase in the overall (polygenic) risk due to shared sibling factors, not just the risk at the test locus. As λC increases, the risk of disease increases even for sibs with no rare risk variants in the gene of interest. Consequently, the proportion of risk load carried by rare variation in a gene of interest among affected sibships decreases as λC increases, which leads to reduced power with the 1-sided YBurden test. Nevertheless, even at sibling recurrence risk ratios of 8, the 1-sided YBurden test has equal or improved power compared to the case-control design for a fixed sample size.
We also compared the power of rare-variant association testing via the 1-sided YBurden test to the power of detecting linkage at the same gene using the affected sibling pairs generated to create Figure 4. We tested for linkage via a minimax test43 assuming the IBD sharing of each affected sib pair was known with certainty. We assumed the genome-wide significance threshold for declaring linkage suggested by Lander and Kruglyak.44 In Figure 5, we compare the power to detect linkage to the power to detect association assuming an appropriate genome-wide significance threshold for both approaches, using our simulated datasets that assumed λC = 4. The results clearly show that the power to detect a genome-wide significant association via the 1-sided YBurden test is greater than the corresponding power to detect a genome-wide significant linkage signal across simulation models. Further, although we observed correlation between the p values of the linkage and association tests, the correlation was imperfect and we identified many instances where we observed a significant association signal in the absence of a linkage signal. For example, among the simulated datasets assuming c = log(6)/4 (middle bar plot in Figure 5), we estimated that the Spearman rho coefficient between the linkage and association p values was 0.30 for 500 affected sib pairs, which indicates a significant (p < 0.0001) yet imperfect correlation. However, of the 294 replicates that yielded an (unadjusted) linkage p value > 0.05 (indicating little or no evidence of linkage), 40% yielded a genome-wide-significant association signal via the 1-sided YBurden test. These results demonstrate that our approach can detect association between rare variants and IBD sharing in the absence of a strong linkage signal.
Figure 5.
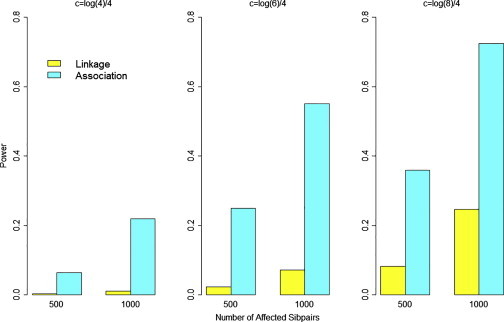
Power to Detect Linkage and Power to Detect Association in Affected Sib Pairs under Different Sampling Designs Assuming 500 or 1,000 Affected Sib Pairs
Yellow bar denotes power to detect linkage at genome-wide significance threshold of 10−5. Magenta bar denotes power to detect association using YBurden at genome-wide threshold of 2.5 × 10⁻⁶. Results shown for c = log(4)/4 (left), c = log(6)/4 (middle), and c = log(8)/4 (right). Each set of results based on 1,000 replications assuming λC = 4 and 15% of rare variants are causal with 100% of causal variants increasing risk.
Application to GENOA Study
We applied our approach to test whether rare variants in previously identified candidate genes affected essential hypertension or obesity in the GENOA affected sibs. Based on our simulation findings, we used the 1-sided YBurden test as our primary analysis tool. We list each gene analyzed in Table 3 along with its corresponding p values derived from a weighted (based on MAF) or unweighted 1-sided YBurden test. We performed association testing of 5 genes with hypertension and 12 genes with obesity (with no overlap in the genes tested for each phenotype). We then performed these 17 tests twice using both the weighted and unweighted forms. Although the weighted and unweighted tests are likely to be correlated, we elected to apply a Bonferroni adjustment for 34 tests that yielded a significance threshold of α = 0.05/34 = 0.0015. Although we observed no significant association between rare variants in blood-pressure genes with essential hypertension, we observed an interesting association between rare variants in NRXN3 (MIM 600567) and obesity (unadjusted p = 0.0024, adjusted p = 0.0816). The unweighted 1-sided YBurden test for this gene was less interesting, because it yielded an unadjusted p value of 0.043. Further, we did not observe a corresponding linkage signal at the locus (LOD score of 0 using the Kong and Cox45 exponential model implemented in MERLIN). Examination of IBD sharing among affected sib pairs at the NRXN3 confirmed no evidence of linkage as the proportion of affected sib pairs that shared 0, 1, and 2 alleles identical by descent (rounded to nearest integer) was 27%, 51%, and 22%, respectively (see Table 4). To determine why the weighted YBurden test yielded an interesting association in the absence of either a signal from the unweighted YBurden test or the linkage test, we examined the average rare-variant burden of affected sib pairs with IBD = 0, 1, and 2. As shown in Table 4, the average rare-variant burdens of the IBD = 0 and IBD = 2 affected sib pairs were similar for the unweighted analysis. However, the allele frequency of the rare variants decreased monotonically as the IBD state increases, so that for the weighted analysis, the average burden of the IBD = 2 affected sib pairs was greater than that in IBD = 1 pairs, which in turn was greater than that of the IBD = 0 affected sib pairs.
Table 3.
Rare-Variant Analysis in GENOA Affected Sibships
| Outcome | Gene | p Value (Weighted) | p Value (Unweighted) |
|---|---|---|---|
| Hypertension | GOSR2 | 0.865 | 0.674 |
| GUCY1A3 | 0.421 | 0.513 | |
| PLEKHG1 | 0.378 | 0.387 | |
| SH2B3 | 0.970 | 0.932 | |
| ULK4 | 0.834 | 0.578 | |
| Obesity | ADCY3 | 0.799 | 0.671 |
| BDNF | 0.520 | 0.585 | |
| FTO | 0.597 | 0.346 | |
| GNPDA2 | 0.636 | 0.451 | |
| KLHL32 | 0.442 | 0.254 | |
| MAP2K5 | 0.890 | 0.670 | |
| MC4R | 0.142 | 0.191 | |
| NFE2L3 | 0.919 | 0.872 | |
| NRXN3 | 0.0024 | 0.043 | |
| SEC16B | 0.739 | 0.632 | |
| SH2B1 | 0.393 | 0.305 | |
| QPCTL | 0.382 | 0.232 |
p value for YBurden based on 1-sided test. Weights based on .
Table 4.
Rare-Variant Association Analysis of NRXN3 in GENOA Study
| IBD State | Number (Proportion) of Affected Sib Pairs | Average Frequency of Rare Variants in NRXN3 |
Average Burden Per Sib Pair |
|
|---|---|---|---|---|
| Unweighted | Weighted | |||
| 0 | 187 (0.27) | .0070 | 0.043 | 0.820 |
| 1 | 354 (0.51) | .0052 | 0.080 | 1.568 |
| 2 | 156 (0.22) | .0024 | 0.067 | 2.310 |
IBD state of each affected sibling pair rounded to nearest integer value. Rare variants are those with sample MAF < 0.05. Weighted analysis applied weight based on .
The limited number of interesting rare-variant findings in the GENOA study might indicate inherent differences between our simulated and real data examples. We don’t believe these differences are due to the sibling recurrence risk ratios assumed in the simulations because they include published values reported for hypertension and obesity (1.5–3.5 and 2.6–4.2, respectively37,39). We do note there are two intrinsic differences between our simulation design and the GENOA analyses. First, the GENOA study provided Illumina HumanExome Beadchip data whereas our simulations assumed sequence data. Thus, it is possible that the issue might be that the true causal variation in the candidate genes investigated in the GENOA study are not well interrogated on the HumanExome Beadchip and must be assayed by a sequencing approach. Second, we note the sample size of the GENOA study (865 affected subjects in 331 sibships for studying hypertension; 740 affected subjects in 289 sibships for studying obesity) is smaller than the sample sizes considered in our simulations, which could explain some of the difference between the power we observed in our simulations and the results of our analyses of the GENOA data.
Discussion
As interest grows in sequencing or genotyping exome chips on familial samples (such as those collected previously for linkage analysis), novel statistical procedures that permit rare-variant association testing for these studies are necessary. In this work, we proposed a rare-variant association test for affected sibships of arbitrary size that examines the relationship between the distribution of rare variants in a gene and the number of genes shared identical by descent among affected sib pairs. With simulations, we showed that rare-variant testing in affected sibships is more powerful than a case-control study with the same sample size, thereby illustrating the strengths of family-based data for rare-variant association analysis. Our method also possesses additional practical features: it does not use any information from control samples; it is robust to confounding due to population stratification; and our test statistics have simple closed forms with analytic p values, making use of our approach straightforward via standard software packages (see Web Resources for R code implementing our approach). Further, we have shown that our methods perform well even when there is uncertainty in IBD estimates from sparse SNP sets. We illustrated the approach with an application to exome chip data from the GENOA study in efforts to identify genes harboring rare variation that increase risk for essential hypertension and obesity and identified a gene (NRXN3) that might warrant further study for association with obesity.
Although our rare-variant association test is based on IBD sharing in affected sibling pairs, it is not a test of linkage and does not require the presence of a linkage signal to detect association (as demonstrated in the Results section and in Figure 5). Linkage tests treat IBD sharing as the outcome variable and looks for regions where estimated IBD sharing across affected pairs deviate from their expected values based only on familial relationships. Our proposed association test compares patterns of rare variation in a gene conditional on the IBD sharing in a region. If linkage exists but there is no difference in rare-variation patterns between regions shared identical by descent and not shared identical by descent, then our proposed test will not find a significant result. Conversely, our approach can detect a significant association if the patterns of rare variation differ between haplotypes that are and are not shared identical by descent, even if there is no excess IBD sharing as would be expected under linkage.
Our approach is tailored for rare-variant analysis in affected sib pairs within sibships. In theory, we could expand our approach to incorporate discordant sib pairs in sibships where one sib is affected and the other sib is unaffected. For such discordant sib pairs, we would expect to find more rare susceptibility variants found on regions not shared identical by descent than on regions shared identical by descent. We can modify our framework in Equation 4 to detect such patterns by incorporating the expected sign of δ (positive for affected sib pairs, negative for discordant sib pairs) into the analysis. However, when we performed preliminary power simulations to investigate the potential utility of incorporating discordant pairs into analysis, we found that such discordant units provided meager power (slightly more than the empirical size) to identify regions harboring rare susceptibility variants unless the proportion of causal variants and their associated effect sizes were unreasonably large (results not shown). In fact, this is related to our finding that our variance components test was always less powerful than the two-sided burden test even when half of the causal alleles were protective. Consequently, although we can use genetic information on unaffected sibs to improve the accuracy of IBD estimation in affected sib pairs, we do not recommend incorporating their information directly into our rare-variant testing framework.
As we demonstrated in our simulations, our burden and variance-component tests follow known asymptotic distributions to facilitate genome-wide analysis. If desired, we can also use resampling procedures to derive p values for such tests; such procedures are probably valuable when analyzing small samples. Because we assume an underlying linear model in Equation 4, we can implement a resampling procedure via a nonparametric bootstrap approach46 that resamples residuals from the regression analysis in Equation 4. This can be easily accomplished, for example, in the R programming language. For multiplex sibships we should resample in a way that preserves the within-sibship correlation, i.e., by resampling residuals from a single sibship. With care, this can be done with residuals from sibships at least as large as the one we are sampling; for example, we can resample data for a sibship of size 3 by using residuals from a sibship of size 5, as long as we choose (any) three sibs from that sibship and then select the residuals that correspond to their (three) pairings.
Our regression framework in Equation 4 extends easily to allow for modeling covariates at the pair level. Although adjusting for potential covariates in non-randomly ascertained samples is controversial,47–49 there might be value in such adjustment, especially to untangle the effects of rare variants from known common variants in a gene.50 To perform this adjustment, we create a variable for each sib pair that counts the number of copies of the minor allele of the common variant possessed by the pair, and we include this count as a covariate in our model. We plan to explore the value of such adjustment more in future work.
Our simulations show that using affected sib trios is even more powerful than using affected sib pairs, even when the sample size is held fixed. Although ascertaining families based on three affected subjects is rare, some studies do employ this strategy when collecting extended pedigrees.6,51 This motivates an extension of our approach to handle data comprised of affected relative pairs of arbitrary relatedness (e.g., first cousins, avuncular). For each type of affected relative pair (e.g., affected first cousins), we can implement the same framework discussed earlier by constructing an efficient score function that compares rare variant count to IBD sharing across the pairs. To combine results across different types of affected relative pairs (e.g., a sample comprised of a mixture of affected sibling pairs and affected first-cousin pairs), we can still use our efficient score framework but require a separate intercept parameter for each type of affected relative pair (to control for differences in genotypic correlation between different types of relative pairs). We are unsure whether an analysis based on these distant affected pairs will be more powerful than using case-control data, because second-order (and higher-order) relatives can share at most only one haplotype identical by descent (with the majority possessing IBD = 0). We intend to explore this in more detail in an additional manuscript.
Acknowledgments
We thank Dr. Karen Conneely and two anonymous reviewers for their constructive comments related to this work. This work was supported by HG007508 from the National Human Genome Research Institute. GENOA is supported by HL086694 and HL119443 from the National Heart, Lung, and Blood Institute. This manuscript has been reviewed by GENOA investigators for scientific content and consistency of data interpretation with previous GENOA publications and significant comments have been incorporated prior to submission for publication. M.P.E. is a consultant for Amnion Laboratories. The findings and conclusions in this article are those of the authors and do not necessarily represent the official position of the Centers for Disease Control and Prevention.
Appendix A
Deriving the Efficient Score Function in Equation 5 from Estimating Equations in Equation 4
Given the estimating equations in Equation 4, define
Then the efficient score for δ is defined as
where is the value of μ0 that solves Uμ(μ0,δ) = 0 (as a function of δ). Assuming the weights Wij are normalized, it is straightforward to show that . Hence, we find
where and are as defined in Equation 5. Dropping the superfluous factor of 2, we thus conclude that given in Equation 5 is proportional to , the efficient score for δ at δ = 0. A simple interpretation of the efficient score when estimating functions derived from a likelihood is that the efficient score is the derivative of the profile likelihood.
Supplemental Data
Web Resources
The URLs for data presented herein are as follows:
Epstein software, http://genetics.emory.edu/labs/epstein/software
Exome Chip Design, http://genome.sph.umich.edu/wiki/Exome_Chip_Design
International HapMap Project, http://hapmap.ncbi.nlm.nih.gov/
OMIM, http://www.omim.org/
Rutgers Map v.3, http://compgen.rutgers.edu/download_maps.shtml
References
- 1.Teng J., Risch N. The relative power of family-based and case-control designs for linkage disequilibrium studies of complex human diseases. II. Individual genotyping. Genome Res. 1999;9:234–241. [PubMed] [Google Scholar]
- 2.Zöllner S. Sampling strategies for rare variant tests in case-control studies. Eur. J. Hum. Genet. 2012;20:1085–1091. doi: 10.1038/ejhg.2012.58. [DOI] [PMC free article] [PubMed] [Google Scholar]
- 3.Ionita-Laza I., Lee S., Makarov V., Buxbaum J.D., Lin X. Family-based association tests for sequence data, and comparisons with population-based association tests. Eur. J. Hum. Genet. 2013;21:1158–1162. doi: 10.1038/ejhg.2012.308. [DOI] [PMC free article] [PubMed] [Google Scholar]
- 4.Mathieson I., McVean G. Differential confounding of rare and common variants in spatially structured populations. Nat. Genet. 2012;44:243–246. doi: 10.1038/ng.1074. [DOI] [PMC free article] [PubMed] [Google Scholar]
- 5.Liu Q., Nicolae D.L., Chen L.S. Marbled inflation from population structure in gene-based association studies with rare variants. Genet. Epidemiol. 2013;37:286–292. doi: 10.1002/gepi.21714. [DOI] [PMC free article] [PubMed] [Google Scholar]
- 6.Consortium E.K., Epi4K Consortium Epi4K: gene discovery in 4,000 genomes. Epilepsia. 2012;53:1457–1467. doi: 10.1111/j.1528-1167.2012.03511.x. [DOI] [PMC free article] [PubMed] [Google Scholar]
- 7.Krumm N., O’Roak B.J., Karakoc E., Mohajeri K., Nelson B., Vives L., Jacquemont S., Munson J., Bernier R., Eichler E.E. Transmission disequilibrium of small CNVs in simplex autism. Am. J. Hum. Genet. 2013;93:595–606. doi: 10.1016/j.ajhg.2013.07.024. [DOI] [PMC free article] [PubMed] [Google Scholar]
- 8.Daniels P.R., Kardia S.L., Hanis C.L., Brown C.A., Hutchinson R., Boerwinkle E., Turner S.T., Genetic Epidemiology Network of Arteriopathy study Familial aggregation of hypertension treatment and control in the Genetic Epidemiology Network of Arteriopathy (GENOA) study. Am. J. Med. 2004;116:676–681. doi: 10.1016/j.amjmed.2003.12.032. [DOI] [PubMed] [Google Scholar]
- 9.Chen H., Meigs J.B., Dupuis J. Sequence kernel association test for quantitative traits in family samples. Genet. Epidemiol. 2013;37:196–204. doi: 10.1002/gepi.21703. [DOI] [PMC free article] [PubMed] [Google Scholar]
- 10.Jiang D., McPeek M.S. Robust rare variant association testing for quantitative traits in samples with related individuals. Genet. Epidemiol. 2014;38:10–20. doi: 10.1002/gepi.21775. [DOI] [PMC free article] [PubMed] [Google Scholar]
- 11.Fang S., Sha Q., Zhang S. Two adaptive weighting methods to test for rare variant associations in family-based designs. Genet. Epidemiol. 2012;36:499–507. doi: 10.1002/gepi.21646. [DOI] [PubMed] [Google Scholar]
- 12.Jiang Y., Conneely K.N., Epstein M.P. Flexible and robust methods for rare-variant testing of quantitative traits in trios and nuclear families. Genet. Epidemiol. 2014;38:542–551. doi: 10.1002/gepi.21839. [DOI] [PMC free article] [PubMed] [Google Scholar]
- 13.Schaid D.J., McDonnell S.K., Sinnwell J.P., Thibodeau S.N. Multiple genetic variant association testing by collapsing and kernel methods with pedigree or population structured data. Genet. Epidemiol. 2013;37:409–418. doi: 10.1002/gepi.21727. [DOI] [PMC free article] [PubMed] [Google Scholar]
- 14.Zhu Y., Xiong M. Family-based association studies for next-generation sequencing. Am. J. Hum. Genet. 2012;90:1028–1045. doi: 10.1016/j.ajhg.2012.04.022. [DOI] [PMC free article] [PubMed] [Google Scholar]
- 15.Perdry H., Müller-Myhsok B., Clerget-Darpoux F. Using affected sib-pairs to uncover rare disease variants. Hum. Hered. 2012;74:129–141. doi: 10.1159/000346788. [DOI] [PubMed] [Google Scholar]
- 16.Garner C. Confounded by sequencing depth in association studies of rare alleles. Genet. Epidemiol. 2011;35:261–268. doi: 10.1002/gepi.20574. [DOI] [PMC free article] [PubMed] [Google Scholar]
- 17.Li B., Leal S.M. Methods for detecting associations with rare variants for common diseases: application to analysis of sequence data. Am. J. Hum. Genet. 2008;83:311–321. doi: 10.1016/j.ajhg.2008.06.024. [DOI] [PMC free article] [PubMed] [Google Scholar]
- 18.Morris A.P., Zeggini E. An evaluation of statistical approaches to rare variant analysis in genetic association studies. Genet. Epidemiol. 2010;34:188–193. doi: 10.1002/gepi.20450. [DOI] [PMC free article] [PubMed] [Google Scholar]
- 19.Madsen B.E., Browning S.R. A groupwise association test for rare mutations using a weighted sum statistic. PLoS Genet. 2009;5:e1000384. doi: 10.1371/journal.pgen.1000384. [DOI] [PMC free article] [PubMed] [Google Scholar]
- 20.Zawistowski M., Gopalakrishnan S., Ding J., Li Y., Grimm S., Zöllner S. Extending rare-variant testing strategies: analysis of noncoding sequence and imputed genotypes. Am. J. Hum. Genet. 2010;87:604–617. doi: 10.1016/j.ajhg.2010.10.012. [DOI] [PMC free article] [PubMed] [Google Scholar]
- 21.Price A.L., Kryukov G.V., de Bakker P.I., Purcell S.M., Staples J., Wei L.-J., Sunyaev S.R. Pooled association tests for rare variants in exon-resequencing studies. Am. J. Hum. Genet. 2010;86:832–838. doi: 10.1016/j.ajhg.2010.04.005. [DOI] [PMC free article] [PubMed] [Google Scholar]
- 22.Wu M.C., Lee S., Cai T., Li Y., Boehnke M., Lin X. Rare-variant association testing for sequencing data with the sequence kernel association test. Am. J. Hum. Genet. 2011;89:82–93. doi: 10.1016/j.ajhg.2011.05.029. [DOI] [PMC free article] [PubMed] [Google Scholar]
- 23.Neale B.M., Rivas M.A., Voight B.F., Altshuler D., Devlin B., Orho-Melander M., Kathiresan S., Purcell S.M., Roeder K., Daly M.J. Testing for an unusual distribution of rare variants. PLoS Genet. 2011;7:e1001322. doi: 10.1371/journal.pgen.1001322. [DOI] [PMC free article] [PubMed] [Google Scholar]
- 24.Lee S., Emond M.J., Bamshad M.J., Barnes K.C., Rieder M.J., Nickerson D.A., Christiani D.C., Wurfel M.M., Lin X., NHLBI GO Exome Sequencing Project—ESP Lung Project Team Optimal unified approach for rare-variant association testing with application to small-sample case-control whole-exome sequencing studies. Am. J. Hum. Genet. 2012;91:224–237. doi: 10.1016/j.ajhg.2012.06.007. [DOI] [PMC free article] [PubMed] [Google Scholar]
- 25.Lander E.S., Green P. Construction of multilocus genetic linkage maps in humans. Proc. Natl. Acad. Sci. USA. 1987;84:2363–2367. doi: 10.1073/pnas.84.8.2363. [DOI] [PMC free article] [PubMed] [Google Scholar]
- 26.Abecasis G.R., Wigginton J.E. Handling marker-marker linkage disequilibrium: pedigree analysis with clustered markers. Am. J. Hum. Genet. 2005;77:754–767. doi: 10.1086/497345. [DOI] [PMC free article] [PubMed] [Google Scholar]
- 27.Abecasis G.R., Cherny S.S., Cookson W.O., Cardon L.R. Merlin—rapid analysis of dense genetic maps using sparse gene flow trees. Nat. Genet. 2002;30:97–101. doi: 10.1038/ng786. [DOI] [PubMed] [Google Scholar]
- 28.Williams R.L. A note on robust variance estimation for cluster-correlated data. Biometrics. 2000;56:645–646. doi: 10.1111/j.0006-341x.2000.00645.x. [DOI] [PubMed] [Google Scholar]
- 29.Zhang D., Lin X. Hypothesis testing in semiparametric additive mixed models. Biostatistics. 2003;4:57–74. doi: 10.1093/biostatistics/4.1.57. [DOI] [PubMed] [Google Scholar]
- 30.Davies R. Algorithm as 155: The distribution of a linear combination of chi-2 random variables. J. R. Stat. Soc. [Ser A] 1980;29:323–333. [Google Scholar]
- 31.Schaffner S.F., Foo C., Gabriel S., Reich D., Daly M.J., Altshuler D. Calibrating a coalescent simulation of human genome sequence variation. Genome Res. 2005;15:1576–1583. doi: 10.1101/gr.3709305. [DOI] [PMC free article] [PubMed] [Google Scholar]
- 32.Risch N. Linkage strategies for genetically complex traits. I. Multilocus models. Am. J. Hum. Genet. 1990;46:222–228. [PMC free article] [PubMed] [Google Scholar]
- 33.Lange L.A., Lange E.M., Bielak L.F., Langefeld C.D., Kardia S.L., Royston P., Turner S.T., Sheedy P.F., 2nd, Boerwinkle E., Peyser P.A. Autosomal genome-wide scan for coronary artery calcification loci in sibships at high risk for hypertension. Arterioscler. Thromb. Vasc. Biol. 2002;22:418–423. doi: 10.1161/hq0302.105721. [DOI] [PubMed] [Google Scholar]
- 34.Investigators F., FBPP Investigators Multi-center genetic study of hypertension: The Family Blood Pressure Program (FBPP) Hypertension. 2002;39:3–9. doi: 10.1161/hy1201.100415. [DOI] [PubMed] [Google Scholar]
- 35.Purcell S., Neale B., Todd-Brown K., Thomas L., Ferreira M.A., Bender D., Maller J., Sklar P., de Bakker P.I., Daly M.J., Sham P.C. PLINK: a tool set for whole-genome association and population-based linkage analyses. Am. J. Hum. Genet. 2007;81:559–575. doi: 10.1086/519795. [DOI] [PMC free article] [PubMed] [Google Scholar]
- 36.Matise T.C., Chen F., Chen W., De La Vega F.M., Hansen M., He C., Hyland F.C., Kennedy G.C., Kong X., Murray S.S. A second-generation combined linkage physical map of the human genome. Genome Res. 2007;17:1783–1786. doi: 10.1101/gr.7156307. [DOI] [PMC free article] [PubMed] [Google Scholar]
- 37.Ward R. Hypertension: Pathophysiology, Diagnosis, and Management. Raven Press; New York: 1990. Familial aggregation and genetic epidemiology of blood pressure; pp. 81–100. [Google Scholar]
- 38.Franceschini N., Fox E., Zhang Z., Edwards T.L., Nalls M.A., Sung Y.J., Tayo B.O., Sun Y.V., Gottesman O., Adeyemo A., Asian Genetic Epidemiology Network Consortium Genome-wide association analysis of blood-pressure traits in African-ancestry individuals reveals common associated genes in African and non-African populations. Am. J. Hum. Genet. 2013;93:545–554. doi: 10.1016/j.ajhg.2013.07.010. [DOI] [PMC free article] [PubMed] [Google Scholar]
- 39.Allison D.B., Faith M.S., Nathan J.S. Risch’s lambda values for human obesity. Int. J. Obes. Relat. Metab. Disord. 1996;20:990–999. [PubMed] [Google Scholar]
- 40.Monda K.L., Chen G.K., Taylor K.C., Palmer C., Edwards T.L., Lange L.A., Ng M.C., Adeyemo A.A., Allison M.A., Bielak L.F., NABEC Consortium. UKBEC Consortium. BioBank Japan Project. AGEN Consortium A meta-analysis identifies new loci associated with body mass index in individuals of African ancestry. Nat. Genet. 2013;45:690–696. doi: 10.1038/ng.2608. [DOI] [PMC free article] [PubMed] [Google Scholar]
- 41.Kent W.J., Sugnet C.W., Furey T.S., Roskin K.M., Pringle T.H., Zahler A.M., Haussler D. The human genome browser at UCSC. Genome Res. 2002;12:996–1006. doi: 10.1101/gr.229102. [DOI] [PMC free article] [PubMed] [Google Scholar]
- 42.Jiang Y., Satten G.A., Han Y., Epstein M.P., Heinzen E.L., Goldstein D.B., Allen A.S. Utilizing population controls in rare-variant case-parent association tests. Am. J. Hum. Genet. 2014;94:845–853. doi: 10.1016/j.ajhg.2014.04.014. [DOI] [PMC free article] [PubMed] [Google Scholar]
- 43.Whittemore A.S., Tu I.P. Simple, robust linkage tests for affected sibs. Am. J. Hum. Genet. 1998;62:1228–1242. doi: 10.1086/301820. [DOI] [PMC free article] [PubMed] [Google Scholar]
- 44.Lander E., Kruglyak L. Genetic dissection of complex traits: guidelines for interpreting and reporting linkage results. Nat. Genet. 1995;11:241–247. doi: 10.1038/ng1195-241. [DOI] [PubMed] [Google Scholar]
- 45.Kong A., Cox N.J. Allele-sharing models: LOD scores and accurate linkage tests. Am. J. Hum. Genet. 1997;61:1179–1188. doi: 10.1086/301592. [DOI] [PMC free article] [PubMed] [Google Scholar]
- 46.Fox, J. (2002). Bootstrapping regression models. An R and S-PLUS Companion to Applied Regression: A Web Appendix to the Book (Sage).
- 47.Kuo C.L., Feingold E. What’s the best statistic for a simple test of genetic association in a case-control study? Genet. Epidemiol. 2010;34:246–253. doi: 10.1002/gepi.20455. [DOI] [PubMed] [Google Scholar]
- 48.Mefford J., Witte J.S. The covariate’s dilemma. PLoS Genet. 2012;8:e1003096. doi: 10.1371/journal.pgen.1003096. [DOI] [PMC free article] [PubMed] [Google Scholar]
- 49.Pirinen M., Donnelly P., Spencer C.C. Including known covariates can reduce power to detect genetic effects in case-control studies. Nat. Genet. 2012;44:848–851. doi: 10.1038/ng.2346. [DOI] [PubMed] [Google Scholar]
- 50.Huyghe J.R., Jackson A.U., Fogarty M.P., Buchkovich M.L., Stančáková A., Stringham H.M., Sim X., Yang L., Fuchsberger C., Cederberg H. Exome array analysis identifies new loci and low-frequency variants influencing insulin processing and secretion. Nat. Genet. 2013;45:197–201. doi: 10.1038/ng.2507. [DOI] [PMC free article] [PubMed] [Google Scholar]
- 51.Ottman R., Berenson K., Barker-Cummings C. Recruitment of families for genetic studies of epilepsy. Epilepsia. 2005;46:290–297. doi: 10.1111/j.0013-9580.2005.41904.x. [DOI] [PMC free article] [PubMed] [Google Scholar]
Associated Data
This section collects any data citations, data availability statements, or supplementary materials included in this article.