

Abstract
We conducted a large-scale genetic analysis on giant cell arteritis (GCA), a polygenic immune-mediated vasculitis. A case-control cohort, comprising 1,651 case subjects with GCA and 15,306 unrelated control subjects from six different countries of European ancestry, was genotyped by the Immunochip array. We also imputed HLA data with a previously validated imputation method to perform a more comprehensive analysis of this genomic region. The strongest association signals were observed in the HLA region, with rs477515 representing the highest peak (p = 4.05 × 10−40, OR = 1.73). A multivariate model including class II amino acids of HLA-DRβ1 and HLA-DQα1 and one class I amino acid of HLA-B explained most of the HLA association with GCA, consistent with previously reported associations of classical HLA alleles like HLA-DRB1∗04. An omnibus test on polymorphic amino acid positions highlighted DRβ1 13 (p = 4.08 × 10−43) and HLA-DQα1 47 (p = 4.02 × 10−46), 56, and 76 (both p = 1.84 × 10−45) as relevant positions for disease susceptibility. Outside the HLA region, the most significant loci included PTPN22 (rs2476601, p = 1.73 × 10⁻⁶, OR = 1.38), LRRC32 (rs10160518, p = 4.39 × 10⁻⁶, OR = 1.20), and REL (rs115674477, p = 1.10 × 10⁻⁵, OR = 1.63). Our study provides evidence of a strong contribution of HLA class I and II molecules to susceptibility to GCA. In the non-HLA region, we confirmed a key role for the functional PTPN22 rs2476601 variant and proposed other putative risk loci for GCA involved in Th1, Th17, and Treg cell function.
Introduction
Giant cell arteritis (GCA [MIM 187360]) is a chronic and polygenic immune-mediated disease of unknown etiology that is the most common form of vasculitis in individuals over the age of 50 in Western countries.1,2 It is characterized by inflammatory damage of large- and medium-sized arteries, particularly the extracranial branches of the carotid artery, which can lead to severe complications such as blindness or cerebrovascular events.3,4
During the last decade, genetic association studies have described several genes that are associated with predisposition to GCA, including genes of immune/inflammatory pathways and genes of the human leukocyte antigen (HLA) class I and II regions. The HLA-DRB1∗04 alleles seem to be the most consistently associated genetic risk factors for this form of vasculitis.5
One of the most successful platforms to identify immune-related risk variants is the Human Immuno DNA Analysis BeadChip Kit (known as the Immunochip), a custom Illumina Infinium High-Density array developed by the Immunochip Consortium for immunogenetics gene mapping. The Immunochip allows a dense analysis of 196,524 SNPs, rare variants, and insertion/deletion (indel) polymorphisms, located within 186 known susceptibility loci for autoimmune and inflammatory disorders.6 The use of the Immunochip has substantially increased the number of established genetic risk factors for multiple immune-mediated diseases, including Takayasu arteritis (another large-vessel vasculitis [MIM 207600]),7 celiac disease (MIM 212750),8 rheumatoid arthritis (RA [MIM 180300]),9 autoimmune thyroid disease (MIM 275000 and 140300),10 psoriasis (MIM 177900),11 primary biliary cirrhosis (MIM 109720),12,13 juvenile idiopathic arthritis (MIM 604302),14 primary sclerosing cholangitis (MIM 613806),15 narcolepsy (MIM 161400),16 ankylosing spondylitis (MIM 106300),17 atopic dermatitis (MIM 603165),18 and systemic sclerosis (SSc [MIM 181750]).19 The use of the same platform in all the above studies has facilitated the identification of common aetiopathogenic pathways among those disorders.20
Considering the above, we decided to carry out a large-scale genetic analysis of GCA in a well-sized case-control cohort with the Immunochip genotyping platform. Additionally, taking advantage of the high coverage that this array has in the HLA region, we performed a comprehensive analysis of the HLA region by using a novel imputation method to obtain imputed types of SNPs, classical HLA alleles, and polymorphic amino acid positions.21,22
Subjects and Methods
Study Population
Six independent case-control sample collections of European ancestry, from Spain (763 GCA-affected individuals and 1,517 unaffected controls), UK (251 GCA-affected individuals and 8,612 unaffected controls), North America (USA and Canada; 205 GCA-affected individuals and 1,641 unaffected controls), Italy (238 GCA-affected individuals and 1,270 unaffected controls), Norway (99 GCA-affected individuals and 374 unaffected controls), and Germany (95 GCA-affected individuals and 1,892 unaffected controls), were included in this study. The procedures followed were in accordance with the ethical standards of the responsible committee on human experimentation (institutional and national) of all participant centers, and written informed consent was obtained from all individuals. All cases fulfilled the 1990 American College of Rheumatology classification criteria for GCA,23 and the diagnosis was additionally confirmed by either a biopsy of the temporal artery (95.35%) or arterial imaging (4.65%). The most relevant clinical phenotypes of the case cohort are shown in Table S1.
Genotyping
Genomic DNA was extracted from blood samples by standard methods. The genotyping was performed on the Illumina iScan system with the Immunochip platform, as per Illumina protocols. Two different centers were involved in the genotyping. The sample sets from Spain, Italy, Norway, and Germany were genotyped by the Genomics and Genotyping Unit of the Pfizer-University of Granada-Junta de Andalucía Centre for Genomics and Oncological Research (GENYO, Granada, Spain) and those from UK and North America were genotyped by the Centre for Musculoskeletal Research (University of Manchester, Manchester, UK). Because of that, we used the same genotyping and calling procedures to control for possible batch effects as follows: (1) genotype calling was performed with the Genotyping Module (v.1.8.4) of the GenomeStudio Data Analysis software using the NCBI build 36 (hg18) mapping (Illumina manifest file Immuno_BeadChip_11419691_B.bpm); (2) low-quality SNPs of every batch were removed if they had call rates < 0.98 or cluster separation < 0.4; and (3) the strand orientation of every batch was set accordingly with the TOP orientation of Illumina to avoid A/T and G/C mismatches during the merging of the sets.
Quality Control
Different quality filters were applied to the Immunochip raw data from each cohort independently prior to the statistical analyses by PLINK v.1.07.24 SNPs with a genotyping call rate lower than 98% and those that were not in Hardy-Weinberg equilibrium (HWE; p < 0.001) were removed from the analysis. Similarly, subjects were excluded if fewer than 90% of SNPs were called. In addition, principal-component (PC) analyses were performed to identify and exclude outliers based on their ethnicity by PLINK and the gcta64 and R-base under GNU Public license v.2. With this software, we calculated and plotted the three first PCs using the “null” SNPs of the Immunochip (i.e., not associated with autoimmune diseases) for each subject, and those who deviated more than 4 SDs from the cluster centroids were considered outliers. PC analysis was also used to confirm that all subjects in our filtered study cohorts overlapped with the CEU cohort of the HapMap project (Figure S1). Furthermore, one subject per duplicate pair and per pair of first-degree relatives was also removed via the Genome function with a Pi-HAT threshold 0.5 in PLINK. A total of 1,651 GCA case subjects and 15,306 unrelated control subjects remained after applying the above filters. The final genotyping call rate in the pooled dataset, which contained information of 95,416 non-imputed genetic variants, was 99.94%.
HLA Imputation
We subsequently isolated the genotyping data from the extended major histocompatibility complex (xMHC) region, located in chromosome 6,25 and used a previously validated imputation method to analyze the variation within the xMHC region of SNPs, classical HLA alleles, and amino acidic variants.21,22 In brief, to impute this genomic region, we used the SNP2HLA method with the Beagle software package22,26 and a reference panel comprised of 5,225 individuals of European origin27 with genotyping data of 8,961 common SNPs and indel polymorphisms across the xMHC region, and four digits genotyping data of the HLA class I and II molecules.28 Imputed data were also filtered with PLINK with the following thresholds: 95% success call rate for alleles and amino acids, deviation from HWE considering a p value of 0.001 for SNPs in controls, and 95% total call rate for individuals. Information from a total of 7,179 SNPs, 423 classical HLA alleles (126 at two-digit and 297 at four-digit resolution) of HLA-A (MIM 142800), HLA-B (MIM 142830), HLA-C (MIM 142840), HLA-DRB1 (MIM 142857), HLA-DQB1 (MIM 604305), HLA-DQA1 (MIM 146880), HLA-DPB1 (MIM 142858), and HLA-DPA1 (MIM 142880), and 1,275 amino acidic variants were included in the clean dataset (Table S2).
HLA Imputation Accuracy
To check the imputation accuracy, we obtained sequence-based types from a subset of 200 case subjects with GCA and unaffected control subjects (selected randomly from the Spanish cohort included in this study) for the classical HLA class II alleles DQA1, DQB1, and DRB1 at four-digit resolution, using the kits LABType SSO Class II DQA1/DQB1 Typing Test and LABType SSO Class II DRB1 Typing Test from One Lambda, because these molecules harbored the most significant amino acid associations (see below). In addition, we also used available data in our laboratory from 185 previously genotyped unaffected control subjects for the class I molecule HLA-B. We then compared the genotypes obtained serologically with the imputed ones as previously described.21
Imputation of Non-HLA Regions
We performed SNP genotype imputation of the most associated loci outside the HLA region. For that, we isolated the genotyping data of 5 Mb regions centered in the lead SNPs and obtained imputed genotypes with the software IMPUTE v.2.29 The 1000 Genomes Phase 3 was used as reference panel.30 The probability threshold for merging genotypes was established at 0.9. Imputed data were subsequently subjected to stringent quality filters in PLINK, i.e., individuals who generated genotypes at <90% were removed from the datasets, and SNPs with call rates <98% and those that deviated from HWE in control subjects (p < 0.001) were also discarded.
Statistical Analyses
CaTS Power Calculator for Genetic Studies, which implements the methods described in Skol et al.,31 was used to estimate the statistical power of our study (Table S3).
The statistical analyses were performed with PLINK and R. To test for association, we compared the variation frequencies of case and control subject by logistic regression on the best-guess genotypes (>0.9 probability) assuming an additive model with the three first PCs, the gender, and the country of origin as covariates. A minimal difference in the results was observed after adjusting for five or ten PCs. Inverse variance weighted fixed effects meta-analysis was also used to evaluate the consistency of the results of the non-HLA region. For the HLA region, we tested SNPs, classical HLA alleles, and all possible combinations of amino acid residues per position. Statistical significance was established by comparison of the deviance model to the null model as previously described.19,22 Cochran’s Q and I2 tests were used to measure the heterogeneity of the ORs across studies.
The omnibus association test was also performed to determine the influence of the polymorphic amino acid positions in the disease susceptibility, as described.21 We established a null generalized linear model, which included the first three PCs, the country of origin, and gender as variables. Then, an alternative model was built for each position, including the previously described variables and all the possible alleles in the analyzed positions. Finally, both models were compared with a likelihood ratio test. This gives rise to a n − 1 degrees of freedom test, where n is the number of alternative alleles at that position. Additionally, we also conducted conditional analyses controlling the amino acid positions by the most associated positions with a putative functional effect in our set (conditioning factors). In these conditional analyses, the conditioning factors were included in both the null and the alternative models. By these means, we could test the association of all residues in the analyzed positions but including the conditioning factors as covariates in the models.
The haplotypes of the associated amino acid positions were also evaluated by additive logistic regression. Amino acid combinations with a frequency < 1% in control groups were excluded from this analysis.
To identify independent effects, dependency analyses by step-wise logistic regression were carried out with conditioning by the most associated signals, as described.9 The statistical significance was set at 5 × 10⁻⁸. Odds ratios (OR) and 95% confidence intervals (CI) were also calculated. The Manhattan plots were obtained with an in-house modification of the R script written by Stephen Turner, and the 3D models of the HLA molecules were performed with the UCSF Chimera software.32 The online tool of LocusZoom v.1.133 was used to plot the results of the imputed regions.
Analysis of Enrichment of Rheumatoid-Arthritis-Associated Variants
Considering that previous candidate gene studies5 and the results reported here (see below) suggested a possible overlap between part of the genetic background of RA and GCA, we carried out an analysis of enrichment of confirmed RA-associated alleles in our GCA cohort. With this aim, we calculated in PLINK a genetic score predicting RA risk for each participant in our study by obtaining a weighted mean of genotype dosage across 52 RA-associated variants. These include the 5 amino acids conferring higher risk in the amino acid model proposed by Raychaudhuri et al.21 and 47 non-HLA SNPs (22 exact ones and 25 proxies with r2 > 0.9 in the CEU population of the 1000 Genomes project) out of the 101 reported in Okada et al.34 The remaining SNPs were not used to calculate the scores either because they were not included in our GCA dataset or because they had a reduced statistical significance in the European population (p < 1 × 10⁻⁶).
The effect estimates used to weight the scores were the log of the ORs reported for the European population in Table S1 of Okada et al.34 and the per-allele ORs (i.e., assuming an additive genetic model) reported in the Table S4 of Raychaudhuri et al.21 Table S4 summarizes the main aspects of the variants included in the analysis.
To analyze the possible difference between the score distribution in case and control subjects, a null generalized linear model including the first three PCs, country of origin, and gender as variables was compared against an alternative model including the same variables and the RA risk scores by the means of a likelihood ratio test in R.
Results
Association signals at the genome-wide level of significance were observed only in the combined analysis (Figure 1) and in the independent analyses of the cohorts with higher statistical power, i.e., Spain, UK, and North America (Figure S2). In all cases, those signals were located within the HLA region at chromosome 6 (Table S5).
Figure 1.

Manhattan Plot Representation of the Immunochip Results
The −log10 of the combined logistic regression test p values are plotted against their physical chromosomal position. The red line represents the genome-wide level of significance (p < 5 × 10⁻⁸), and the blue line represents the statistical significance for suggestive signals (p < 1 × 10⁻⁴). The most relevant associations are highlighted.
Deep Interrogation of the HLA Region
To narrow down the HLA association with GCA, we inferred SNPs, classical HLA alleles, and polymorphic amino acid positions. The overall accuracy reached after comparing four-digit types with the corresponding imputed data was 99.48% for HLA-DQA1, 98.45% for HLA-DQB1, 89.94% for HLA-DRB1, and 88.11% for HLA-B (Table S6 and Figure S3).
After the imputation, high association peaks were observed in HLA-DRB1∗04, HLA-DQA1∗03, and HLA-DQB1∗03 alleles (Table 1), particularly HLA-DRB1∗04:04 (p = 2.12 × 10⁻²³, OR = 2.28), HLA-DQA1∗03:01 (p = 1.38 × 10⁻³⁵, OR = 1.85), and HLA-DQB1∗03:02 (p = 3.93 × 10⁻²⁸, OR = 1.90). Consequently, different amino acids included in those alleles were also strongly associated with disease predisposition in the combined analysis (Table S5). However, the peak signal corresponded to a SNP (rs477515, p = 4.05 × 10−40, OR = 1.73) in high linkage disequilibrium (LD; r2 = 0.43, D’ = 1.00) with a group of SNPs and amino acids of HLA-DRB1 in complete LD with one another that have a stronger effect size (OR = 1.92), including a His in position 13 (p = 5.12 × 10−38, OR = 1.92) located in the binding groove of the molecule.35 This SNP maps to the intergenic region between HLA-DRB1 and HLA-DQA1 genes and has no putative regulatory effect according to the regulomeDB database (score = 6), although a possible relevant function of rs477515 can not be ruled out.
Table 1.
Genome-wide Significant Associations of Classical HLA Alleles with Giant Cell Arteritis without Conditioning at Two- and Four-Digit Resolution
| Classical HLA Allele |
Allele Frequency |
Meta-analysis |
||||||||||||
|---|---|---|---|---|---|---|---|---|---|---|---|---|---|---|
|
Spain |
UK |
North America |
Italy |
Norway |
Germany |
|||||||||
| GCA | CTRL | GCA | CTRL | GCA | CTRL | GCA | CTRL | GCA | CTRL | GCA | CTRL | p Value | OR (95% CI) | |
| DRB1∗04 | 0.2104 | 0.1276 | 0.3247 | 0.1944 | 0.2854 | 0.1651 | 0.1155 | 0.0736 | 0.3182 | 0.2233 | 0.2263 | 0.1453 | 6.78 × 10−38 | 1.92 (1.74–2.12) |
| DQA1∗03 | 0.2156 | 0.1381 | 0.3327 | 0.2069 | 0.3024 | 0.1758 | 0.1218 | 0.0776 | 0.3384 | 0.2326 | 0.2368 | 0.1564 | 1.38 × 10⁻³⁵ | 1.85 (1.68–2.04) |
| DQA1∗01 | 0.3014 | 0.3767 | 0.2410 | 0.3885 | 0.2732 | 0.4007 | 0.2668 | 0.3622 | 0.2727 | 0.4412 | 0.3211 | 0.4382 | 3.84 × 10⁻²⁹ | 0.61 (0.56–0.67) |
| DQB1∗03 | 0.3847 | 0.3174 | 0.4781 | 0.3434 | 0.4415 | 0.3501 | 0.4475 | 0.4193 | 0.4697 | 0.3262 | 0.4316 | 0.3380 | 5.15 × 10⁻¹⁹ | 1.44 (1.33–1.56) |
| DQB1∗05 | 0.1560 | 0.1823 | 0.0737 | 0.1550 | 0.0878 | 0.1697 | 0.1471 | 0.2291 | 0.0657 | 0.1578 | 0.1053 | 0.1662 | 2.94 × 10⁻¹⁵ | 0.63 (0.56–0.71) |
| DQB1∗06 | 0.1455 | 0.1941 | 0.1693 | 0.2339 | 0.1854 | 0.2310 | 0.1197 | 0.1331 | 0.2071 | 0.2834 | 0.2053 | 0.2717 | 4.28 × 10⁻¹⁰ | 0.72 (0.65–0.80) |
| DRB1∗14 | 0.0125 | 0.0290 | 0.0159 | 0.0247 | 0.0171 | 0.0286 | 0.0189 | 0.0654 | 0.0051 | 0.0227 | 0.0053 | 0.0217 | 7.23 × 10⁻⁹ | 0.40 (0.29–0.54) |
| DQA1∗0301 | 0.2156 | 0.1381 | 0.3327 | 0.2069 | 0.3024 | 0.1758 | 0.1218 | 0.0776 | 0.3384 | 0.2326 | 0.2368 | 0.1564 | 1.38 × 10⁻³⁵ | 1.85 (1.68–2.04) |
| DQB1∗0302 | 0.1481 | 0.0962 | 0.1773 | 0.1047 | 0.2098 | 0.0984 | 0.0924 | 0.0547 | 0.2778 | 0.1444 | 0.1526 | 0.1084 | 3.93 × 10⁻²⁸ | 1.90 (1.69–2.12) |
| DRB1∗0404 | 0.0826 | 0.0369 | 0.0877 | 0.0485 | 0.0829 | 0.0372 | 0.0231 | 0.0098 | 0.1313 | 0.0588 | 0.0579 | 0.0299 | 2.12 × 10⁻²³ | 2.28 (1.94–2.68) |
| DRB1∗0401 | 0.0695 | 0.0340 | 0.2012 | 0.1154 | 0.1415 | 0.0865 | 0.0420 | 0.0193 | 0.1667 | 0.1417 | 0.1263 | 0.0959 | 2.77 × 10⁻¹⁸ | 1.80 (1.58–2.06) |
| DQA1∗0101 | 0.1415 | 0.1575 | 0.0677 | 0.1458 | 0.0805 | 0.1493 | 0.1050 | 0.1768 | 0.0556 | 0.1524 | 0.0947 | 0.1451 | 8.83 × 10⁻¹³ | 0.64 (0.57–0.73) |
| DQA1∗0102 | 0.1035 | 0.1368 | 0.1295 | 0.1889 | 0.1415 | 0.1856 | 0.0840 | 0.1315 | 0.1566 | 0.2126 | 0.1421 | 0.2106 | 2.02 × 10⁻¹⁰ | 0.68 (0.61–0.77) |
| DQB1∗0503 | 0.0125 | 0.0284 | 0.0159 | 0.0255 | 0.0171 | 0.0283 | 0.0210 | 0.0634 | 0.0051 | 0.0214 | 0.0053 | 0.0211 | 3.21 × 10⁻⁸ | 0.42 (0.31–0.57) |
Dependence Analysis
We then hypothesized that the HLA association with GCA might be explained by polymorphic amino acid residues, as reported for other immune-mediated diseases,21,36,37 and we carried out further logistic regression analysis of the HLA data controlling for the most associated amino acid residues. If the most associated signals were in high LD, we selected for those located in the binding pocket of their corresponding molecule.
A summary of the logistic regression analysis is shown in Figure 2. First, we included the above-mentioned HLA-DRβ1 His13 amino acid as covariate, which decreased considerably the statistical significance of the class-II-associated signals (highest peak: rs3104407, p = 3.27 × 10⁻¹⁶, OR = 0.70; Figure 2B). Subsequently, the addition to the model of a glycine (Gly) in position 56 of the HLA-DQα1 chain explained the association at the genome-wide level of significance observed in the class II region, although some independent signals in class I (i.e., amino acids in positions 45 and 97 of HLA-B and the SNP rs3130944) still remained (highest peak: presence of Arg or Thr in position 97 of HLA-B, p = 1.36 × 10⁻⁸; Figure 2C). Finally, when a Thr in position 45 of the HLA-B molecule was included in the condition list, all the class I variants were non-significant (Figure 2D). Hence, the model that best explained the HLA association with GCA included HLA-DRβ1 His13 (p = 5.12 × 10−38, OR = 1.92), HLA-DQα1 Gly56 (p = 3.84 × 10⁻²⁹, OR = 0.61), and HLA-B Thr45 (p = 3.78 × 10⁻⁹, OR = 0.76) (Table S5). However, it should be noted that we based our analysis on the hypothesis that the leading drivers are most likely to be located in antigen-binding pockets of the HLA molecules and, therefore, other putative models (e.g., including the rs477515 genetic variant) might also explain our data equally well.
Figure 2.

Manhattan Plot Representation of the Step-wise Conditional Logistic Regression of the HLA Region
(A) Unconditioned test of the HLA region.
(B) Results of the HLA region after conditioning to HLA-DRβ1 His13.
(C) Results of the HLA region after conditioning to HLA-DRβ1 His13 and HLA-DQα1 Gly56.
(D) Results of the HLA region after conditioning to HLA-DRβ1 His13, HLA-DQα1 Gly56, and HLA-B Thr45.
The −log10 of the combined logistic regression test p values are plotted against their physical chromosomal position. A red/blue color gradient was used to represent the effect size of each analyzed variant (red for risk and blue for protection). The red line represents the genome-wide level of significance (p < 5 × 10⁻⁸).
Omnibus Test
We also tested the possible influence of the polymorphic amino acid positions by means of an omnibus test (Table S7 and Figure S4). The most associated signals corresponded to the HLA-DQα1 positions 47, 56, and 76 (p = 4.02 × 10−46, p = 1.84 × 10−45, and p = 1.84 × 10−45, respectively). Regarding the latter, DQα1 76 might harbor three amino acid residues (Val76, Met76, and Leu76) that are in complete LD with the three possible variants in DQα1 56 (Arg56, Gly56, and ∗56) and, therefore, they cannot be distinguished by statistical analysis alone. In relation to DQα1 47, four amino acids can be present at this position (Gln47, Arg47, Lys47, and Cys47). Two of them (Gln47 and Arg47) are in complete LD with amino acids of DQα1 56-76 and form two haplotypes, i.e., Gln47-Arg56-Val76 (haplotype A, conferring risk) and Arg47-Gly56-Met76 (haplotype B, conferring protection) (Figure 3A, Table S8). The third and fourth possible DQα1 47 amino acids also form two other haplotypes with DQα1 ∗56-Leu (haplotype C, Lys47-∗56-Leu76; and haplotype D, Cys47-∗56-Leu76), but those haplotypes did not reach statistical significance (Table S8). Position 13 of HLA-DRβ1 also showed high association (p = 4.08 × 10−43), and the only class-I-associated position was HLA-B 45 (p = 4.12 × 10⁻⁹). It was not possible to unambiguously established casualty from HLA-DRβ1 13 over DQα1 positions 47, 56, and 76 due to the high LD between some of the amino acids at those positions (Table S8).
Figure 3.

Haplotypes Observed in Our Dataset between the Residues of the Class II Positions of the Model that Best Explains the Association of This Genomic Region with Giant Cell Arteritis
(A) Graphical representation of the four haplotypes formed by the amino acids of the DQα1 positions 47, 56, and 76. The frequency of every amino acid is shown in brackets.
(B) Each row refers to the haplotype of one HLA-DRβ1 13 amino acid and one HLA-DQα1 haplotype. Haplotype frequencies of case subjects (red) and control subjects (blue), odds ratios (OR), and −log10 of the logistic regression test p values are plotted. A red/blue color gradient was used in the OR bars to represent the effect size of each analyzed variant (red for risk and blue for protection).
Considering the similarity in the association with RA susceptibility observed for the positions 11 and 13 of HLA-DRβ1,21 we conditioned these two positions one to another to analyze possible casualty in GCA. Contrary to that observed in RA, position 11 completely lost its statistical significance after conditioning on position 13 (conditioned p = 0.64), whereas a suggestive p value was observed for position 13 after conditioning on position 11 (conditioned p = 6.74 × 10⁻⁶).
Table 2 summarizes the results of the associated amino acids within the positions comprising our proposed model to explain the HLA association with GCA.
Table 2.
HLA Residues Associated at the Genome-wide Level of Significance of the Amino Acid Positions Included in the Model that Best Explains the HLA Association with Giant Cell Arteritis
| Molecule | Amino Acid Residues | Population |
Residue Frequency |
p Value | OR (95% CI) | Classical HLA Alleles | |
|---|---|---|---|---|---|---|---|
| GCA | CTRL | ||||||
| HLA-DRβ1 | His13∗ | Meta-analysis | 5.12 × 10−38 | 1.92 (1.74–2.12) | 04:01, 04:02, 04:03, 04:04, 04:05, 04:07, and 04:08 | ||
| Spain | 0.2097 | 0.1272 | 7.24 × 10⁻¹⁴ | 1.94 (1.63–2.31) | |||
| UK | 0.3247 | 0.1944 | 1.81 × 10⁻¹² | 2.00 (1.65–2.43) | |||
| North America | 0.2854 | 0.1651 | 9.44 × 10⁻⁹ | 2.02 (1.59–2.57) | |||
| Italy | 0.1155 | 0.0724 | 1.54 × 10⁻³ | 1.71 (1.23–2.37) | |||
| Norway | 0.3182 | 0.2233 | 9.29 × 10⁻³ | 1.64 (1.13–2.38) | |||
| Germany | 0.2263 | 0.1451 | 2.19 × 10⁻³ | 1.77 (1.23–2.54) | |||
| Ser13∗ | Meta-analysis | 3.27 × 10⁻⁸ | 0.79 (0.73–0.86) | 03:01, 11:01, 11:02, 11:03, 11:04, 13:01, 13:02, 13:03, 13:05, 14:01, and 14:02 | |||
| Spain | 0.3270 | 0.4123 | 9.70 × 10⁻⁹ | 0.68 (0.60–0.78) | |||
| UK | 0.1633 | 0.2087 | 1.57 × 10⁻² | 0.74 (0.58–0.95) | |||
| North America | 0.3317 | 0.3699 | 1.53 × 10⁻¹ | 0.85 (0.68–1.06) | |||
| Italy | 0.4958 | 0.5028 | 8.88 × 10⁻¹ | 0.99 (0.81–1.20) | |||
| Norway | 0.3030 | 0.3115 | 8.00 × 10⁻¹ | 0.95 (0.67–1.37) | |||
| Germany | 0.3737 | 0.3739 | 8.36 × 10⁻¹ | 0.97 (0.71–1.32) | |||
| HLA-DQα1 | Gln47 | Meta-analysis | 1.38 × 10⁻³⁵ | 1.85 (1.68–2.04) | 03:01 | ||
| Arg56∗ | Spain | 0.2156 | 0.1381 | 4.86 × 10⁻¹² | 1.81 (1.53–2.15) | ||
| Val76 | UK | 0.3327 | 0.2069 | 3.36 × 10⁻¹¹ | 1.91 (1.58–2.31) | ||
| North America | 0.3024 | 0.1758 | 4.32 × 10⁻⁹ | 2.02 (1.60–2.56) | |||
| Italy | 0.1218 | 0.0776 | 1.52 × 10⁻³ | 1.69 (1.22–2.34) | |||
| Norway | 0.3384 | 0.2326 | 4.20 × 10⁻³ | 1.71 (1.19–2.47) | |||
| Germany | 0.2368 | 0.1564 | 3.26 × 10⁻³ | 1.71 (1.20–2.44) | |||
| Arg47 | Meta-analysis | 3.84 × 10⁻²⁹ | 0.61 (0.56–0.67) | 01:01, 01:02, and 01:03 | |||
| Gly56∗ | Spain | 0.3014 | 0.3767 | 2.20 × 10⁻⁷ | 0.70 (0.61–0.80) | ||
| Met76 | UK | 0.2410 | 0.3885 | 5.27 × 10⁻¹¹ | 0.50 (0.41–0.61) | ||
| North America | 0.2732 | 0.4007 | 1.46 × 10⁻⁶ | 0.56 (0.44–0.71) | |||
| Italy | 0.2668 | 0.3622 | 5.40 × 10⁻⁵ | 0.64 (0.52–0.79) | |||
| Norway | 0.2727 | 0.4412 | 3.68 × 10⁻⁵ | 0.46 (0.32–0.67) | |||
| Germany | 0.3211 | 0.4382 | 1.90 × 10⁻³ | 0.60 (0.44–0.83) | |||
| HLA-B | Thr45∗ | Meta-analysis | 3.78 × 10⁻⁹ | 0.76 (0.69–0.83) | 18:01, 35:01, 35:02, 35:03, 35:08, 35:12, 37:01, 51:01, 51:06, 51:08, 52:01, 53:01, and 58:01 | ||
| Spain | 0.2608 | 0.3082 | 5.57 × 10⁻⁴ | 0.78 (0.68–0.90) | |||
| UK | 0.1175 | 0.1703 | 1.80 × 10⁻³ | 0.65 (0.49–0.85) | |||
| North America | 0.1756 | 0.2383 | 6.83 × 10⁻³ | 0.69 (0.53–0.90) | |||
| Italy | 0.3718 | 0.4331 | 1.87 × 10⁻² | 0.78 (0.64–0.96) | |||
| Norway | 0.1162 | 0.1551 | 1.48 × 10⁻¹ | 0.70 (0.43–1.13) | |||
| Germany | 0.2105 | 0.2167 | 8.83 × 10⁻¹ | 0.97 (0.68–1.39) | |||
The classical HLA alleles in our dataset that contain those amino acids are shown. Asterisk (∗) indicates amino acids involved in antigen binding.
Additionally, similar to that observed in the analysis of the specific amino acid residues, no statistically significant signals were detected after including the amino acids of HLA-DRβ1 13, HLA-DQα1 56, and HLA-B 45 as conditioning factors in the analyses (Figure S4).
Haplotype Analysis
Taking into account the high LD of the class II HLA genomic region, we decided to carry out a haplotype test combining all the possible amino acids present in the class II positions of the model (Figure 3). Although different haplotypes surpassed the genome-wide significance threshold, none of them showed a significant improvement in the association observed for the associated amino acids of HLA-DRβ1 13 and DQα1 47, 56, and 76 independently. Similar results were observed when the haplotypes were examined including the amino acids of position 45 of the class I molecule HLA-B (Table S9). This was consistent with the fact that: (1) HLA-DRβ1 His13 and the haplotype A of HLA-DQα1 (Gln47-Arg56-Val76), which are in high LD (r2 = 0.92), defined the higher association signal in the haplotype analysis (p = 4.12 × 10−37, OR = 1.90); (2) all the most significant risk haplotypes included the amino acid HLA-DRβ1 His13 (DRβ1 His13 - DQα1 haplotype A, p = 4.12 × 10−37, OR = 1.90; DRβ1 His13 - DQα1 haplotype A - B Glu45, p = 9.09 × 10⁻²⁰, OR = 2.52; DRβ1 His13 - DQα1 haplotype A - B Met45, p = 1.03 × 10⁻¹⁸, OR = 2.78; DRβ1 His13 - DQα1 haplotype A - B Lys45, p = 3.05 × 10⁻¹⁴, OR = 1.86); and (3) haplotype B of DQα1 (Arg47-Gly56-Met76) was included in the haplotypes conferring higher protection (DRβ1 Ser13 - DQα1 haplotype B, p = 7.72 × 10⁻¹⁶, OR = 0.52; DRβ1 Ser13 - DQα1 haplotype B - B Thr45, p = 9.16 × 10⁻⁸, OR = 0.39).
Analysis of the Non-HLA Region
No associations at the genome-wide significance level were detected when the non-HLA region was analyzed by logistic regression (Table 3). Two genetic variants of the protein tyrosine phosphatase non-receptor type 22 (PTPN22 [MIM 600716]) gene in almost complete LD (r2 = 0.99) represented the highest non-HLA association signal with GCA (rs6679677, p = 1.31 × 10⁻⁶, OR = 1.39; rs2476601, p = 1.73 × 10⁻⁶, OR = 1.38). One of them (rs2476601) is a non-synonymous (p.Arg620Trp) functional variant that has been associated with a variety of immune-mediated diseases,38 including GCA (in a study with partial overlap of the sample collections with this one).39 Suggestive association (p < 10−4) was also found for another two tightly linked SNPs (r2 = 0.99) located in the leucine-rich repeat containing 32 (LRRC32 [MIM 137207]) region (rs10160518, p = 4.39 × 10⁻⁶, OR = 1.20; rs2155219, p = 6.19 × 10⁻⁶, OR = 1.19). Other suggestive signals included SNPs of key immune-related genes such as v-rel avian reticuloendotheliosis viral oncogene homolog (REL [MIM 164910]; rs115674477, p = 1.10 × 10⁻⁵, OR = 1.63), protein kinase C theta (PRKCQ [MIM 600448]; rs587198, p = 5.72 × 10⁻⁵, OR = 1.17), cluster domain 226 (CD226 [MIM 605397]; rs1788110, p = 6.51 × 10⁻⁵, OR = 0.85), and NLR family pyrin domain containing 6 (NLRP6 [MIM 609650]; rs3817637, p = 8.67 × 10⁻⁵, OR = 0.77).
Table 3.
Signals outside the HLA Region Showing a Trend of Association of p < 10−4 with Giant Cell Arteritis
| Chr | rs ID |
Position |
Locus | Minor/Major Allele |
Minor Allele Frequency |
Meta-analysis |
||||||||||||
|---|---|---|---|---|---|---|---|---|---|---|---|---|---|---|---|---|---|---|
|
Spain |
UK |
North America |
Italy |
Norway |
Germany |
|||||||||||||
| (GRCh36) | GCA | CTRL | GCA | CTRL | GCA | CTRL | GCA | CTRL | GCA | CTRL | GCA | CTRL | p Value | OR (95% CI) | ||||
| 1 | rs6679677 | 114105331 | PTPN22 | A/C | 0.097 | 0.063 | 0.112 | 0.095 | 0.129 | 0.097 | 0.050 | 0.035 | 0.136 | 0.115 | 0.121 | 0.112 | 1.31 × 10⁻⁶ | 1.39 (1.22–1.58) |
| 1 | rs2476601 | 114179091 | PTPN22 | A/G | 0.098 | 0.064 | 0.112 | 0.095 | 0.129 | 0.098 | 0.050 | 0.036 | 0.131 | 0.115 | 0.121 | 0.111 | 1.73 × 10⁻⁶ | 1.38 (1.21–1.58) |
| 11 | rs10160518 | 75974319 | LRRC32 | A/G | 0.500 | 0.447 | 0.528 | 0.494 | 0.522 | 0.490 | 0.494 | 0.465 | 0.561 | 0.529 | 0.605 | 0.513 | 4.39 × 10⁻⁶ | 1.20 (1.11–1.29) |
| 11 | rs2155219 | 75976842 | LRRC32 | C/A | 0.499 | 0.446 | 0.528 | 0.494 | 0.520 | 0.490 | 0.494 | 0.465 | 0.561 | 0.531 | 0.605 | 0.514 | 6.19 × 10⁻⁶ | 1.19 (1.11–1.29) |
| 2 | rs115674477 | 60965427 | REL | G/A | 0.039 | 0.029 | 0.032 | 0.023 | 0.039 | 0.016 | 0.034 | 0.017 | 0.046 | 0.036 | 0.032 | 0.019 | 1.10 × 10⁻⁵ | 1.63 (1.31–2.03) |
| 21 | rs2236430 | 32895279 | TCP10L-C21orf59 | A/G | 0.306 | 0.293 | 0.347 | 0.317 | 0.349 | 0.320 | 0.387 | 0.302 | 0.389 | 0.297 | 0.437 | 0.361 | 1.33 × 10⁻⁵ | 1.20 (1.11–1.30) |
| 11 | rs2508740 | 75904830 | C11orf30 | G/A | 0.375 | 0.425 | 0.383 | 0.396 | 0.359 | 0.395 | 0.366 | 0.399 | 0.364 | 0.436 | 0.321 | 0.388 | 2.06 × 10⁻⁵ | 0.84 (0.78–0.91) |
| 11 | rs1892952 | 76042374 | LRRC32 | A/G | 0.528 | 0.473 | 0.496 | 0.480 | 0.524 | 0.501 | 0.532 | 0.495 | 0.525 | 0.480 | 0.558 | 0.491 | 4.11 × 10⁻⁵ | 1.17 (1.09–1.27) |
| 6 | rs11752919 | 28511582 | ZSCAN23 | G/A | 0.347 | 0.407 | 0.363 | 0.409 | 0.363 | 0.359 | 0.263 | 0.280 | 0.313 | 0.365 | 0.332 | 0.339 | 5.22 × 10⁻⁵ | 0.84 (0.78–0.92) |
| 11 | rs7926009 | 75845110 | C11orf30 | G/A | 0.388 | 0.435 | 0.388 | 0.407 | 0.381 | 0.410 | 0.382 | 0.412 | 0.374 | 0.448 | 0.342 | 0.398 | 5.51 × 10⁻⁵ | 0.85 (0.79–0.92) |
| 11 | rs10790958 | 127862477 | ETS1 | C/G | 0.320 | 0.301 | 0.351 | 0.323 | 0.354 | 0.295 | 0.267 | 0.226 | 0.404 | 0.338 | 0.384 | 0.330 | 5.71 × 10⁻⁵ | 1.19 (1.09–1.29) |
| 10 | rs587198 | 6571155 | PRKCQ | G/A | 0.447 | 0.401 | 0.484 | 0.453 | 0.459 | 0.451 | 0.490 | 0.461 | 0.525 | 0.433 | 0.516 | 0.454 | 5.72 × 10⁻⁵ | 1.17 (1.09–1.27) |
| 18 | rs1788110 | 65719816 | CD226 | G/C | 0.321 | 0.337 | 0.257 | 0.318 | 0.334 | 0.337 | 0.334 | 0.411 | 0.298 | 0.369 | 0.295 | 0.320 | 6.51 × 10⁻⁵ | 0.85 (0.78–0.92) |
| 10 | rs10749570 | 90028013 | C10orf59 | A/C | 0.277 | 0.343 | 0.309 | 0.335 | 0.327 | 0.344 | 0.319 | 0.324 | 0.301 | 0.366 | 0.358 | 0.360 | 7.27 × 10⁻⁵ | 0.84 (0.78–0.92) |
| 14 | rs10149689 | 80485553 | C14orf145-TSHR | G/A | 0.417 | 0.458 | 0.462 | 0.449 | 0.395 | 0.456 | 0.410 | 0.467 | 0.399 | 0.447 | 0.358 | 0.404 | 7.36 × 10⁻⁵ | 0.85 (0.79–0.92) |
| 11 | rs3817637 | 275920 | NLRP6-ATHL1 | A/G | 0.091 | 0.124 | 0.084 | 0.114 | 0.122 | 0.115 | 0.090 | 0.134 | 0.152 | 0.128 | 0.090 | 0.121 | 8.67 × 10⁻⁵ | 0.77 (0.68–0.88) |
| 11 | rs10160382 | 75804862 | PRKRIR-C11orf30 | G/A | 0.321 | 0.357 | 0.331 | 0.354 | 0.322 | 0.351 | 0.332 | 0.363 | 0.328 | 0.385 | 0.284 | 0.343 | 9.60 × 10⁻⁵ | 0.85 (0.78–0.92) |
Similar results were observed when the dataset was analyzed with inverse variance weighted meta-analysis (Table S10). However, in this analysis REL rs115674477 corresponded with the second top signal, with a statistical significance (p = 3.56 × 10⁻⁶, OR = 1.67) very similar to that observed for PTPN22.
In order to conduct a more detailed analysis of the top signals, we obtained imputed data of the PTPN22, LRRC32, and REL genomic regions. A total of 922 SNPs in the PTPN22 region, 462 in the LRRC32 region, and 1,158 in the REL region were included in the imputed datasets. However, because of the dense coverage of the fine-mapped loci in the Immunochip, all the imputed variants showed a lower statistical significance than PTPN22 rs2476601, LRRC32 rs10160518, and REL rs115674477 (Figure 4), consistent with previous studies.19
Figure 4.
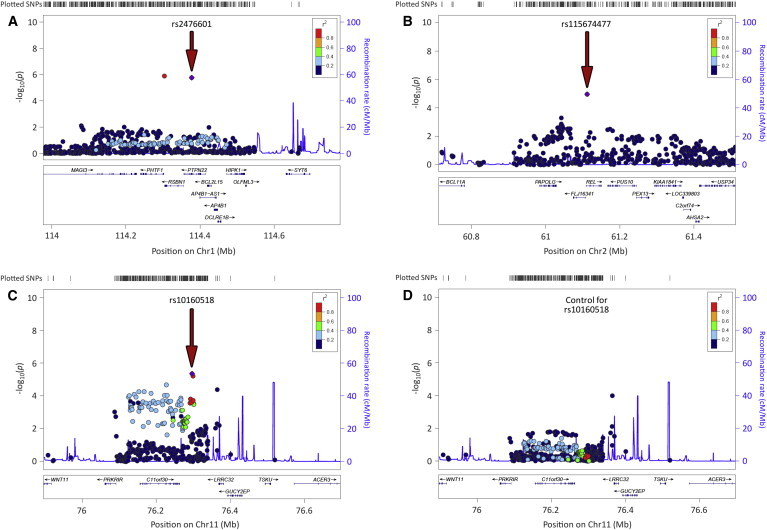
Regional Plots of the Three Most Associated Loci with GCA outside the HLA Region in the Overall Meta-analysis after Imputation
(A) Protein tyrosine phosphatase non-receptor type 22 (PTPN22) region.
(B) v-rel avian reticuloendotheliosis viral oncogene homolog (REL) region.
(C) Leucine-rich repeat containing 32 (LRRC32) region.
(D) Results for the LRRC32 region after conditioning for the lead SNP (rs10160518).
Red arrows point to the lead variants (highlighted in violet).
We checked the statistical significance of genes reported to be associated with GCA in candidate gene studies.5 Although the signals were relatively weak, associations at p < 0.05 were observed in most cases (Table S11 and Figure S5), e.g., nitric oxide synthase 2 inducible (NOS2 [MIM 163730]; rs2274894, p = 1.58 × 10⁻³, OR = 1.14), interleukin 6 (IL6 [MIM 147620]; rs10242595, p = 3.70 × 10⁻³, OR = 0.89), IL4 ([MIM 147780]; rs2243200, p = 4.47 × 10⁻³, OR = 6.86), interferon gamma (IFNG [MIM 147570]; rs2193046, p = 5.08 × 10⁻³, OR = 0.89), and IL10 ([MIM 124092]; rs74148796, p = 7.84 × 10⁻³, OR = 0.83).
Considering that a shared genetic component might influence the development of different autoimmune phenotypes,20,40 we also checked the results of specific known susceptibility SNPs for immune-mediated diseases in our dataset accordingly with the reported data in Table S5 of Ricaño-Ponce and Wijmenga.40 Associations at the nominal level (p < 0.05) between GCA and several autoimmune SNPs were observed (Table S12), with PTPN22 rs6679677/rs2476601 (associated with RA, type 1 diabetes [MIM 222100], and Crohn disease [MIM 266600], among others) and LRRC32 rs10160518/rs2155219 (associated with ulcerative colitis, UC [MIM 266600]) representing the strongest signals.
Polygenic Risk Score Analysis
Taking into account that some of the most associated variants with GCA are confirmed RA risk factors, we calculated polygenic risk scores predictive for RA susceptibility in our samples and tested whether there were differences in the distribution of the scores between case and control subjects (Figure 5). Three different scores were constructed per sample: (1) with all the RA-associated variants, (2) including only the non-HLA SNPs, and (3) considering only the HLA amino acids conferring higher susceptibility to RA.21 In the three analyses, the mean score was higher in the GCA set that in control subjects. The most significant differences between case and control subjects were observed when the scores were calculated with all the RA variants (likelihood p value = 9.32 × 10⁻²⁸; Figures 5A and 5B). The difference of the score distribution between case and control subjects was also highly significant when only the five RA-risk amino acids were considered to calculate the scores (likelihood p value = 3.71 × 10⁻²³; Figures 5E and 5F). Although a less significant p value was obtained with the scores calculated with the non-HLA alleles, there was still some evidence of an effect (likelihood p value = 5.57 × 10⁻⁶; Figures 5C and 5D). However, these results must be interpreted with caution, because they suggest only that RA and GCA case subjects are genetically more similar to each other than each is to healthy control subjects. Further analyses are needed to obtain a better estimation of the shared genetic component between this type of vasculitis and other immune-mediated diseases.
Figure 5.

Distributions of Genetic Risk Score Predictive for Susceptibility to Develop Rheumatoid Arthritis by Disease Status
(A, C, and E) Histogram of genetic risk scores calculated with all the RA alleles (A), with non-HLA alleles only (C), or with HLA alleles only (E).
(B, D, and F) Distribution curve of genetic risk scores calculated with all the RA alleles (B), with non-HLA alleles only (D), or with HLA alleles only (F).
Discussion
This study was performed with a large GCA cohort of individuals from different European ancestries that cover the whole gradient in prevalence for populations of European descent.41
Our data show strong evidence for substantial involvement of HLA class II region in the pathophysiology of GCA. We confirmed the previous associations of GCA with HLA-DRB1∗04 alleles (both 04:01 and 04:04).42–49 We also identified HLA-DQA1 as an independent novel susceptibility factor for GCA, specifically the classical alleles DQA1∗0101, DQA1∗0102, and HLA-DQA1∗03:01. The level of statistical significance observed within the HLA region in our study highlights the importance of the immune system in the development of GCA. Our results are consistent with the hypothesis of dysregulated interactions between the vessel wall and immune cells as responsible for the development of large-vessel vasculitides.50
Novel imputation methods are allowing the identification of specific amino acid positions of HLA molecules associated with immune-mediated diseases, including RA,21,51 SSc,19 and Behçet disease (BD [MIM 109650]),36 thus increasing our understanding of the complex HLA associations with different autoimmune processes. With this state-of-the-art methodology, we built a model including class II amino acid positions (HLA-DRβ1 13 and HLA-DQα1 47, 56, 76) and one class I amino acid position (HLA-B 45) that explained most of the HLA association with GCA in our study cohort. Some of these amino acid positions are located in the binding groove of their corresponding HLA molecules and are directly involved in the peptide binding35,52–54 (Figure 6).
Figure 6.

Ribbon Representation of the HLA Molecules HLA-DR, HLA-DQ, and HLA-B/β2 Microglobulin
The amino acid positions of the HLA model associated with GCA are highlighted in orange.
According to our results, the presence of a Thr in position 45 of HLA-B might be protective of the development of GCA. Interestingly, classical HLA alleles containing Thr45, such as HLA-B∗51:01, have been associated with a delay in the onset of AIDS (MIM 609423)-defining diseases and a better control of HIV infection.55 In addition, HLA-B∗51 (particularly 51:01) has been identified as the strongest known genetic risk factor for BD, another type of vasculitis, although HLA-B 45 does not seem to be a relevant position for this association.36 However, no significant risk effects were observed for any of the other amino acids (Met, Glu, and Lys) of this position in our sample set, despite the strong influence that this position seems to have on the features of the bound peptides.54 This could be the reason for the lower statistical significance of this position in the omnibus test compared with the associated positions of HLA-DQα1 and HLA-DRβ1. Both class II molecules harbor amino acids with strong effect sizes in both sides (e.g., risk for HLA-DRβ1 His13 / HLA-DQα1 haplotype A, and protection for HLA-DRβ1 Ser13 / HLA-DQα1 haplotype B).
In relation to HLA-DQα1, Arg56 is directly involved in hydrogen bonding to the DQ2.5-glia-γ-4c epitope,52 and it might represent a critical position in the binding groove of the HLA-DQ molecule. Additionally, DQA1∗01 alleles containing HLA-DQα1 Gly56 have been recently associated with immune-mediated disorders. For example, a model including DQA1∗01:02 (together with DRB1∗03:01 and DRB1∗08:01) has been proposed to explain the HLA associations with systemic lupus erythematosus (MIM 152700).56 Similarly, homozygosity of DQA1∗01:02 seems to play a crucial role in the development of narcolepsy with cataplexy.57
In contrast to the data on DQ∗, HLA-DRβ1 His13 is included in the previously identified GCA-associated alleles HLA-DRB1∗04:01 and HLA-DRB1∗04:04.42–49 This amino acid is in tight LD with the top most associated position with RA (HLA-DRβ1 Val11).21 In the study of RA, it was not possible to unambiguously assign causality to one position at the exclusion of the other, indicating that HLA-DRβ1 His13 cannot be ruled out as the major contributor to the HLA association with RA.21 Indeed, the two more associated amino acids with RA and GCA risk at those positions (HLA-DRβ1 His13 and HLA-DRβ1 Val11) showed also a high LD in our dataset (r2 = 0.94), and it could be possible that HLA-DRβ1 11 represents a causal position for GCA. However, the effect sizes observed for both the HLA-DRβ1 Val11 residue (p = 2.22 × 10⁻³², OR = 1.80) and the HLA-DRβ1 11 position (p = 5.06 × 10−37) were clearly lower than those observed for HLA-DRβ1 His13 (5.12 × 10−38, OR = 1.92) and position 13 of HLA-DRβ1 (p = 4.08 × 10−43) in our study. In addition, the effect of position 11 in GCA susceptibility was completely eliminated after conditioning on position 13 (p = 0.64), whereas a suggestive association with position 13 remained after conditioning on position 11 (p = 6.74 × 10⁻⁶).
Remarkably, candidate gene studies in GCA suggested that this vasculitis shares some of its genetic component with RA.5 Our data clearly support this hypothesis, because two out of the three top signals outside the HLA region in our Immunochip study, PTPN22 and REL, are important susceptibility factors for RA.34,58,59 In addition, PRKCQ, another RA risk gene of the REL pathway,60 is also among the most significant loci in our study. The above is consistent with the clear difference that we observed in the polygenic risk scores predictive for RA risk between GCA case and control subjects.
Furthermore, the autoimmune disease-associated PTPN22 SNP rs2476601/p.Arg620Trp, which is a central negative regulator of both B and T cell receptor signaling,61 was the top signal in the non-HLA analysis of GCA. There is controversy about the suitability of using the strict genome-wide significance threshold (5 × 10⁻⁸) in Immunochip studies,62 because the design of this custom array was not based on SNPs tagging the whole genome but on the fine-mapping of immune genes.6 We estimated that the total number of independent signals in our filtered dataset was 23,791 (indep-pairwise option of PLINK with values 50 5 0.2) and, therefore, an appropriate Bonferroni-based statistical threshold for our study could be considered 2.10 × 10⁻⁶. Similarly, with the Genetic type 1 Error Calculator (GEC) software, which implements a previously validated method to calculate the threshold for statistical significance required to control the genome-wide type 1 error rate at 0.05,63 1.77 × 10⁻⁶ was obtained as significance threshold for our study. Hence, with this criterion, PTPN22 rs2476601 would represent a confirmed associated variant in GCA. This same genetic variant was recently identified by our group as a susceptibility factor for this type of vasculitis through a candidate gene strategy, via using a GCA sample collection that partially overlaps (48%) with the one analyzed here.39 Therefore, this study confirms PTPN22 as the non-HLA gene with greatest effect susceptibility to GCA described to date, as it occurs in RA.64
Regarding REL, it should be noted that rs115674477 appears as an isolated singleton in our study. Considering its low frequency (MAF < 0.03), reasonable doubts might arise about the reliability of this association. However, the consistency of the effect sizes observed for this SNP across the different populations suggests that it might represent a real association signal. REL encodes a member of the NF-κB family of transcription factors known as c-Rel, which is involved in T cell and antigen-presenting cell function.65 It has been demonstrated that c-Rel regulates the expression of the Th1-cell-promoting cytokine IL-12 and the Th17-cell-promoting cytokine IL-23 in dendritic cells and macrophages, respectively.66,67 Furthermore, c-Rel is also required for the expression of FoxP3, a master regulator in the development and function of regulatory T (Treg) cells.68,69 Interestingly, the second non-HLA hit in our study, LRRC32 (also known as glycoprotein A repetition predominant protein [GARP]), is highly expressed in activated Treg cells and it could also control the expression of FoxP3.70,71 It has been reported that the surface localization of LRRC32 alters the surface expression of T cell activation markers and that LRRC32+ Treg cells mediate more suppressive signals than LRRC32− Treg cells.72 Genetic variants of LRRC32 have been associated through genome-wide association studies with UC, atopic dermatitis, and allergic rhinitis (MIM 607154).73–75 In UC and allergic rhinitis, the associated variant corresponded with rs215521,73,75 one of the two linked LRRC32 SNPs that are more significantly associated with GCA in our study. Considering that current knowledge points to Th1, Th17, and Treg cells, together with dendritic cells and macrophages, as the most relevant cell types in GCA pathophysiology,76,77 we propose that both LRRC32 and REL might represent true risk factors for this type of vasculitis, albeit not reaching the genome-wide level of significance.
In summary, through a comprehensive screening of immune loci, we have derived a testable model of different HLA amino acid positions (HLA-DRβ1 13, HLA-DQα1 47, 56, 76, and HLA-B 45) that explains most of the HLA association with GCA. However, it is important to note that, despite the clear biological implication of our model, there was insufficient statistical power in the current dataset to definitively confirm these positions as the true causal drivers of the HLA association with GCA, considering the high level of LD within this genomic region. Consequently, it should be tested in future studies.
Additionally, our data implicate other putative susceptibility genes outside the HLA region, such as PTPN22, LRRC32, and REL, which encode key proteins involved in T cell function. Further collaborative efforts are necessary to increase the sample size of the current GCA cohorts and to definitively confirm these loci at the genome-wide level of significance. Replication of our findings in independent GCA cohorts with greater statistical power and functional studies confirming the involvement of the proposed variants in the disease pathophysiology would also be desirable to substantiate them.
Consortia
The members of the Spanish GCA Group are Agustín Martínez-Berriochoa, Ainhoa Unzurrunzaga, Ana Hidalgo-Conde, Ana B. Madroñero-Vuelta, Antonio Fernández-Nebro, M. Carmen Ordóñez-Cañizares, Begoña Escalante, Begoña Marí-Alfonso, Bernardo Sopeña, César Magro, Enrique Raya, Elena Grau, José A. Román, Eugenio de Miguel, F. Javier López-Longo, Lina Martínez, Carmen Gómez-Vaquero, Benjamín Fernández-Gutiérrez, Luis Rodríguez-Rodríguez, J. Bernardino Díaz-López, Luis Caminal-Montero, Aleida Martínez-Zapico, Jordi Monfort, Laura Tío, Julio Sánchez-Martín, Juan J. Alegre-Sancho, Luis Sáez-Comet, Mercedes Pérez-Conesa, Marc Corbera-Bellalta, M. Jesús García-Villanueva, M. Encarnación Fernández-Contreras, Olga Sanchez-Pernaute, Ricardo Blanco, Norberto Ortego-Centeno, Raquel Ríos-Fernández, José L. Callejas, Patricia Fanlo-Mateo, and Víctor M. Martínez-Taboada.
Acknowledgments
The authors thank Sofía Vargas, Sonia García, Gema Robledo, Steve Martin, Lubna-Haroon Raashid, and Edward Flynn for their excellent technical assistance and the participants for kindly accepting their collaboration. Steve Rich, Stephen Suna Onengut-Gumuscu, and Wei-Min Chen are thanked for genotyping and quality control. Marta Conde-Jaldón is thanked for assisting in HLA typing. The Norwegian Systemic Vasculitis and Connective Tissue Disease Registry (NOSVAR) at Oslo University Hospital is acknowledged for providing data on the Norwegian cases. F.D.C., J.M., and M.A.G.-G. were supported by Instituto de Salud Carlos III (ISCIII), Spain, through the RETICS Program RD12/0009/0004 (RIER). M.C.C., J.H.-R., and S.P.-G. were supported by Ministerio de Economía y Competitividad, Spain (SAF 11/30073). S.L.M. received grant funding from Research into Ageing, a Wellcome Trust/AMS Starter Grant for Clinical Lecturers, the Leeds Teaching Hospitals Charitable Trustees, and the Mason Medical Research Foundation and is funded by a NIH Research Clinician Scientist Award. A.W.M., J.H.B., and J.C.T. were supported by the NIHR-Leeds Musculoskeletal Biomedical Research Unit and the Ann Wilks Memorial Fund. The Vasculitis Clinical Research Consortium (VCRC) received support from the United States National Institute of Arthritis and Musculoskeletal and Skin Diseases (U54AR057319), the National Center for Research Resources (U54 RR019497), the Office of Rare Diseases Research, and the National Center for Advancing Translational Science. The VCRC is part of the Rare Diseases Clinical Research Network (RDCRN). A.P.D. was funded by Agder Medforsk (non-profit research organization stationed in Southern Norway). T.W. was funded by the grant DFG KFO TP03.
Published: March 26, 2015
Contributor Information
F. David Carmona, Email: dcarmona@ipb.csic.es.
Spanish GCA Group:
Agustín Martínez-Berriochoa, Ainhoa Unzurrunzaga, Ana Hidalgo-Conde, Ana B. Madroñero-Vuelta, Antonio Fernández-Nebro, M. Carmen Ordóñez-Cañizares, Begoña Escalante, Begoña Marí-Alfonso, Bernardo Sopeña, César Magro, Enrique Raya, Elena Grau, José A. Román, Eugenio de Miguel, F. Javier López-Longo, Lina Martínez, Carmen Gómez-Vaquero, Benjamín Fernández-Gutiérrez, Luis Rodríguez-Rodríguez, J. Bernardino Díaz-López, Luis Caminal-Montero, Aleida Martínez-Zapico, Jordi Monfort, Laura Tío, Julio Sánchez-Martín, Juan J. Alegre-Sancho, Luis Sáez-Comet, Mercedes Pérez-Conesa, Marc Corbera-Bellalta, M. Jesús García-Villanueva, M. Encarnación Fernández-Contreras, Olga Sanchez-Pernaute, Ricardo Blanco, Norberto Ortego-Centeno, Raquel Ríos-Fernández, José L. Callejas, Patricia Fanlo-Mateo, and Víctor M. Martínez-Taboada
Supplemental Data
Web Resources
The URLs for data presented herein are as follows:
1000 Genomes, http://browser.1000genomes.org
BEAGLE, http://faculty.washington.edu/browning/beagle/beagle.html
CaTS – Power Calculator, http://csg.sph.umich.edu/abecasis/CaTS/
GEC: Genetic Type I Error Calculator, http://statgenpro.psychiatry.hku.hk/gec/
Getting Genetics Done, http://www.gettinggeneticsdone.com/2011/04/annotated-manhattan-plots-and-qq-plots.html
HLA Nomenclature, http://hla.alleles.org/
IMPUTE2, http://mathgen.stats.ox.ac.uk/impute/impute_v2.html
International HapMap Project, http://hapmap.ncbi.nlm.nih.gov/
LocusZoom, http://csg.sph.umich.edu/locuszoom/
OMIM, http://www.omim.org/
R statistical software, http://www.r-project.org/
RegulomeDB, http://regulome.stanford.edu/
UCSF Chimera, http://www.cgl.ucsf.edu/chimera/
References
- 1.Jennette J.C., Falk R.J., Bacon P.A., Basu N., Cid M.C., Ferrario F., Flores-Suarez L.F., Gross W.L., Guillevin L., Hagen E.C. 2012 revised International Chapel Hill Consensus Conference Nomenclature of Vasculitides. Arthritis Rheum. 2013;65:1–11. doi: 10.1002/art.37715. [DOI] [PubMed] [Google Scholar]
- 2.Gonzalez-Gay M.A., Vazquez-Rodriguez T.R., Lopez-Diaz M.J., Miranda-Filloy J.A., Gonzalez-Juanatey C., Martin J., Llorca J. Epidemiology of giant cell arteritis and polymyalgia rheumatica. Arthritis Rheum. 2009;61:1454–1461. doi: 10.1002/art.24459. [DOI] [PubMed] [Google Scholar]
- 3.González-Gay M.A., Blanco R., Rodríguez-Valverde V., Martínez-Taboada V.M., Delgado-Rodriguez M., Figueroa M., Uriarte E. Permanent visual loss and cerebrovascular accidents in giant cell arteritis: predictors and response to treatment. Arthritis Rheum. 1998;41:1497–1504. doi: 10.1002/1529-0131(199808)41:8<1497::AID-ART22>3.0.CO;2-Z. [DOI] [PubMed] [Google Scholar]
- 4.Ly K.H., Régent A., Tamby M.C., Mouthon L. Pathogenesis of giant cell arteritis: More than just an inflammatory condition? Autoimmun. Rev. 2010;9:635–645. doi: 10.1016/j.autrev.2010.05.002. [DOI] [PubMed] [Google Scholar]
- 5.Carmona F.D., González-Gay M.A., Martín J. Genetic component of giant cell arteritis. Rheumatology (Oxford) 2014;53:6–18. doi: 10.1093/rheumatology/ket231. [DOI] [PubMed] [Google Scholar]
- 6.Cortes A., Brown M.A. Promise and pitfalls of the Immunochip. Arthritis Res. Ther. 2011;13:101. doi: 10.1186/ar3204. [DOI] [PMC free article] [PubMed] [Google Scholar]
- 7.Saruhan-Direskeneli G., Hughes T., Aksu K., Keser G., Coit P., Aydin S.Z., Alibaz-Oner F., Kamalı S., Inanc M., Carette S. Identification of multiple genetic susceptibility loci in Takayasu arteritis. Am. J. Hum. Genet. 2013;93:298–305. doi: 10.1016/j.ajhg.2013.05.026. [DOI] [PMC free article] [PubMed] [Google Scholar]
- 8.Trynka G., Hunt K.A., Bockett N.A., Romanos J., Mistry V., Szperl A., Bakker S.F., Bardella M.T., Bhaw-Rosun L., Castillejo G., Spanish Consortium on the Genetics of Coeliac Disease (CEGEC) PreventCD Study Group. Wellcome Trust Case Control Consortium (WTCCC) Dense genotyping identifies and localizes multiple common and rare variant association signals in celiac disease. Nat. Genet. 2011;43:1193–1201. doi: 10.1038/ng.998. [DOI] [PMC free article] [PubMed] [Google Scholar]
- 9.Eyre S., Bowes J., Diogo D., Lee A., Barton A., Martin P., Zhernakova A., Stahl E., Viatte S., McAllister K., Biologics in Rheumatoid Arthritis Genetics and Genomics Study Syndicate. Wellcome Trust Case Control Consortium High-density genetic mapping identifies new susceptibility loci for rheumatoid arthritis. Nat. Genet. 2012;44:1336–1340. doi: 10.1038/ng.2462. [DOI] [PMC free article] [PubMed] [Google Scholar]
- 10.Cooper J.D., Simmonds M.J., Walker N.M., Burren O., Brand O.J., Guo H., Wallace C., Stevens H., Coleman G., Franklyn J.A., Wellcome Trust Case Control Consortium Seven newly identified loci for autoimmune thyroid disease. Hum. Mol. Genet. 2012;21:5202–5208. doi: 10.1093/hmg/dds357. [DOI] [PMC free article] [PubMed] [Google Scholar]
- 11.Tsoi L.C., Spain S.L., Knight J., Ellinghaus E., Stuart P.E., Capon F., Ding J., Li Y., Tejasvi T., Gudjonsson J.E., Collaborative Association Study of Psoriasis (CASP) Genetic Analysis of Psoriasis Consortium. Psoriasis Association Genetics Extension. Wellcome Trust Case Control Consortium 2 Identification of 15 new psoriasis susceptibility loci highlights the role of innate immunity. Nat. Genet. 2012;44:1341–1348. doi: 10.1038/ng.2467. [DOI] [PMC free article] [PubMed] [Google Scholar]
- 12.Liu J.Z., Almarri M.A., Gaffney D.J., Mells G.F., Jostins L., Cordell H.J., Ducker S.J., Day D.B., Heneghan M.A., Neuberger J.M., UK Primary Biliary Cirrhosis (PBC) Consortium. Wellcome Trust Case Control Consortium 3 Dense fine-mapping study identifies new susceptibility loci for primary biliary cirrhosis. Nat. Genet. 2012;44:1137–1141. doi: 10.1038/ng.2395. [DOI] [PMC free article] [PubMed] [Google Scholar]
- 13.Juran B.D., Hirschfield G.M., Invernizzi P., Atkinson E.J., Li Y., Xie G., Kosoy R., Ransom M., Sun Y., Bianchi I., Italian PBC Genetics Study Group Immunochip analyses identify a novel risk locus for primary biliary cirrhosis at 13q14, multiple independent associations at four established risk loci and epistasis between 1p31 and 7q32 risk variants. Hum. Mol. Genet. 2012;21:5209–5221. doi: 10.1093/hmg/dds359. [DOI] [PMC free article] [PubMed] [Google Scholar]
- 14.Hinks A., Cobb J., Marion M.C., Prahalad S., Sudman M., Bowes J., Martin P., Comeau M.E., Sajuthi S., Andrews R., Boston Children’s JIA Registry. British Society of Paediatric and Adolescent Rheumatology (BSPAR) Study Group. Childhood Arthritis Prospective Study (CAPS) Childhood Arthritis Response to Medication Study (CHARMS) German Society for Pediatric Rheumatology (GKJR) JIA Gene Expression Study. NIAMS JIA Genetic Registry. TREAT Study. United Kingdom Juvenile Idiopathic Arthritis Genetics Consortium (UKJIAGC) Dense genotyping of immune-related disease regions identifies 14 new susceptibility loci for juvenile idiopathic arthritis. Nat. Genet. 2013;45:664–669. doi: 10.1038/ng.2614. [DOI] [PMC free article] [PubMed] [Google Scholar]
- 15.Liu J.Z., Hov J.R., Folseraas T., Ellinghaus E., Rushbrook S.M., Doncheva N.T., Andreassen O.A., Weersma R.K., Weismüller T.J., Eksteen B., UK-PSCSC Consortium. International IBD Genetics Consortium. International PSC Study Group Dense genotyping of immune-related disease regions identifies nine new risk loci for primary sclerosing cholangitis. Nat. Genet. 2013;45:670–675. doi: 10.1038/ng.2616. [DOI] [PMC free article] [PubMed] [Google Scholar]
- 16.Faraco J., Lin L., Kornum B.R., Kenny E.E., Trynka G., Einen M., Rico T.J., Lichtner P., Dauvilliers Y., Arnulf I. ImmunoChip study implicates antigen presentation to T cells in narcolepsy. PLoS Genet. 2013;9:e1003270. doi: 10.1371/journal.pgen.1003270. [DOI] [PMC free article] [PubMed] [Google Scholar]
- 17.Cortes A., Hadler J., Pointon J.P., Robinson P.C., Karaderi T., Leo P., Cremin K., Pryce K., Harris J., Lee S., International Genetics of Ankylosing Spondylitis Consortium (IGAS) Australo-Anglo-American Spondyloarthritis Consortium (TASC) Groupe Française d’Etude Génétique des Spondylarthrites (GFEGS) Nord-Trøndelag Health Study (HUNT) Spondyloarthritis Research Consortium of Canada (SPARCC) Wellcome Trust Case Control Consortium 2 (WTCCC2) Identification of multiple risk variants for ankylosing spondylitis through high-density genotyping of immune-related loci. Nat. Genet. 2013;45:730–738. doi: 10.1038/ng.2667. [DOI] [PMC free article] [PubMed] [Google Scholar]
- 18.Ellinghaus D., Baurecht H., Esparza-Gordillo J., Rodríguez E., Matanovic A., Marenholz I., Hübner N., Schaarschmidt H., Novak N., Michel S. High-density genotyping study identifies four new susceptibility loci for atopic dermatitis. Nat. Genet. 2013;45:808–812. doi: 10.1038/ng.2642. [DOI] [PMC free article] [PubMed] [Google Scholar]
- 19.Mayes M.D., Bossini-Castillo L., Gorlova O., Martin J.E., Zhou X., Chen W.V., Assassi S., Ying J., Tan F.K., Arnett F.C., Spanish Scleroderma Group Immunochip analysis identifies multiple susceptibility loci for systemic sclerosis. Am. J. Hum. Genet. 2014;94:47–61. doi: 10.1016/j.ajhg.2013.12.002. [DOI] [PMC free article] [PubMed] [Google Scholar]
- 20.Parkes M., Cortes A., van Heel D.A., Brown M.A. Genetic insights into common pathways and complex relationships among immune-mediated diseases. Nat. Rev. Genet. 2013;14:661–673. doi: 10.1038/nrg3502. [DOI] [PubMed] [Google Scholar]
- 21.Raychaudhuri S., Sandor C., Stahl E.A., Freudenberg J., Lee H.S., Jia X., Alfredsson L., Padyukov L., Klareskog L., Worthington J. Five amino acids in three HLA proteins explain most of the association between MHC and seropositive rheumatoid arthritis. Nat. Genet. 2012;44:291–296. doi: 10.1038/ng.1076. [DOI] [PMC free article] [PubMed] [Google Scholar]
- 22.Jia X., Han B., Onengut-Gumuscu S., Chen W.M., Concannon P.J., Rich S.S., Raychaudhuri S., de Bakker P.I. Imputing amino acid polymorphisms in human leukocyte antigens. PLoS ONE. 2013;8:e64683. doi: 10.1371/journal.pone.0064683. [DOI] [PMC free article] [PubMed] [Google Scholar]
- 23.Hunder G.G., Bloch D.A., Michel B.A., Stevens M.B., Arend W.P., Calabrese L.H., Edworthy S.M., Fauci A.S., Leavitt R.Y., Lie J.T. The American College of Rheumatology 1990 criteria for the classification of giant cell arteritis. Arthritis Rheum. 1990;33:1122–1128. doi: 10.1002/art.1780330810. [DOI] [PubMed] [Google Scholar]
- 24.Purcell S., Neale B., Todd-Brown K., Thomas L., Ferreira M.A., Bender D., Maller J., Sklar P., de Bakker P.I., Daly M.J., Sham P.C. PLINK: a tool set for whole-genome association and population-based linkage analyses. Am. J. Hum. Genet. 2007;81:559–575. doi: 10.1086/519795. [DOI] [PMC free article] [PubMed] [Google Scholar]
- 25.Horton R., Wilming L., Rand V., Lovering R.C., Bruford E.A., Khodiyar V.K., Lush M.J., Povey S., Talbot C.C., Jr., Wright M.W. Gene map of the extended human MHC. Nat. Rev. Genet. 2004;5:889–899. doi: 10.1038/nrg1489. [DOI] [PubMed] [Google Scholar]
- 26.Browning B.L., Browning S.R. A unified approach to genotype imputation and haplotype-phase inference for large data sets of trios and unrelated individuals. Am. J. Hum. Genet. 2009;84:210–223. doi: 10.1016/j.ajhg.2009.01.005. [DOI] [PMC free article] [PubMed] [Google Scholar]
- 27.Brown W.M., Pierce J., Hilner J.E., Perdue L.H., Lohman K., Li L., Venkatesh R.B., Hunt S., Mychaleckyj J.C., Deloukas P., Type 1 Diabetes Genetics Consortium Overview of the MHC fine mapping data. Diabetes Obes. Metab. 2009;11(1):2–7. doi: 10.1111/j.1463-1326.2008.00997.x. [DOI] [PMC free article] [PubMed] [Google Scholar]
- 28.de Bakker P.I., McVean G., Sabeti P.C., Miretti M.M., Green T., Marchini J., Ke X., Monsuur A.J., Whittaker P., Delgado M. A high-resolution HLA and SNP haplotype map for disease association studies in the extended human MHC. Nat. Genet. 2006;38:1166–1172. doi: 10.1038/ng1885. [DOI] [PMC free article] [PubMed] [Google Scholar]
- 29.Howie B.N., Donnelly P., Marchini J. A flexible and accurate genotype imputation method for the next generation of genome-wide association studies. PLoS Genet. 2009;5:e1000529. doi: 10.1371/journal.pgen.1000529. [DOI] [PMC free article] [PubMed] [Google Scholar]
- 30.Abecasis G.R., Altshuler D., Auton A., Brooks L.D., Durbin R.M., Gibbs R.A., Hurles M.E., McVean G.A., 1000 Genomes Project Consortium A map of human genome variation from population-scale sequencing. Nature. 2010;467:1061–1073. doi: 10.1038/nature09534. [DOI] [PMC free article] [PubMed] [Google Scholar]
- 31.Skol A.D., Scott L.J., Abecasis G.R., Boehnke M. Joint analysis is more efficient than replication-based analysis for two-stage genome-wide association studies. Nat. Genet. 2006;38:209–213. doi: 10.1038/ng1706. [DOI] [PubMed] [Google Scholar]
- 32.Pettersen E.F., Goddard T.D., Huang C.C., Couch G.S., Greenblatt D.M., Meng E.C., Ferrin T.E. UCSF Chimera—a visualization system for exploratory research and analysis. J. Comput. Chem. 2004;25:1605–1612. doi: 10.1002/jcc.20084. [DOI] [PubMed] [Google Scholar]
- 33.Pruim R.J., Welch R.P., Sanna S., Teslovich T.M., Chines P.S., Gliedt T.P., Boehnke M., Abecasis G.R., Willer C.J. LocusZoom: regional visualization of genome-wide association scan results. Bioinformatics. 2010;26:2336–2337. doi: 10.1093/bioinformatics/btq419. [DOI] [PMC free article] [PubMed] [Google Scholar]
- 34.Okada Y., Wu D., Trynka G., Raj T., Terao C., Ikari K., Kochi Y., Ohmura K., Suzuki A., Yoshida S., RACI consortium. GARNET consortium Genetics of rheumatoid arthritis contributes to biology and drug discovery. Nature. 2014;506:376–381. doi: 10.1038/nature12873. [DOI] [PMC free article] [PubMed] [Google Scholar]
- 35.Brown J.H., Jardetzky T.S., Gorga J.C., Stern L.J., Urban R.G., Strominger J.L., Wiley D.C. Three-dimensional structure of the human class II histocompatibility antigen HLA-DR1. Nature. 1993;364:33–39. doi: 10.1038/364033a0. [DOI] [PubMed] [Google Scholar]
- 36.Ombrello M.J., Kirino Y., de Bakker P.I., Gül A., Kastner D.L., Remmers E.F. Behçet disease-associated MHC class I residues implicate antigen binding and regulation of cell-mediated cytotoxicity. Proc. Natl. Acad. Sci. USA. 2014;111:8867–8872. doi: 10.1073/pnas.1406575111. [DOI] [PMC free article] [PubMed] [Google Scholar]
- 37.Achkar J.P., Klei L., de Bakker P.I., Bellone G., Rebert N., Scott R., Lu Y., Regueiro M., Brzezinski A., Kamboh M.I. Amino acid position 11 of HLA-DRβ1 is a major determinant of chromosome 6p association with ulcerative colitis. Genes Immun. 2012;13:245–252. doi: 10.1038/gene.2011.79. [DOI] [PMC free article] [PubMed] [Google Scholar]
- 38.Bottini N., Peterson E.J. Tyrosine phosphatase PTPN22: multifunctional regulator of immune signaling, development, and disease. Annu. Rev. Immunol. 2014;32:83–119. doi: 10.1146/annurev-immunol-032713-120249. [DOI] [PMC free article] [PubMed] [Google Scholar]
- 39.Serrano A., Márquez A., Mackie S.L., Carmona F.D., Solans R., Miranda-Filloy J.A., Hernández-Rodríguez J., Cid M.C., Castañeda S., Morado I.C., UK GCA Consortium Spanish GCA Consortium Identification of the PTPN22 functional variant R620W as susceptibility genetic factor for giant cell arteritis. Ann. Rheum. Dis. 2013;72:1882–1886. doi: 10.1136/annrheumdis-2013-203641. [DOI] [PMC free article] [PubMed] [Google Scholar]
- 40.Ricaño-Ponce I., Wijmenga C. Mapping of immune-mediated disease genes. Annu. Rev. Genomics Hum. Genet. 2013;14:325–353. doi: 10.1146/annurev-genom-091212-153450. [DOI] [PubMed] [Google Scholar]
- 41.Gonzalez-Gay M.A., Martinez-Dubois C., Agudo M., Pompei O., Blanco R., Llorca J. Giant cell arteritis: epidemiology, diagnosis, and management. Curr. Rheumatol. Rep. 2010;12:436–442. doi: 10.1007/s11926-010-0135-9. [DOI] [PubMed] [Google Scholar]
- 42.González-Gay M.A., Amoli M.M., Garcia-Porrua C., Ollier W.E. Genetic markers of disease susceptibility and severity in giant cell arteritis and polymyalgia rheumatica. Semin. Arthritis Rheum. 2003;33:38–48. doi: 10.1053/sarh.2002.50025. [DOI] [PubMed] [Google Scholar]
- 43.Rauzy O., Fort M., Nourhashemi F., Alric L., Juchet H., Ecoiffier M., Abbal M., Adoue D. Relation between HLA DRB1 alleles and corticosteroid resistance in giant cell arteritis. Ann. Rheum. Dis. 1998;57:380–382. doi: 10.1136/ard.57.6.380. [DOI] [PMC free article] [PubMed] [Google Scholar]
- 44.González-Gay M.A., García-Porrúa C., Llorca J., Hajeer A.H., Brañas F., Dababneh A., González-Louzao C., Rodriguez-Gil E., Rodríguez-Ledo P., Ollier W.E. Visual manifestations of giant cell arteritis. Trends and clinical spectrum in 161 patients. Medicine (Baltimore) 2000;79:283–292. doi: 10.1097/00005792-200009000-00001. [DOI] [PubMed] [Google Scholar]
- 45.Jacobsen S., Baslund B., Madsen H.O., Tvede N., Svejgaard A., Garred P. Mannose-binding lectin variant alleles and HLA-DR4 alleles are associated with giant cell arteritis. J. Rheumatol. 2002;29:2148–2153. [PubMed] [Google Scholar]
- 46.Weyand C.M., Hunder N.N., Hicok K.C., Hunder G.G., Goronzy J.J. HLA-DRB1 alleles in polymyalgia rheumatica, giant cell arteritis, and rheumatoid arthritis. Arthritis Rheum. 1994;37:514–520. doi: 10.1002/art.1780370411. [DOI] [PubMed] [Google Scholar]
- 47.Dababneh A., Gonzalez-Gay M.A., Garcia-Porrua C., Hajeer A., Thomson W., Ollier W. Giant cell arteritis and polymyalgia rheumatica can be differentiated by distinct patterns of HLA class II association. J. Rheumatol. 1998;25:2140–2145. [PubMed] [Google Scholar]
- 48.Cid M.C., Ercilla G., Vilaseca J., Sanmarti R., Villalta J., Ingelmo M., Urbano-Marquez A. Polymyalgia rheumatica: a syndrome associated with HLA-DR4 antigen. Arthritis Rheum. 1988;31:678–682. doi: 10.1002/art.1780310515. [DOI] [PubMed] [Google Scholar]
- 49.Weyand C.M., Hicok K.C., Hunder G.G., Goronzy J.J. The HLA-DRB1 locus as a genetic component in giant cell arteritis. Mapping of a disease-linked sequence motif to the antigen binding site of the HLA-DR molecule. J. Clin. Invest. 1992;90:2355–2361. doi: 10.1172/JCI116125. [DOI] [PMC free article] [PubMed] [Google Scholar]
- 50.Weyand C.M., Goronzy J.J. Immune mechanisms in medium and large-vessel vasculitis. Nat Rev Rheumatol. 2013;9:731–740. doi: 10.1038/nrrheum.2013.161. [DOI] [PMC free article] [PubMed] [Google Scholar]
- 51.Bossini-Castillo L., de Kovel C., Kallberg H., van ’t Slot R., Italiaander A., Coenen M., Tak P.P., Posthumus M.D., Wijmenga C., Huizinga T., LifeLines Cohort Study A genome-wide association study of rheumatoid arthritis without antibodies against citrullinated peptides. Ann. Rheum. Dis. 2015;74:e15. doi: 10.1136/annrheumdis-2013-204591. [DOI] [PubMed] [Google Scholar]
- 52.Tollefsen S., Hotta K., Chen X., Simonsen B., Swaminathan K., Mathews I.I., Sollid L.M., Kim C.Y. Structural and functional studies of trans-encoded HLA-DQ2.3 (DQA1∗03:01/DQB1∗02:01) protein molecule. J. Biol. Chem. 2012;287:13611–13619. doi: 10.1074/jbc.M111.320374. [DOI] [PMC free article] [PubMed] [Google Scholar]
- 53.Røder G., Blicher T., Justesen S., Johannesen B., Kristensen O., Kastrup J., Buus S., Gajhede M. Crystal structures of two peptide-HLA-B∗1501 complexes; structural characterization of the HLA-B62 supertype. Acta Crystallogr. D Biol. Crystallogr. 2006;62:1300–1310. doi: 10.1107/S0907444906027636. [DOI] [PubMed] [Google Scholar]
- 54.Badrinath S., Huyton T., Schumacher H., Blasczyk R., Bade-Doeding C. Position 45 influences the peptide binding motif of HLA-B∗44:08. Immunogenetics. 2012;64:245–249. doi: 10.1007/s00251-011-0583-z. [DOI] [PubMed] [Google Scholar]
- 55.O’Brien S.J., Gao X., Carrington M. HLA and AIDS: a cautionary tale. Trends Mol. Med. 2001;7:379–381. doi: 10.1016/s1471-4914(01)02131-1. [DOI] [PubMed] [Google Scholar]
- 56.Morris D.L., Taylor K.E., Fernando M.M., Nititham J., Alarcón-Riquelme M.E., Barcellos L.F., Behrens T.W., Cotsapas C., Gaffney P.M., Graham R.R., International MHC and Autoimmunity Genetics Network. Systemic Lupus Erythematosus Genetics Consortium Unraveling multiple MHC gene associations with systemic lupus erythematosus: model choice indicates a role for HLA alleles and non-HLA genes in Europeans. Am. J. Hum. Genet. 2012;91:778–793. doi: 10.1016/j.ajhg.2012.08.026. [DOI] [PMC free article] [PubMed] [Google Scholar]
- 57.van der Heide A., Verduijn W., Haasnoot G.W., Drabbels J.J., Lammers G.J., Claas F.H. HLA dosage effect in narcolepsy with cataplexy. Immunogenetics. 2015;67:1–6. doi: 10.1007/s00251-014-0808-z. [DOI] [PubMed] [Google Scholar]
- 58.Begovich A.B., Carlton V.E., Honigberg L.A., Schrodi S.J., Chokkalingam A.P., Alexander H.C., Ardlie K.G., Huang Q., Smith A.M., Spoerke J.M. A missense single-nucleotide polymorphism in a gene encoding a protein tyrosine phosphatase (PTPN22) is associated with rheumatoid arthritis. Am. J. Hum. Genet. 2004;75:330–337. doi: 10.1086/422827. [DOI] [PMC free article] [PubMed] [Google Scholar]
- 59.Gregersen P.K., Amos C.I., Lee A.T., Lu Y., Remmers E.F., Kastner D.L., Seldin M.F., Criswell L.A., Plenge R.M., Holers V.M. REL, encoding a member of the NF-kappaB family of transcription factors, is a newly defined risk locus for rheumatoid arthritis. Nat. Genet. 2009;41:820–823. doi: 10.1038/ng.395. [DOI] [PMC free article] [PubMed] [Google Scholar]
- 60.Raychaudhuri S., Remmers E.F., Lee A.T., Hackett R., Guiducci C., Burtt N.P., Gianniny L., Korman B.D., Padyukov L., Kurreeman F.A. Common variants at CD40 and other loci confer risk of rheumatoid arthritis. Nat. Genet. 2008;40:1216–1223. doi: 10.1038/ng.233. [DOI] [PMC free article] [PubMed] [Google Scholar]
- 61.Zhang J., Zahir N., Jiang Q., Miliotis H., Heyraud S., Meng X., Dong B., Xie G., Qiu F., Hao Z. The autoimmune disease-associated PTPN22 variant promotes calpain-mediated Lyp/Pep degradation associated with lymphocyte and dendritic cell hyperresponsiveness. Nat. Genet. 2011;43:902–907. doi: 10.1038/ng.904. [DOI] [PubMed] [Google Scholar]
- 62.Sham P.C., Purcell S.M. Statistical power and significance testing in large-scale genetic studies. Nat. Rev. Genet. 2014;15:335–346. doi: 10.1038/nrg3706. [DOI] [PubMed] [Google Scholar]
- 63.Li M.X., Yeung J.M., Cherny S.S., Sham P.C. Evaluating the effective numbers of independent tests and significant p-value thresholds in commercial genotyping arrays and public imputation reference datasets. Hum. Genet. 2012;131:747–756. doi: 10.1007/s00439-011-1118-2. [DOI] [PMC free article] [PubMed] [Google Scholar]
- 64.Viatte S., Plant D., Raychaudhuri S. Genetics and epigenetics of rheumatoid arthritis. Nat Rev Rheumatol. 2013;9:141–153. doi: 10.1038/nrrheum.2012.237. [DOI] [PMC free article] [PubMed] [Google Scholar]
- 65.Hayden M.S., West A.P., Ghosh S. NF-kappaB and the immune response. Oncogene. 2006;25:6758–6780. doi: 10.1038/sj.onc.1209943. [DOI] [PubMed] [Google Scholar]
- 66.Mise-Omata S., Kuroda E., Niikura J., Yamashita U., Obata Y., Doi T.S. A proximal kappaB site in the IL-23 p19 promoter is responsible for RelA- and c-Rel-dependent transcription. J. Immunol. 2007;179:6596–6603. doi: 10.4049/jimmunol.179.10.6596. [DOI] [PubMed] [Google Scholar]
- 67.Grumont R., Hochrein H., O’Keeffe M., Gugasyan R., White C., Caminschi I., Cook W., Gerondakis S. c-Rel regulates interleukin 12 p70 expression in CD8(+) dendritic cells by specifically inducing p35 gene transcription. J. Exp. Med. 2001;194:1021–1032. doi: 10.1084/jem.194.8.1021. [DOI] [PMC free article] [PubMed] [Google Scholar]
- 68.Zhang L., Zhao Y. The regulation of Foxp3 expression in regulatory CD4(+)CD25(+)T cells: multiple pathways on the road. J. Cell. Physiol. 2007;211:590–597. doi: 10.1002/jcp.21001. [DOI] [PubMed] [Google Scholar]
- 69.Lio C.W., Hsieh C.S. Becoming self-aware: the thymic education of regulatory T cells. Curr. Opin. Immunol. 2011;23:213–219. doi: 10.1016/j.coi.2010.11.010. [DOI] [PMC free article] [PubMed] [Google Scholar]
- 70.Wang R., Wan Q., Kozhaya L., Fujii H., Unutmaz D. Identification of a regulatory T cell specific cell surface molecule that mediates suppressive signals and induces Foxp3 expression. PLoS ONE. 2008;3:e2705. doi: 10.1371/journal.pone.0002705. [DOI] [PMC free article] [PubMed] [Google Scholar]
- 71.Wang R., Kozhaya L., Mercer F., Khaitan A., Fujii H., Unutmaz D. Expression of GARP selectively identifies activated human FOXP3+ regulatory T cells. Proc. Natl. Acad. Sci. USA. 2009;106:13439–13444. doi: 10.1073/pnas.0901965106. [DOI] [PMC free article] [PubMed] [Google Scholar]
- 72.Chan D.V., Somani A.K., Young A.B., Massari J.V., Ohtola J., Sugiyama H., Garaczi E., Babineau D., Cooper K.D., McCormick T.S. Signal peptide cleavage is essential for surface expression of a regulatory T cell surface protein, leucine rich repeat containing 32 (LRRC32) BMC Biochem. 2011;12:27. doi: 10.1186/1471-2091-12-27. [DOI] [PMC free article] [PubMed] [Google Scholar]
- 73.Anderson C.A., Boucher G., Lees C.W., Franke A., D’Amato M., Taylor K.D., Lee J.C., Goyette P., Imielinski M., Latiano A. Meta-analysis identifies 29 additional ulcerative colitis risk loci, increasing the number of confirmed associations to 47. Nat. Genet. 2011;43:246–252. doi: 10.1038/ng.764. [DOI] [PMC free article] [PubMed] [Google Scholar]
- 74.Esparza-Gordillo J., Weidinger S., Fölster-Holst R., Bauerfeind A., Ruschendorf F., Patone G., Rohde K., Marenholz I., Schulz F., Kerscher T. A common variant on chromosome 11q13 is associated with atopic dermatitis. Nat. Genet. 2009;41:596–601. doi: 10.1038/ng.347. [DOI] [PubMed] [Google Scholar]
- 75.Ramasamy A., Curjuric I., Coin L.J., Kumar A., McArdle W.L., Imboden M., Leynaert B., Kogevinas M., Schmid-Grendelmeier P., Pekkanen J. A genome-wide meta-analysis of genetic variants associated with allergic rhinitis and grass sensitization and their interaction with birth order. J. Allergy Clin. Immunol. 2011;128:996–1005. doi: 10.1016/j.jaci.2011.08.030. [DOI] [PubMed] [Google Scholar]
- 76.Samson M., Audia S., Fraszczak J., Trad M., Ornetti P., Lakomy D., Ciudad M., Leguy V., Berthier S., Vinit J. Th1 and Th17 lymphocytes expressing CD161 are implicated in giant cell arteritis and polymyalgia rheumatica pathogenesis. Arthritis Rheum. 2012;64:3788–3798. doi: 10.1002/art.34647. [DOI] [PubMed] [Google Scholar]
- 77.Espígol-Frigolé G., Corbera-Bellalta M., Planas-Rigol E., Lozano E., Segarra M., García-Martínez A., Prieto-González S., Hernández-Rodríguez J., Grau J.M., Rahman M.U., Cid M.C. Increased IL-17A expression in temporal artery lesions is a predictor of sustained response to glucocorticoid treatment in patients with giant-cell arteritis. Ann. Rheum. Dis. 2013;72:1481–1487. doi: 10.1136/annrheumdis-2012-201836. [DOI] [PubMed] [Google Scholar]
Associated Data
This section collects any data citations, data availability statements, or supplementary materials included in this article.