Abstract
Supported lipid bilayers are used as a convenient model cell membrane system to study biologically important molecule-lipid interactions in situ. However, the lipid bilayer models are often simple and the acquired results with these models may not provide all pertinent information related to a real cell membrane. In this work, we use sum frequency generation (SFG) vibrational spectroscopy to study molecular-level interactions between the antimicrobial peptides (AMPs) MSI-594, ovispirin-1 G18, magainin 2 and a simple 1,2-dipalmitoyl-d62-sn-glycero-3-phosphoglycerol (dDPPG)-1-palmitoyl-2-oleoyl-sn-glycero-3-phosphoglycerol (POPG) bilayer. We compared such interactions to those between the AMPs and a more complex dDPPG/E. coli polar lipid extract bilayer. We show that to fully understand more complex aspects of peptide-bilayer interaction, such as interaction kinetics, a heterogeneous lipid composition is required, such as the E. coli polar lipid extract. The discrepancy in peptide-bilayer interaction is likely due in part to the difference in bilayer charge between the two systems since highly negative charged lipids can promote more favorable electrostatic interactions between the peptide and lipid bilayer. Results presented in this paper indicate that more complex model bilayers are needed to accurately analyze peptide-cell membrane interactions and demonstrates the importance of using an appropriate lipid composition to study AMP interaction properties.
Keywords: antimicrobial peptide, sum frequency generation, vibrational spectroscopy, peptide-lipid interactions, Bacterial cell, membrane mimetics
1. Introduction
The emergence of antibiotic resistance is becoming an increasing global concern as antibiotic use has become more widespread in medical settings. Gaining the ability to expel drug molecules [1, 2], changing the target cellular molecule rendering it unrecognizable by drug molecules [3, 4], and altering the drug molecule itself are examples of mechanisms through which bacteria become resistant [5–9]. As a result, many bacterial infections that were relatively easy to treat have become difficult and expensive to combat and cure. This problem can extend beyond the patient and potentially increases the likelihood of further spreading such an infection. Because of these issues, there has been a concerted effort to find new and better alternatives to conventional antibiotics, including antimicrobial peptides [10].
Many antimicrobial peptides (AMPs) have broad spectrum effectiveness, often due to the fact that the mechanism of bacterial destruction targets the cell membrane rather than specific receptors or membrane proteins [10, 11]. It is believed that the bacteria cannot alter their fundamental membrane lipid composition as easily as other targets and thus do not easily develop a resistance to AMPs [10, 12–14]. Therefore, it is of great interest to study how AMPs interact with bacterial cell membranes and how they function as antimicrobials so we can develop therapies based on their natural mode of action and effectiveness.
Ideally, the best situation to study the direct interaction of AMPs with bacterial cell membranes would be to perform studies on live bacteria. However, working with live bacteria for the purpose of investigating peptide interactions is complex and time consuming. As a result, using model bacterial cell membranes composed of mixtures of lipids and other membrane constituents is considered an easier and viable alternative [15]. The complexity of these model bilayers can be customized based on the experiment. Many previous studies have used the phospholipid 1-palmitoyl-2-oleoyl-sn-glycero-3-phospho-(1′-rac-glycerol) (POPG) or a mixture of POPG and a zwitterionic lipid, such as 1-palmitoyl-2-oleoyl-sn-glycero-3-phosphocholine (POPC) or 1-palmitoyl-2-oleoyl-sn-glycero-3-phosphoethanolamine (POPE), as a model for the bacterial lipid membrane. These lipids are used because the bacterial membrane is composed of negatively charged and zwitterionic lipids, but mammalian cell membranes are generally zwitterionic. Use of such model membranes enabled our understanding on the role of individual lipid bilayer components on the function of antimicrobial peptides [16, 17] and amyloid peptides [18, 19]. While such investigation have tremendously contributed to various areas of membrane biophysics, it is important to consider a model membrane that would mimic the bacterial cell membrane as much close as possible.
E. coli has been widely used as a model for bacteria and has a plasma membrane that contains PE, PG and cardiolipin as the majority of its lipid composition. The removal of any of these constituents in a model study could impact peptide-bilayer interactions. For example, one study showed that a peptide, aurein 1.2, could heavily disrupt DMPC/DMPG bilayers but there was almost no association or disruption on DMPE/DMPG or E. coli lipid extract bilayers [20]. This difference could be because E. coli lipids contain PE, which has a small head group that is more rigid, more ordered, and is able to form a hydrogen bond, unlike the PC head group [21–24]. Its size and packing geometry causes it to be cone shaped and it has a tendency to form non-lamellar structures [21, 25]. As a result, some peptides can experience differences in potency when in an environment with PE lipids [26–28]. Another study concluded that a particular peptide interacted very similarly with DOPG and DOPE monolayers even though, when exposed to bacterial strains having different amounts of PG lipids, it was less effective against the bacteria with more PG lipids [29]. These examples show that one must use care when choosing the composition of some of the simple models, as subtle differences can lead to changes in how the peptides interact with a membrane and may not be the best predictor of how these peptides might interact with an actual bacterial membrane. To this end, one of the initial NMR studies utilizing the total lipid extracts of E.coli provided insights into the mechanism of action by LL-37 [30].
We have been using sum frequency generation vibrational spectroscopy (SFG) to study the in situ interaction of various membrane active peptides with substrate supported model cell membranes. We have shown that SFG can help deduce cell membrane interaction mechanisms [31] for peptides such as tachyplesin [32], MSI-78 [33], magainin 2 [34], alamethicin [35], pep-1 [36], melittin [37, 38], and ovispirin-1.
In this study, we evaluated multiple well-studied peptides at solid supported model cell membranes, composed of either POPG or E. coli polar lipid extract in the outer leaflet, and determined whether POPG alone could be considered an accurate model for a bacterial cell membrane or if more complex model bilayers are required. In theory, the cell membrane should be better modeled by the E. coli polar lipid extract containing bilayer because it is closer to an actual E. coli membrane’s charge and lipid content. The peptides investigated in this study include MSI-594, ovispirin-1, and magainin 2. MSI-594 is a 24 amino acid peptide with a net charge of +6 and the amino acid sequence is: LLGDFFRKSKEKIGKEFKRIVQRIKDFLRNLVPRTES. It is a hybrid of MSI-78 and melittin and disrupts lipid bilayers through the carpet mechanism for both PC and PG lipids [39]. Ovispirin-1 is another α-helical peptide with a net charge of +7 and the amino acid sequence is: KNLRRIIRKIIHIIKKYG. It is known to generally oriented parallel to the lipid bilayer [40, 41]. Magainin 2 is an α-helical peptide with broad spectrum activity, a net charge of +4 and the amino acid sequence is: GIGKFLHSAKKFGKAFVGEIMNS. Magainin 2 is well studied and is largely thought to act through the toroidal-pore mechanism; being significantly more active towards anionic versus zwitterionic lipids [34, 42–44].
2. Experiment Methods
2.1 Materials
All lipids in this study, including 1-palmitoyl-2-oleoyl-sn-glycero-3-phospho-(1′-rac-glycerol) (POPG), 1,2-dipalmitoyl-d62-sn-glycero-3-[phospho-rac-(1-glycerol)] (dDPPG), and E. coli polar lipid extract, were purchased from Avanti Polar Lipids, Inc. (Alabaster, AL). Ovispirin-1 (with the sequence H2N-KNLRRIIRKIIHIIKKYGCOOH) G18 was synthesized by Peptide 2.0, Inc. (Chantilly, VA). Magainin 2 was purchased from AnaSpec (Fremont, CA). MSI-594 was obtained from the Ramamoorthy group. CaF2 right angle prisms were purchased from Altos Photonics (Bozeman, MT).
2.2 Bilayer Preparation
Bilayers were deposited on CaF2 right angle prisms via the Langmuir-Blodgett and Langmuir-Schaefer (LB/LS) methods for the proximal and distal leaflets, respectively [38]. A KSV2000 LB system from Biolin Scientific (Stockholm, Sweden) was used to construct the inner leaflet and ultrapure water treated by an EMD Millipore Simplicity Water Purification system from EMD Millipore (Billerica, MA) was used throughout the experiments. SFG spectra of the C-H and C-D stretching frequency regions, including the 2880 cm−1 and 2070 cm−1 bands, were taken to ensure bilayer quality.
2.3 SFG Experimental Setup
In depth detail on the theory of SFG, the instrument set up, and data analysis methods have been covered extensively in previous publications and most of the details will not be repeated here [34, 45–59]. During the experiment, a 532 nm visible beam and a frequency tunable (1000–4300 cm−1) IR beam are overlapped spatially and temporally on the bottom of the right angle CaF2 prism which is supporting the lipid bilayer. The experiments were carried out at room temperature (~ 20 °C). The inner leaflet for all experiments was dDPPG, which is in the gel phase at room temperature and was used to minimize the lipid bilayer flip-flop and keep the bilayer asymmetrical. The outer leaflet was either POPG or E. coli polar extract. The bilayer is formed and constantly submerged in a 1.6 mL reservoir to which the peptide is added during the experiment. The peptide concentration in the reservoir was kept constant and homogeneous by using a magnetic micro-stirrer at 100 rpm.
SFG spectra were collected in the C-D stretching frequency range (2000–2300 cm−1) to assess the deuterated inner leaflet and in the C-H/O-H stretching frequency range (2700–4000 cm−1) to assess the hydrogenated outer leaflet before and after peptide addition to the subphase. Additionally, time dependent spectra in this region were taken to monitor the bilayer integrity during the experiment. SFG spectra were also taken in the amide I frequency range (1500–1800 cm−1) in the ssp (s-polarized SFG, s-polarized visible, p-polarized IR) and/or ppp polarizations to help monitor the peptide while interacting with the bilayer. The optical set up was purged with nitrogen during amide I signal collection to reduce the dips in the spectrum resulting from a loss in IR intensity due to water vapor absorbing IR along the optical pathway.
3. Results and Discussion
3.1 MSI-594
3.1.1 SFG Experiments
SFG spectra were obtained in different frequency ranges to monitor or examine the molecular behaviors of different components of the peptide-lipid bilayer interaction system. The C-D, C-H, N-H, and O-H stretching regions were utilized in this study, and the corresponding SFG signals have been assigned previously [60–65]. The 2000–2300 cm−1 frequency range contains a peak of interest for the CD3 symmetric stretch (2070 cm−1) which is used to monitor the deuterated bilayer leaflet containing terminal CD3 groups on the acyl chains. The frequency range from 2700–4000 cm−1 is the C-H/N-H/O-H stretching frequency region which has peaks of interest for the CH3 symmetric stretch (2880 cm−1), the N-H symmetric stretch (3300 cm−1), and water O-H stretches (normally 3200 and 3400 cm−1). There are also peaks such as those at 2940 cm−1 (CH3 Fermi resonance), 2850 cm−1 (CH2 symmetric stretch), and 2920 cm−1 (CH2 asymmetric stretch) in this region.
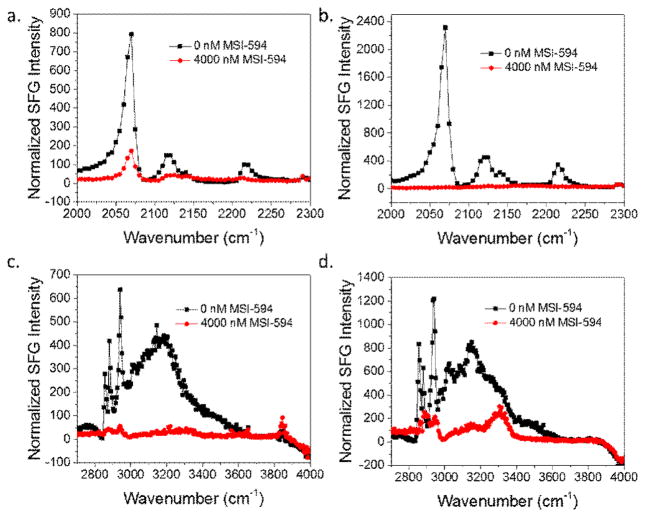
For both bilayers, we can see that there is a significant decrease in signal intensity of the peaks at ~3200, ~2070 cm−1 and 2880 cm−1 after the addition of MSI-594 to the subphase to reach a concentration of 4000 nM (Fig. 1). Note that the y-axes in Fig. 1 are not the same for similar spectral regions and were chosen to allow the easy identification of peaks. The peak at ~3200 cm−1 is from ordered water O-H stretching at the bilayer surface, the peak at 2070 cm−1 is from the terminal CD3 groups of the acyl chain on the inner leaflet, and the 2880 cm−1 peak is from the terminal CH3 on the acyl chains of the outer leaflet. The decrease of the ~3200 cm−1 peak can be associated with charge neutralization at the bilayer interface. Before the addition of the peptides to the subphase, the negatively charged lipid bilayers (for both dDPPG/POPG and dDPPG/E. coli extract) induced order in the water molecules at the interface, thus generating strong O-H stretching signals. After the addition of peptides, the positively charged peptides adsorb to the bilayer and neutralize the charge. As a result, the interfacial water molecules become disordered and the O-H stretching signal decreases. The decrease of the lipid signals at 2070 cm−1 and 2880 cm−1 suggest that there was significant bilayer disruption after the addition of the peptide. Overall, the spectra in Fig. 1 show that the MSI-594 associated with both the POPG and E. coli outer leaflets and both bilayers showed similar disruption after the peptide addition. Both the inner and outer leaflets of the POPG and E. coli containing bilayers suffered from decreased order and/or lipid number after the addition of the peptide, indicating that the peptide penetrated the outer leaflet and was able to interact with the inner leaflet. However, the interaction dynamics are quite different, as can be evidenced by the difference in curve shapes in Fig. 2.
Fig. 1.
SFG spectra collected before (black) and after (red) the addition of MSI-594 to the subphase of (a) dDPPG/POPG bilayer in the C-D stretching frequency range; (b) dDPPG/E. coli polar extract bilayer in the C-D stretching frequency range; (c) dDPPG/ POPG bilayer in the C-H stretching frequency range; (d) dDPPG/E. coli polar extract bilayer in the C-H stretching frequency range.
Fig. 2.
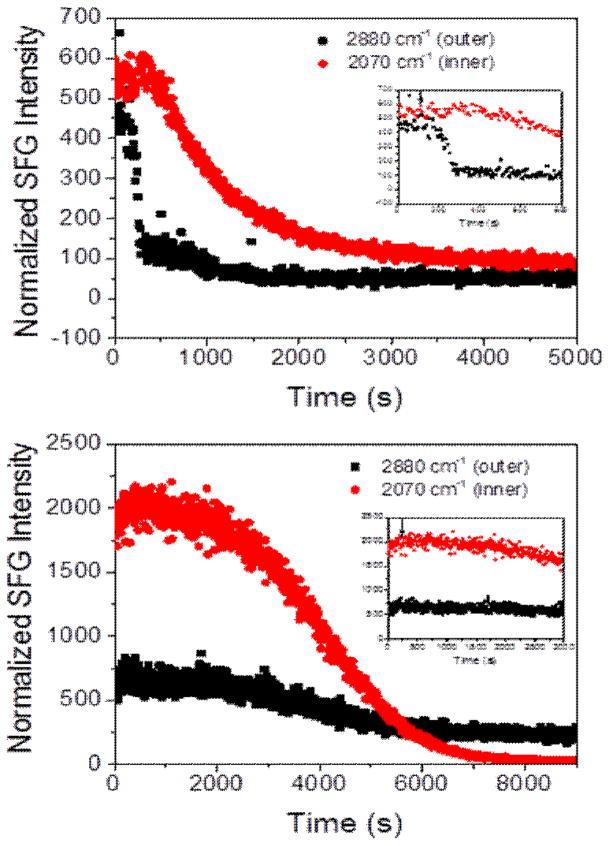
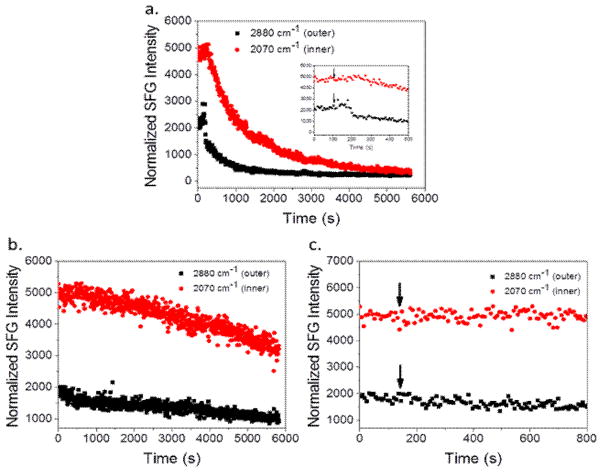
Time-dependent SFG signal observed from the dDPPG/POPG bilayer (top) and the dDPPG/E. coli polar extract bilayer (bottom). The arrow in the insert shows the time when the MSI-594 was added to the lipid bilayer subphase.
Fig. 2 shows the time-dependent interactions of MSI-594 with the dDPPG/POPG lipid bilayer (top) and dDPPG/E. coli polar extract lipid bilayer (bottom). These SFG signals show that from the time of peptide injection, indicated by an arrow on the spectrum inset, until both leaflet signals decrease, behavior is significantly different for the two different model bilayers. For the dDPPG/POPG system, the 2880 cm−1 signal starts to decrease after about 100 s and then decreases very quickly. After the 2880 cm−1 signal for the outer leaflet begins to equilibrate, the 2070 cm−1 signal starts to decrease at a much slower rate. This can be interpreted as the peptide quickly associating to the bilayer and disrupting the outer leaflet before moving to the inner leaflet and causing disruption. Since the SFG signals from the two leaflets exhibit different decreasing kinetics, we believe that the signal decrease is not due to lipid flip-flop. The final signal is sufficiently low enough that it can be considered bilayer destruction. We also see bilayer destruction for the dDPPG/E. coli polar lipid bilayer, but the time dependent interaction is much different. The time from injection to a noticeable decrease in the 2880 cm−1 or 2070 cm−1 signal is in the range of 500–1000 s and is very gradual, indicating that disruption of both bilayers occurred more slowly.
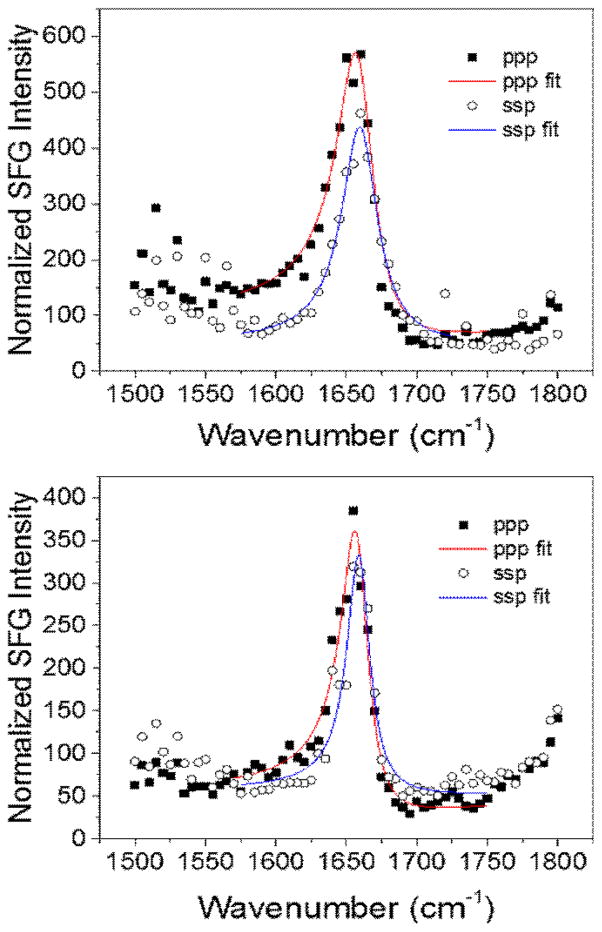
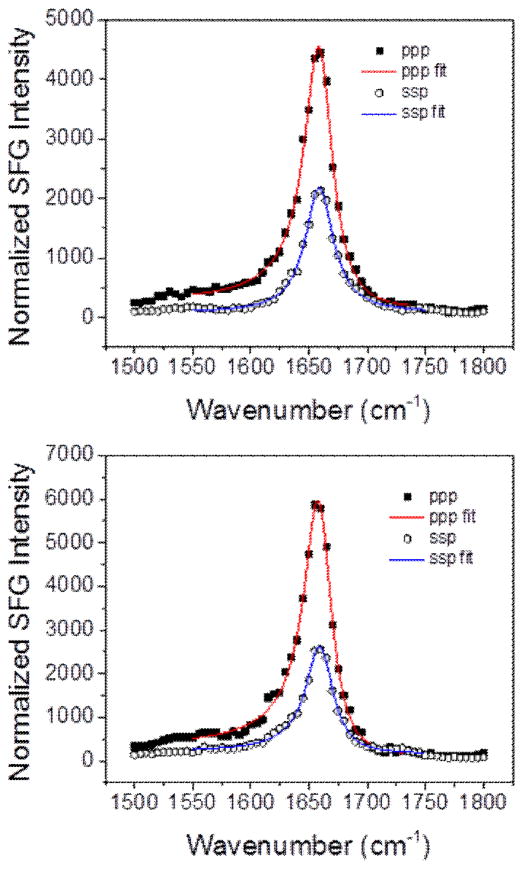
In addition to the lipid bilayer signals, we are able to detect an amide I signal that corresponds to the MSI-594 peptide. The intensity of this peak at ~1655 cm−1 is similar for both bilayers and is further evidence of similar amounts of peptide adsorption on the dDPPG/POPG bilayer relative to the dDPPG/E. coli polar lipid bilayer (Fig. 3). This amide I peak is indicative of the ordered peptide on the bilayer surface. The MSI-594 amide I peak intensities in the ssp and ppp polarized spectra are similar for both lipid bilayers. Furthermore, the ppp/ssp intensity ratios for the two cases are similar. SFG signal intensity is proportional to the square of the number of peptides and is related to the peptide orientation, while the ppp/ssp signal intensity ratio is primarily related to the peptide orientation. For this reason, we believe that MSI-594 molecules associated with two types of lipid bilayers are similar in number and in orientation. Further details about the bilayer associated MSI-594 orientation will be reported in a future article.
Fig. 3.
SFG spectra of Amide I signal from the MSI-594 associated with (top) dDPPG/POPG bilayer and (bottom) dDPPG/E. coli polar extract bilayer.
3.1.3 MSI-594-Bilayer Interaction
A possible explanation for the difference in interaction kinetics can be drawn from the effects from the overall net charge of the bilayer. POPG is a negatively charged lipid that is frequently used to model bacterial membranes because the PG head group is very common in bacterial cell membranes. However, the dDPPG/POPG bilayer is composed only of PG while real cell membranes, like that of E. coli, are composed of other lipids that can reduce the overall negative charge throughout the membrane surface. In particular, the E. coli polar lipid mixture is 67.0 wt/wt% PE, 23.2 wt/wt% PG, and 9.8 wt/wt% cardiolipin, which means that the E. coli polar lipid leaflet is potentially only approximately 1/3 the charge of a POPG leaflet. Due to the discrepancy in the overall charge of the leaflet between the two models, we could expect to see a stronger interaction between the positively charged peptide MSI-594 and the POPG leaflet. This would be evident in a quicker interaction and disruption time, which we observed in our studies.
This lower bilayer charge is the likely factor which led to slower disruption of the dDPPG/E. coli polar lipid bilayer, but this did not protect the bilayer from destruction. This is to be expected, since it has been shown that E. coli is susceptible to MSI-594, as well as other MSI peptides [39, 66–68]. It was reported by Ramamoorthy and coworkers that the minimum inhibitory concentration (MIC) for MSI-594 against E. coli was ~2 μg/ml, which is ~817 nM [39]. Performed leakage assays showed at 1.4 μM, almost 90% of the dye had leaked out of POPC:POPG (3:1) vesicles within 5 min of AMP addition. The short time until cell lysis (5 min) is similar in behavior to our case involving the POPG outer leaflet experiment, but not the E. coli lipid extract one. Our E. coli extract did eventually experience destruction, but it took closer to 20 min, rather than 5 min. This, however, could be because complete membrane destruction is not required for leakage which would make it difficult to compare the two times since it is unknown how much destruction might be required for leakage.
It is possible that the difference in interaction/disruption times we observed for our two model systems is related to an interaction mechanism that took place on the POPG bilayer but not the E. coli bilayer. One possibility is the formation of non-bilayer lipid structures. According to one study, it was proposed that MSI-594 induced some acyl chain disorder on POPG lipids at low concentrations and that most of the lipids were aligned, but at high concentrations non-bilayer lipid structures were formed, such as hexagonal phases [39]. These non-bilayer structures would have occurred quickly after the MSI-594 interacted with the dDPPG/POPG bilayer. In contrast, the E. coli polar leaflet which is lower in anionic charge, would likely be treated more like a zwitterionic POPC leaflet than a POPG leaflet. It was reported from NMR experiments that on POPC lipids, MSI-594 likely acted through the “carpet mechanism” [39]. It has been observed before with other peptides that a mixed bilayer could foster interaction behavior that is essentially in-between, or a mixture, of the interactions that were observed when the peptide was in a bilayer completely composed of only one of the two mixture components [69]. This could be further investigated with other methods such as ATR-FTIR, which is a vibrational spectroscopy that can provide further insight to peptide-membrane interactions.
Furthermore, it has been shown that other MSI peptides have the ability to induce a “charge cluster mechanism” which causes the lipids in the membrane to rearrange such that defects could occur and potentially aid in cell lysis [67]. It is possible that MSI-594 could act through this mechanism as well, and this interaction could take a different amount of time to reorganize the bilayer lipids. This interaction could possibly cause the time dependent spectrum/activity to differ between E. coli polar lipid and pure POPG because of the difference in the lipid bilayer charge distribution.
In summary, we believe that MSI-594 can disrupt both dDPPG/POPG bilayer and dDPPG/E. coli polar extract bilayers. Given a long enough interaction time, both lipid bilayers can likely be completely disrupted or destroyed. The amount of peptide associated and the peptide orientation are not significantly different between the two bilayer systems. However, the disruption kinetics for the dDPPG/POPG bilayer are much faster, perhaps due to the larger negative charge of the bilayer compared to the dDPPG/E. coli polar extract bilayer. Other possibilities are two different disruption methods: the MSI-594 may lie down and cause disorder on zwitterionic lipids and the formation of non-bilayer phases when associated with anionic lipids; or there is a charge cluster mechanism interaction in which the peptide induces the lipid reorganization. For the charge cluster mechanism case, the E. coli polar lipid containing system and the observed SFG signals can be explained by the fact that the peptide does not start causing disorder in the bilayer until the clusters of anionic and zwitterionic lipids form, resulting in a slower interaction time. Therefore, we can conclude that in general, a more biologically-accurate lipid mixture such as E.coli lipid extract is better suited than simpler models to investigate complicated aspects of peptide-membrane interaction, such as accurate disruption kinetics.
3.2 Ovispirin-1 G18
3.2.1 SFG Experiments
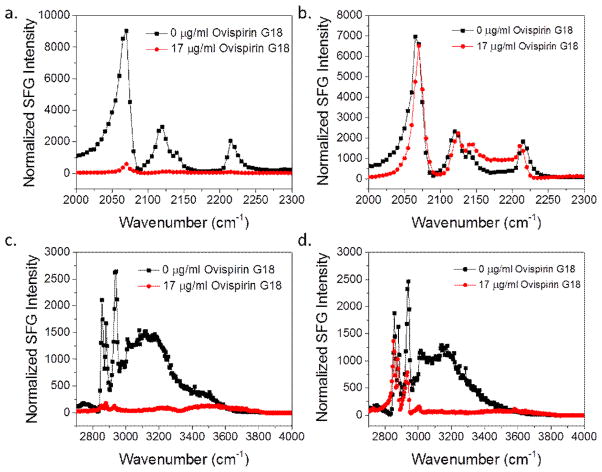
Ovispirin-1 G18 is an alpha helical peptide with an isotope label 13C=O at G18. Fig. 4 shows SFG spectra collected from the C-D and C-H stretching frequency regions of dDPPG/POPG and dDPPG/E. coli polar systems before and after addition of peptide stock solution to achieve 7.5 μM Ovispirin-1 G18. It can be seen that after the addition of peptide to the subphase, the inner and outer leaflets of the dDPPG/POPG system are significantly disrupted as evident from the decrease in the intensity of the CD3 signal at 2070 cm−1 and the CH3 symmetric stretching signal at 2880 cm−1. For the dDPPG/E. coli polar extract bilayer system, the 2880 cm−1 peak from the outer leaflet in contact with the peptide solution only slightly decreased and the signal at 2070 cm−1 from the inner leaflet is nearly the same before and after peptide addition, which suggests that the peptide may only slightly disrupt the outer leaflet and does not interact with the inner leaflet of the bilayer. However, because of the decrease in the water signal at ~3200 cm−1, we can conclude that the peptide is present at the bilayer surface and the lack of change in the CH3 and CD3 signals is not due to the absence of peptide at the dDPPG/E. coli polar extract bilayer.
Fig. 4.
SFG spectra collected before (black) and after (red) the addition of ovispirin-1 G18 to the subphase of (a) dDPPG/POPG bilayer in the C-D stretching frequency range; (b) dDPPG/E. coli polar extract bilayer in the C-D stretching frequency range; (c) dDPPG/ POPG in the C-H stretching frequency range; (d) dDPPG/E. coli polar extract bilayer in the C-H stretching frequency range.
From Fig. 4 we can see that ovispirin-1 G18 does not have the same interaction with the dDPPG/POPG bilayer and the dDPPG/E. coli polar extract bilayers. In addition to the before and after “snapshots” of the lipid bilayers, we also studied the kinetics of the interaction between the two lipid bilayers and the peptide. Fig. 5 shows the time-dependent SFG signal for the 2070 cm−1 and 2880 cm−1 wavenumbers which monitor the signal change of the two lipid bilayers after the addition of ovispirin-1 G18 to the subphase. We can see that the change in the time-dependent SFG signal is very different for the two bilayer systems. After the injection of ovispirin-1 to the subphase to reach a concentration of 7.5 μM for the dDPPG/POPG bilayer, the 2880 cm−1 signal of the POPG outer leaflet drops sharply after ~ 100 s and then decreases more gradually. The 2070 cm−1 signal intensity starts decreasing after the initial drop of the 2880 cm−1 signal and decreases at a similar rate as the 2880 cm−1 signal. This suggests that the peptide quickly associates with the bilayer (initial intensity decrease of the 2880 cm−1signal) followed by a gradual disruption of the bilayer. The rate of C-H and C-D signal decrease is slightly different, which suggests bilayer disruption/destruction and possibly a degree of bilayer flip-flop activity. If the rate of signal decrease was the same for both leaflets, flip-flop would be suspected since lipids from both leaflets moving to the opposing leaflet causes an increase in symmetry for both layers simultaneously. This mechanism would be evident during the time dependent monitoring as the signal dropping at the same rate for both leaflets. The possibility of flip-flop can be further investigated in the future by doing experiments with AFR-FTIR, which is not sensitive to molecule order and would help discern whether the lipids are still present but disordered or were removed.
Fig. 5.
SFG time-dependent signal detected from (a) dDPPG/POPG bilayer, inset is focused on the time period directly before and after the injection of the peptide to the subphase; (b) dDPPG/E. coli polar extract bilayer; (c) dDPPG/E. coli polar extract bilayer zoomed in before and after the injection of ovispirin-1 G18 to the subphase. Peptide injection is indicated by arrow.
The bilayer interaction of ovispirin-1 with the dDPPG/E. coli lipid system is clearly different than with the dDPPG/POPG system. Although the peptide concentration is the same for both systems, there is no sharp drop in the 2880 cm−1 signal intensity after the addition of the peptide to the subphase of the dDPPG/E. coli system and the signal decreases very slowly over the course of hundreds of seconds. Both the 2880 cm−1 and 2070 cm−1 signals drop in intensity so slowly that after 1.5 h they are still similar to the intensities before peptide injection. Since the water signal shown in Fig. 4d decreased substantially, we believe that ovispirin-1 molecules were associated with the dDPPG/E. coli polar extract bilayer, but they interact much more slowly than on dDPPG/POPG and do not cause bilayer disruption. Fig. 4b shows the inner leaflet spectra are similar before and after peptide addition, but the time-dependent C-D stretching signals shown in Fig. 5b decrease. Perhaps this is because the peak center of the ~2070 cm−1 signal shifted slightly (as shown in Fig. 4b) due to the signal changes from the water combinational modes in the lower frequency range, therefore the signal intensity observed at this wavenumber exhibits some time-dependent changes.
We also monitored the ovispirin-1 peptide during the interaction with the bilayers by observing amide I SFG signals. Fig. 6 shows the amide I peak at ~1655 cm−1 which is associated with the peptide backbone. The overall intensity of the amide I signals associated with the two lipid bilayers and the ppp/ssp intensity ratios are similar. This suggests that the number of peptides and peptide order are potentially similar in both cases. This could indicate that while the same number of peptides associated to both bilayers, the more complex leaflet (E. coli polar extract) might require more ovispirin-1 peptides to disrupt the bilayer.
Fig. 6.
SFG spectra of Amide I signal from the ovispirin-1 associated with (top) dDPPG/POPG bilayer and (bottom) dDPPG/E. coli polar extract bilayer.
3.2.3 Ovispirin-1-Bilayer Interaction
Ovispirin-1 is a known potent antimicrobial peptide, but it is also hemolytic and cytotoxic to the point that it is not able to be used for any therapeutics [70, 71]. Even with this being the case, studies have shown the MIC for several bacteria is much lower than the concentration shown to cause hemolysis [70, 71]. Therefore, it is believed that ovispirin-1 is more toxic to bacteria which contain a higher fraction of anionic lipids. From this information, it could be reasonable to suggest that we would expect that ovispirin-1 would associate less with a more neutral lipid bilayer. The MIC for several bacteria are very low (< 10 μg/ml) and given that our concentration used was 17 μg/ml, we had hoped to see severe disruption activity at the E. coli polar extract leaflet. We did not observe complete destruction of the dDPPG/E. coli bilayer as expected. However, we did find the expected trend of ovispirin-1 interacting more with the dDPPG/POPG bilayer versus the dDPPG/E. coli bilayer. Additionally, solid state NMR experiments have elucidated the structure of ovisprin-1 in POPC:POPG (3:1) lipids [41, 71] and 2D IR was used to characterize the structure and location of ovispirin-1 in a POPC:POPG (3:1) environment [40]. In lipid environments, it is generally agreed on that the peptide is residing near the lipid head groups in the bilayer and lying down, parallel to the bilayer and perpendicular to the surface normal [40, 41]. This orientation in the lipid head group region of an environment that containing approximately 25% negatively charged lipids could explain why we see little disruption on the E. coli-containing leaflets. Approximately 33% of the lipids in the E. coli polar lipid mixture are negatively charged and we can predict that the peptide would have a similar orientation in this system.
Furthermore, it is possible that the peptide orientation and interaction mechanism is dependent on the local peptide concentration and could explain the data we observed. Yamaguchi and coworkers mentioned that solid state NMR studies indicated that ovispirin-1 maintains an orientation parallel to the bilayer surface in a 3:1 POPC:POPG lipid environment, even at high peptide/lipid ratios. A “two stage orientation” that is sometime seen in other peptides where they insert into the bilayer at high concentrations was not observed, but it was noted that this could be environmentally dependent [41, 69, 72]. Their result suggests that we probably would not see an increased disruption from the peptides inserting into the bilayer if we increased the peptide concentration, but it is possible that they require more peptides to quickly disrupt the outer leaflet from a non-pore forming mechanism, such as the carpet mechanism. Alternatively, it is possible that the peptide could have two different modes of action depending on the lipid content, like in the case of the α-helical peptide VP1. VP1 acts via the carpet model on membranes higher in cardiolipin and PG lipids while entering the membrane at an oblique angle and solubilizing/lysing the membrane on less negatively charged E. coli lipids [73]. They observed that fewer peptides associated to an E. coli membrane, but the membrane eventually lysed. However, in our case, the leaflet was at best slowly affected. If this concentration dependent interaction is what is happening in our system, it is possible a higher peptide concentration is required to see a strong disruption effect.
In summary, ovispirin-1 molecules associate with both dDPPG/POPG and dDPPG/E. coli polar extract lipid bilayers. The number and orientation of the associated peptides for the two types of the bilayers appear to be similar, indicating that POPG can model simple aspects of the interaction. Ovispirin-1 disrupted both leaflets of the dDPPG/POPG bilayer quickly and only slightly disrupted the outer leaflet of the dDPPG/E. coli polar lipid extract bilayer. It is possible that the ovispirin-1 could disrupt the latter bilayer, but at a much slower speed. Based on these results, it is clear that important aspects of the interaction, such as the interaction kinetics, are more accurately modeled with a more biologically-relevant E. coli extract lipid model. This is probably at least partly due to the difference in the overall net charge of the bilayers. Almost all of the peptides might be associated with both bilayers at this concentration. However, at a bilayer with a lower net charge, a higher number of peptide molecules would be needed to induce disorder similar to the pure PG system due to different disruption mechanisms.
3.3 Magainin 2
3.3.1 SFG Experiments (800 nM Magainin 2)
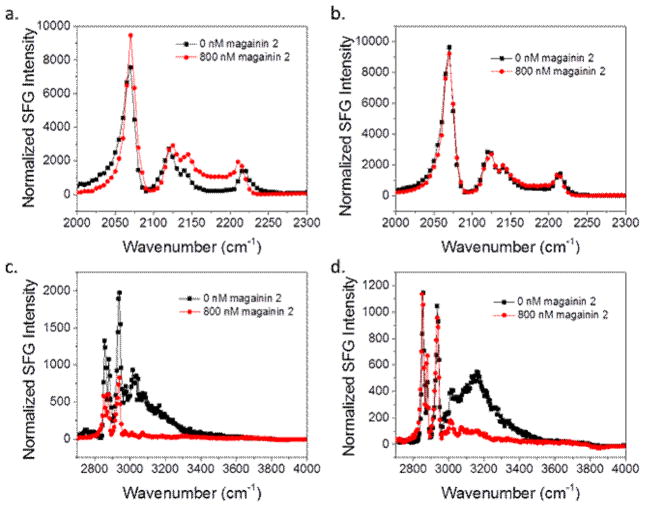
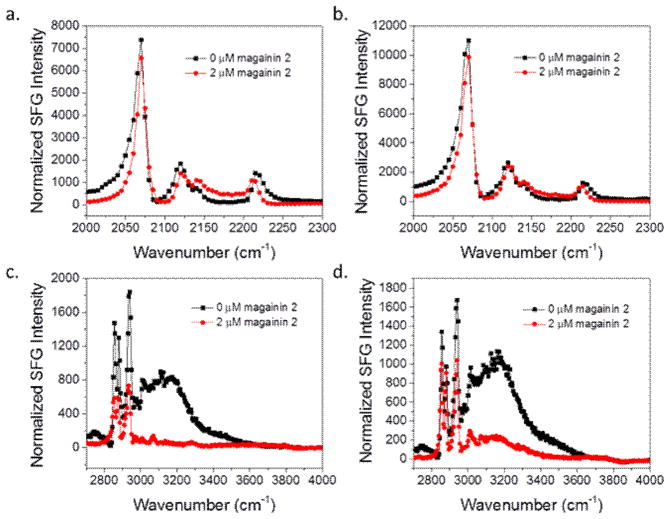
Fig. 7 shows the C-D and C-H stretching frequency ranges for 800 nM magainin 2 interacting with the two bilayer systems. A decrease in the water signal at ~3200 cm−1 in both sets of spectra indicates the magainin 2 clearly associates with both systems. As discussed above, the O-H water signal decrease is due to charge neutralization of the lipid bilayer. The positively charged bilayer associated peptides neutralize the negative charge on the PG lipids. However, a decrease in the 2880 cm−1 CH3 symmetric peak of the dDPPG/POPG bilayer indicates the outer leaflet is only disrupted in the POPG case. For the E. coli case, there is no change in the 2880 cm−1 peak before and after peptide addition to the subphase, so we believe that there is no disruption of the outer leaflet by magainin 2. Unchanged 2070 cm−1 peak intensity indicates the inner leaflet was unaffected in both systems. Since magainin 2 molecules are antimicrobial, they should also disrupt the inner leaflet when reaching a certain concentration. It is likely that the concentration is not high enough to disrupt the inner leaflet.
Fig. 7.
SFG spectra collected before (black) and after (red) the addition of magainin 2 to the subphase of (a) dDPPG/POPG bilayer in the C-D stretching frequency range; (b) dDPPG/E. coli polar extract bilayer in the C-D stretching frequency range; (c) dDPPG/ POPG in the C-H stretching frequency range; (d) dDPPG/E. coli polar extract bilayer in the C-H stretching frequency range. The magainin subphase concentration is 800 nM.
Fig. 8 shows the time dependent SFG signals of the two lipid bilayer systems interacting with magainin 2. For the dDPPG/POPG bilayer case, the 2880 cm−1 signal intensity increases quickly before a more slow decrease and eventual leveling off while the 2880 cm−1 signal for E. coli polar lipid extract seems to increase a small amount and then stabilizes without a signal decrease. From this time-dependent observation and the data from the C-D and C-H spectra, it is possible that the initial increase in 2880 cm−1 signal is due to the peptide association with the bilayer. It is feasible that the peptides induce order in the outer leaflet before causing disruption.
Fig. 8.
SFG time-dependent signal detected from (a) dDPPG/POPG bilayer, (b) dDPPG/POPG bilayer in the first 800 seconds, (c) dDPPG/E. coli polar extract bilayer; (c) dDPPG/E. coli polar extract bilayer zoomed in the first 1000 seconds, before and after the injection of magainin 2 to the subphase to reach 800 nM. Peptide injection is indicated by arrow.
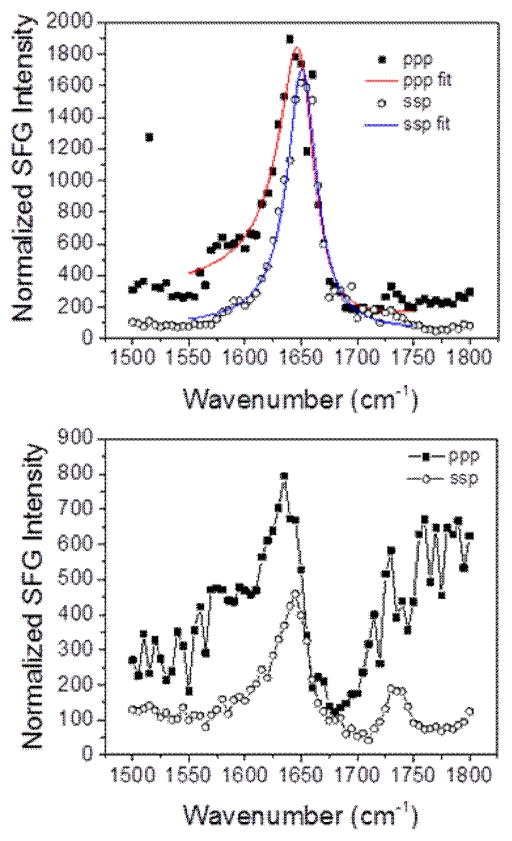
Fig. 9 shows the amide I signal detected from magainin 2 when the bilayers were in contact with the 800 nM magainin 2 solution. The overall intensity of the ~1655 cm−1 peptide signal on the dDPPG/POPG bilayer is approximately four times higher than the signal of magainin 2 associated with the dDPPG/E. coli polar bilayer, suggesting that there are more peptides on the POPG-containing bilayer. This agrees with the observation of the larger decrease of the CH3 signal for POPG vs E. coli polar systems (Fig. 7c,d) because in the former case, a certain surface concentration threshold may have been reached and allowed the peptide to disrupt the bilayer. However, fewer magainin 2 molecules were adsorbed onto the E. coli polar lipid extract leaflet and no lipid bilayer disruption was observed.
Fig. 9.
SFG spectra of Amide I signal from the magainin 2 associated with (top) dDPPG/POPG bilayer and (bottom) dDPPG/E. coli polar extract bilayer. The magainin 2 subphase concentration is 800 nM.
The fact that we do not see very much acyl chain disruption, as exhibited by very little change in the 2880 cm−1 and 2070 cm−1 signals after peptide addition, is not completely surprising if we consider that the peptide is not entering the bilayer and is laying on the surface of the bilayer due to the concentration being below the MIC. The MIC for magainin 2 against E. coli seems to vary with different strains; 55.5 μM for ATCC strain 8739, ~3 μM for ATCC 25922, and 20 μM for ATCC 25922 with F5W-magainin 2, an equipotent analogue of magainin 2 [42, 74, 75]. A previous study in our lab observed amide I signal on POPG/POPG bilayers using 800 nM magainin 2 and on POPC/POPC bilayer with 2 μM magainin 2 and determined that the peptide was in a transmembrane orientation in POPG and generally laying down on POPC [34]. Because of this success and observed interaction between magainin 2 and an anionic POPG bilayer, we started at a concentration of 800 nM in our study, even though this relatively low concentration compared to what is considered a toxic concentration to E. coli. We observed minimal disruption of our bilayers and the amide I χppp/χssp ratios, which are orientation and polarization dependent measurements, were different from a previous study in our lab (indicating a different peptide orientation – perhaps related to the different inner leaflet – see the discussion below), so we increased the concentration.
3.3.2 SFG Experiments (2 μM Magainin 2)
We then increased the magainin 2 concentration in the subphase in anticipation that a higher concentration would enable magainin 2 to disrupt both leaflets in the lipid bilayer. Fig. 10 shows the SFG signals detected in the C-D and C-H stretching frequency regions for dDPPG/POPG and dDPPG/E. coli polar extract bilayers when in contact with 2.0 μM magainin 2. At this higher concentration, there is a similar amount of disruption for the POPG leaflet as was seen at 800 nM. However, there is some minor disruption in the E. coli extract leaflet as well. The deuterated leaflet was still unaffected in both high concentration cases. This could be because the minimum concentration of peptide for total disruption was still not reached. Since it seems to be more difficult for magainin 2 to associate on dDPPG/E. coli polar extract bilayers, either due to electrostatic differences or because of a difference in other bilayer properties, the solution concentration may need to be higher before enough peptide is present on the surface to cause a disturbance.
Fig. 10.
SFG spectra collected before (black) and after (red) the addition of magainin 2 to the subphase of (a) dDPPG/POPG bilayer in the C-D stretching frequency range; (b) dDPPG/E. coli polar extract bilayer in the C-D stretching frequency range; (c) dDPPG/ POPG in the C-H stretching frequency range; (d) dDPPG/E. coli polar extract bilayer in the C-H stretching frequency range. The magainin subphase concentration is 2.0 μM.
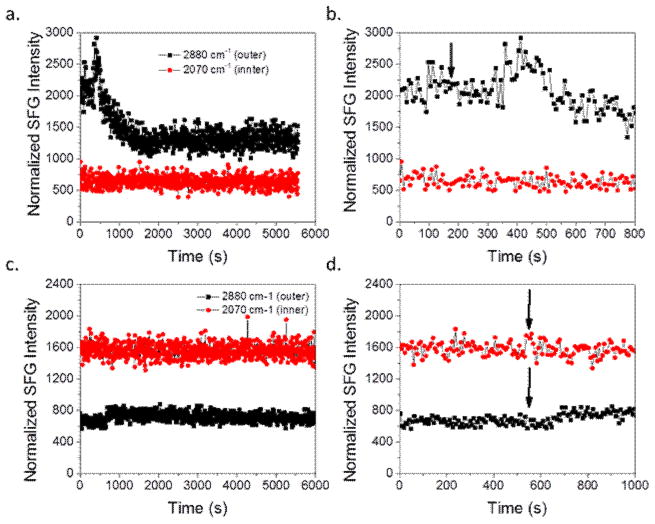
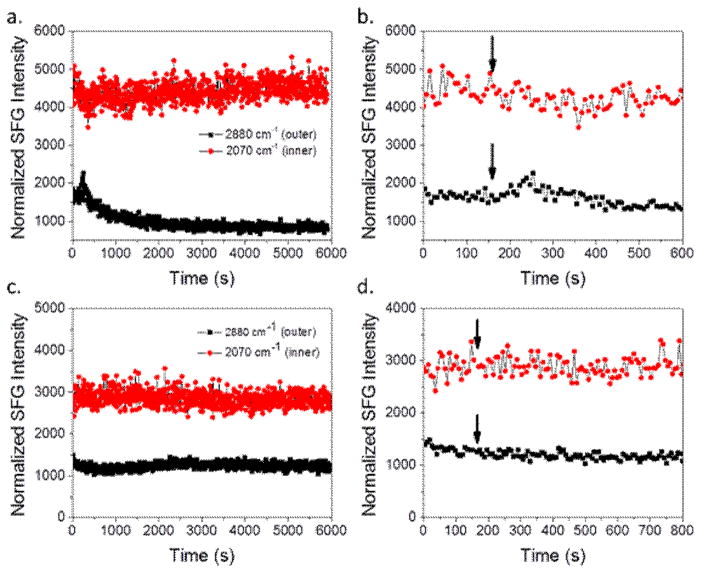
In order to determine if the increased peptide concentration affected the interaction dynamics, time dependent spectra were taken for both lipid bilayer systems. Fig. 11 shows the time dependent SFG signals before and after the addition of magainin 2 to the subphase to reach 2.0 μM. The 2880 cm−1 signal associated with the dDPPG/POPG system for the 2.0 μM case looks very similar compared to that of the 800 nM case. However, the delay time before interaction seems to be much shorter, less than half the time as before, with 2.0 μM peptide. This shorter time between injection and bilayer interaction is to be expected with a much higher concentration of peptide since the number of peptides is higher and thus the time until enough peptides reach the bilayer to cause a visible effect should be shorter. The 2880 cm−1 signal for the dDPPG/E. coli polar extract system at 2.0 μM did not change in intensity. This agrees with Figure 10d, even though the other C-h stretching signals decreased, the 2880 cm−1 peak did not change substantially.
Fig. 11.
SFG time-dependent signal detected from (a) dDPPG/POPG bilayer, (b) dDPPG/POPG bilayer in the first 600 seconds, (c) dDPPG/E. coli polar extract bilayer; (c) dDPPG/E. coli polar extract bilayer zoomed in the first 800 seconds, before and after the injection of magainin 2 to the subphase to reach 2.0 μM. Peptide injection is indicated by arrow.
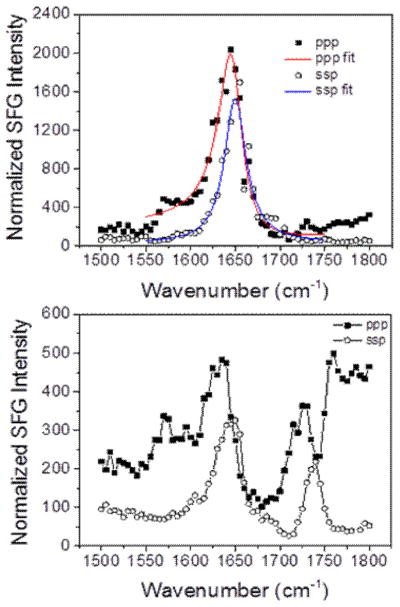
The amide I region signal at ~1655 cm−1 for 2 μM on the POPG system was comparable to that for the 800 nM case (Fig. 12). This similarity is consistent with the C-H, C-D, and time dependent spectra being comparable between the two concentrations. For the E. coli polar extract case, the ~1655 cm−1 signal was slightly higher at 2.0 μM than it was at 800 nM. This apparent slight increase in adsorbed peptide can be the cause of the slightly disrupted outer leaflet that was observed in Fig. 8. Again, this effect is likely due to the higher charged density on the POPG leaflet relative to the E. coli polar extract leaflet.
Fig. 12.
SFG spectra of Amide I signal from the magainin 2 associated with (top) dDPPG/POPG bilayer and (bottom) dDPPG/E. coli polar extract bilayer. The magainin 2 subphase concentration is 2.0 μM.
3.3.3 Magainin 2-Bilayer Interaction
We see some disruption on the POPG leaflet and on the E. coli leaflet at 2.0 μM. We believe that this is reasonable since this peptide is thought by many to operate via associating with membranes until instability causes toroidal pores to form resulting in leakage and cell death [43, 76–80]. However, there is some dispute about the accuracy of this mode of action [44]. In these toroidal pores, there is not a large amount of acyl chain disruption. This agrees with most of the previous studies, which cited that they saw very little acyl chain disruption and that the peptide had extensive interaction with the lipid head groups [74, 81, 82]. However, if there were pores forming we would expect to see some disturbance to both leaflets. Evidence that lipid flip flop was taking place and was facilitated by these pores would be observing the 2880 cm−1and 2070 cm−1 signals decreasing at approximately the same rate [77]. However, we do not observe this for either system at either concentration. This suggests that we might not be seeing toroidal pores, but just association near the lipid head groups. Again, this is likely due to the lower concentration of magainin 2 we used in the study.
Also of note is that most of the studies, both in our lab and others, used POPC and POPG (transition temperature −2 °C) or DMPC and DMPG (transition temperature 24 °C). Because 24 °C is very close to room temperature, the lipid might be in gel or fluid phase depending on the experimental conditions. Hirsh, et al. used DPPG and observed that the peptide did not insert into the bilayer and stayed associated with the head groups [81]. Without more studies in the gel phase, it is not currently known if magainin 2 cannot insert into gel phase DPPG or if the lack of activity is due to low concentration or misinterpretation, but this phenomenon has been observed before [83]. However, the possibility exists that since we employ a gel phase inner leaflet which may stabilize the outer fluid phase’s leaflet, it may be difficult for the magainin 2 peptide to enter and create a pore. Additionally, the E. coli lipid extract used for the outer leaflet contains ~60% PE lipids. It has been shown that the addition of PE lipids decreases the incidence of magainin 2 induced pores in PG lipids [84]. This is explained by the PE causing negative curvature of the bilayer which opposes apparent positive curvature strain caused by the magainin 2 and can result in an unfavorable environment for pore formation [84–86].
The low magainin 2 concentration and the lack of signal change in the 2070 cm−1 time dependent spectrum make toroidal pore formation a less likely possibility than the case where the peptide is inserting into the outer leaflet and participating in transient pore formation as stated in early papers. Increasing the concentration, however, might result in a more defined pore and stronger evidence of the toroidal pore mechanism.
In summary, magainin 2 adsorbed to both lipid bilayer systems at both concentrations used in this study, but there was significantly more association on POPG containing bilayers. Magainin 2 can disrupt the outer leaflet of the dDPPG/POPG bilayers at both 800 nM and 2.0 μM, and can slightly disrupt the outer leaflet of the dDPPG/E.coli polar extract lipid bilayer at 2.0 μM. The difference in interaction is likely partially due to the difference in bilayer surface charge and it has been observed that magainin 2 interacts differently with anionic and zwitterionic lipid bilayers. The lack of inner leaflet disruption for the POPG containing system might be due to the inner leaflet being gel phase and the bilayer thus being more resistant to flip flop and potentially toroidal pore formation. Additionally, the combination of lower surface charge and the PE lipids’ tendency to oppose positive curvature induced by magainin 2 could explain why the E. coli lipids were less disrupted compared to the POPG lipids. Therefore this study again demonstrated that a more biologically relevant model, such as E. coli extract, is important for studying peptide-bacteria cell membrane interactions.
4. Conclusions
In this study we investigated the interactions between several membrane active peptides and bilayers consisting of dDPPG/POPG and dDPPG/E. coli polar lipid extract. Because E. coli lipids include ~60% PE as well as other components, there can be large differences in peptide interactions with a membrane of POPG or POPG/POPC vs. E. coli lipids [20, 73, 87].
Our studies indicate that the interactions between various peptides and the two model bilayer, dDPPG/POPG bilayer and dDPPG/E. coli polar lipid extract bilayer, are different. However, the degree to which the interactions are different and what aspects are different depend on the peptide. MSI-594 can disrupt both types of the lipid bilayers, although not at the same rate, and the bilayer associated MSI-594 molecules have similar number and orientation. The peptide associated with the POPG containing bilayer much more quickly than with the E. coli lipid containing bilayer. This difference in interaction rate is important because one would want to ensure that a drug will be effective as quickly as possible and that time is influenced by the model system used.
Ovispirin-1 associates with both types of lipid bilayers. The number and orientation of the bilayer-associated ovispirin-1 molecules on the two bilayer systems are also similar. However, ovispirin-1 disrupted both leaflets of the dDPPG/POPG system while it barely disrupted the outer leaflet of the dDPPG/E. coli polar extract system. It too has a much slower interaction time with the dDPPG/E. coli polar lipid system. Magainin 2 molecules also associated with both types of the lipid bilayers. At a low concentration of 800 nM, magainin 2 can disrupt the POPG leaflet, but cannot disrupt the E. coli polar extract leaflet. At 2.0 μM, magainin 2 can disrupt both outer leaflets of POPG and E. coli polar lipid extract, but cannot disrupt the inner dDPPG leaflet for either bilayer.
All of the peptides in this study favored interacting with anionic PG lipids over zwitterionic ones. However, the spectra and interpreted interactions for the peptides on the two systems were not always similar. In fact, even the type of spectra that were the same between the two systems differed depending on the peptide. For example, both MSI-594 and ovispirin-1 exhibited extremely fast interaction and disruption times on dDPPG/POPG but either interacted very slowly with or did not disrupt dDPPG/E. coli polar extract bilayer. Also, the inner leaflet was never disrupted for magainin 2 like it was for MSI-594 and ovispirin-1. Some potential reasons for this were discussed earlier, but a major one is that magainin 2 operates at least part of the time through toroidal pores while MSI-594 and ovispirin-1 operate through the carpet/detergent mode. The formation of toroidal pores does not destroy a bilayer, but it does induce disruption. The interaction time differences can possibly be described by a difference in peptide charge density. If one looks at the charge on all of the peptides, they do not differ substantially (MSI-594 at +6, ovispirin-1 at +7, magainin 2 at +4). However, if we consider the charge to the number of residues, a larger difference is seen. The charge/residue for MSI-594 is 0.25/residue, ovispirin 1 is 0.39/residue, magainin 2 is 0.17/residue. It can be seen that the two quick associating carpet/detergent peptides have relatively high charge/residue values. This is likely the cause of their quick association and it may also explain why they stay associated with the charged anionic headgroups rather than forming pores. Magainin 2 seems to generally operate through a pore mechanism. This lower charge density probably allows the peptide to more easily engage in hydrophobic interactions that are required for pore formation.
Through these studies, it has been seen that to more accurately examine peptide-bacterial cell membrane interactions, including the electrostatic interactions and disruption mechanism, more complicated model lipid bilayers such as bilayers prepared using E. coli lipid extract are needed. These studies utilized SFG to monitor the bilayer integrity, peptide association and time dependent interaction of the peptide with the bilayer. This time dependent monitoring is a unique feature of the SFG method that allows us to study the kinetics of the interaction and proved to be vital in the determination that a heterogeneous E. coli extract is preferable to pure POPG to model complex peptide-cell membrane interactions. This ability is especially valuable because the time to interact with a cell is an important quality to consider when designing new antibiotic molecules. Thus, in addition to showing that the proper model system is required to collect accurate interaction information, we displayed an SFG method that is able to easily show the interaction kinetic differences. Hopefully, this information can be utilized in order to properly design environments in which to test future antibacterial therapies.
Supplementary Material
Highlights.
Peptide-bilayer interaction is different on simple and complex lipid bilayers.
The differences in interactions within the two systems vary depending on the peptide.
Use of more complex bilayers could provide some specific interaction dynamics.
Acknowledgments
This work was supported by the National Institute of Health (R01GM081655). We would also like to thank Bei Ding for insightful discussions on data analysis, Dr. Pei Yang for instrument technical support, and Jeanne Hankett for assistance with manuscript preparation.
Footnotes
Publisher's Disclaimer: This is a PDF file of an unedited manuscript that has been accepted for publication. As a service to our customers we are providing this early version of the manuscript. The manuscript will undergo copyediting, typesetting, and review of the resulting proof before it is published in its final citable form. Please note that during the production process errors may be discovered which could affect the content, and all legal disclaimers that apply to the journal pertain.
References
- 1.Nikaido H. Prevention of drug access to bacterial targets: Permeability barriers and active efflux. Science. 1994;264:382–388. doi: 10.1126/science.8153625. [DOI] [PubMed] [Google Scholar]
- 2.McMurry L, Petrucci RE, Levy SB. Active efflux of tetracycline encoded by four genetically different tetracycline resistance determinants in Escherichia coli. Proceedings of the National Academy of Sciences of the United States of America-Biological Sciences. 1980;77:3974–3977. doi: 10.1073/pnas.77.7.3974. [DOI] [PMC free article] [PubMed] [Google Scholar]
- 3.Bussiere DE, Muchmore SW, Dealwis CG, Schluckebier G, Nienaber VL, Edalji RP, Walter KA, Ladror US, Holzman TF, Abad-Zapatero C. Crystal structure of ErmC ‘,an rRNA methyltransferase which mediates antibiotic resistance in bacteria. Biochemistry. 1998;37:7103–7112. doi: 10.1021/bi973113c. [DOI] [PubMed] [Google Scholar]
- 4.Bugg TDH, Wright GD, Dutkamalen S, Arthur M, Courvalin P, Walsh CT. Molecular basis for vancomycin resistance in Enterococcus faecium BM4147: Biosynthesis of a depsipeptide peptidoglycan precursor by vancomycin resistance proteins VanH and VanA. Biochemistry. 1991;30:10408–10415. doi: 10.1021/bi00107a007. [DOI] [PubMed] [Google Scholar]
- 5.Lambert PA. Bacterial resistance to antibiotics: Modified target sites. Adv Drug Deliv Rev. 2005;57:1471–1485. doi: 10.1016/j.addr.2005.04.003. [DOI] [PubMed] [Google Scholar]
- 6.Bockstael K, Van Aerschot A. Antimicrobial resistance in bacteria. Cent Eur J Med. 2009;4:141–155. [Google Scholar]
- 7.Davies J. Inactivation of antibiotics and the dissemination of resistance genes. Science. 1994;264:375–382. doi: 10.1126/science.8153624. [DOI] [PubMed] [Google Scholar]
- 8.Wright GD. Aminoglycoside-modifying enzymes. Curr Opin Microbiol. 1999;2:499–503. doi: 10.1016/s1369-5274(99)00007-7. [DOI] [PubMed] [Google Scholar]
- 9.Murray IA, Shaw WV. O-acetyltransferases for chloramphenicol and other natural products. Antimicrobial Agents and Chemotherapy. 1997;41:1–6. doi: 10.1128/aac.41.1.1. [DOI] [PMC free article] [PubMed] [Google Scholar]
- 10.Zasloff M. Antimicrobial peptides of multicellular organisms. Nature. 2002;415:389–395. doi: 10.1038/415389a. [DOI] [PubMed] [Google Scholar]
- 11.Nguyen LT, Haney EF, Vogel HJ. The expanding scope of antimicrobial peptide structures and their modes of action. Trends Biotechnol. 2011;29:464–472. doi: 10.1016/j.tibtech.2011.05.001. [DOI] [PubMed] [Google Scholar]
- 12.Matsuzaki K. Why and how are peptide-lipid interactions utilized for self-defense? Magainins and tachyplesins as archetypes. Biochim Biophys Acta-Biomembr. 1999;1462:1–10. doi: 10.1016/s0005-2736(99)00197-2. [DOI] [PubMed] [Google Scholar]
- 13.Hancock REW, Diamond G. The role of cationic antimicrobial peptides in innate host defences. Trends Microbiol. 2000;8:402–410. doi: 10.1016/s0966-842x(00)01823-0. [DOI] [PubMed] [Google Scholar]
- 14.Mangoni ML, Shai Y. Short native antimicrobial peptides and engineered ultrashort lipopeptides: similarities and differences in cell specificities and modes of action. Cell Mol Life Sci. 2011;68:2267–2280. doi: 10.1007/s00018-011-0718-2. [DOI] [PMC free article] [PubMed] [Google Scholar]
- 15.Hallock KJ, Wildman KH, Lee DK, Ramamoorthy A. An innovative procedure using a sublimable solid to align lipid Bilayers for solid-state NMR studies. Biophys J. 2002;82:2499–2503. doi: 10.1016/S0006-3495(02)75592-6. [DOI] [PMC free article] [PubMed] [Google Scholar]
- 16.Hallock KJ, Lee DK, Omnaas J, Mosberg HI, Ramamoorthy A. Membrane composition determines pardaxin’s mechanism of lipid bilayer disruption. Biophys J. 2002;83:1004–1013. doi: 10.1016/S0006-3495(02)75226-0. [DOI] [PMC free article] [PubMed] [Google Scholar]
- 17.Lee DK, Brender JR, Sciacca MFM, Krishnamoorthy J, Yu CS, Ramamoorthy A. Lipid Composition-Dependent Membrane Fragmentation and Pore-Forming Mechanisms of Membrane Disruption by Pexiganan (MSI-78) Biochemistry. 2013;52:3254–3263. doi: 10.1021/bi400087n. [DOI] [PMC free article] [PubMed] [Google Scholar]
- 18.Sciacca MFM, Brender JR, Lee DK, Ramamoorthy A. Phosphatidylethanolamine Enhances Amyloid Fiber-Dependent Membrane Fragmentation. Biochemistry. 2012;51:7676–7684. doi: 10.1021/bi3009888. [DOI] [PMC free article] [PubMed] [Google Scholar]
- 19.Brender JR, Salamekh S, Ramamoorthy A. Membrane Disruption and Early Events in the Aggregation of the Diabetes Related Peptide IAPP from a Molecular Perspective. Accounts Chem Res. 2012;45:454–462. doi: 10.1021/ar200189b. [DOI] [PMC free article] [PubMed] [Google Scholar]
- 20.Lee TH, Heng C, Swann MJ, Gehman JD, Separovic F, Aguilar MI. Real-time quantitative analysis of lipid disordering by aurein 1.2 during membrane adsorption, destabilisation and lysis. Biochim Biophys Acta-Biomembr. 2010;1798:1977–1986. doi: 10.1016/j.bbamem.2010.06.023. [DOI] [PubMed] [Google Scholar]
- 21.McIntosh TJ, Simon SA. Area per molecule and distribution of water in fully hydrated dilauroylphosphatidylethanolamine bilayers. Biochemistry. 1986;25:4948–4952. doi: 10.1021/bi00365a034. [DOI] [PubMed] [Google Scholar]
- 22.Thurmond RL, Dodd SW, Brown MF. Molecular areas of phospholipids as determined by H-2 NMR spectroscopy – Comparison of phosphatidylethanolamines and phosphatidylcholines. Biophys J. 1991;59:108–113. doi: 10.1016/S0006-3495(91)82203-2. [DOI] [PMC free article] [PubMed] [Google Scholar]
- 23.McIntosh TJ. Differences in hydrocarbon chain tilt between hydrated phosphatidylethanolamine and phosphatidylcholine bilayers – A molecular packing model. Biophys J. 1980;29:237–245. doi: 10.1016/S0006-3495(80)85128-9. [DOI] [PMC free article] [PubMed] [Google Scholar]
- 24.Hauser H, Pascher I, Pearson RH, Sundell S. Preferred conformation and molecular packing of phosphatidylethanolamine and phosphatidylcholine. Biochimica Et Biophysica Acta. 1981;650:21–51. doi: 10.1016/0304-4157(81)90007-1. [DOI] [PubMed] [Google Scholar]
- 25.Seddon JM, Templer RH. Polymorphism of lipid-water systems. Elsevier Science Publishers B.V; PO Box 211, Sara Burgerhartstraat 25, 1000 AE Amsterdam, Netherlands P.O. Box 882, Madison Square Station New York, New York 10159–2101, USA: 1995. [Google Scholar]
- 26.Zweytick D, Turner S, Blondelle SE, Lohner K. Membrane curvature stress and antibacterial activity of lactoferricin derivatives. Biochem Biophys Res Commun. 2008;369:395–400. doi: 10.1016/j.bbrc.2008.01.176. [DOI] [PubMed] [Google Scholar]
- 27.Prenner EJ, Lewis R, Neuman KC, Gruner SM, Kondejewski LH, Hodges RS, McElhaney RN. Nonlamellar phases induced by the interaction of gramicidin S with lipid bilayers. A possible relationship to membrane-disrupting activity. Biochemistry. 1997;36:7906–7916. doi: 10.1021/bi962785k. [DOI] [PubMed] [Google Scholar]
- 28.Sevcsik E, Pabst G, Richter W, Danner S, Amenitsch H, Lohner K. Interaction of LL-37 with model membrane systems of different complexity: influence of the lipid matrix. Biophysical journal. 2008;94:4688–4699. doi: 10.1529/biophysj.107.123620. [DOI] [PMC free article] [PubMed] [Google Scholar]
- 29.Dennison SR, Kim YS, Cha HJ, Phoenix DA. Investigations into the ability of the peptide, HAL18, to interact with bacterial membranes. Eur Biophys J Biophys Lett. 2008;38:37–43. doi: 10.1007/s00249-008-0352-6. [DOI] [PubMed] [Google Scholar]
- 30.Wildman KAH, Lee DK, Ramamoorthy A. Mechanism of lipid bilayer disruption by the human antimicrobial peptide, LL-37. Biochemistry. 2003;42:6545–6558. doi: 10.1021/bi0273563. [DOI] [PubMed] [Google Scholar]
- 31.Chen X, Chen Z. SFG studies on interactions between antimicrobial peptides and supported lipid bilayers. Biochimica et biophysica acta. 2006;1758:1257–1273. doi: 10.1016/j.bbamem.2006.01.017. [DOI] [PubMed] [Google Scholar]
- 32.Boughton AP, Nguyen K, Andricioaei I, Chen Z. Interfacial orientation and secondary structure change in tachyplesin I: molecular dynamics and sum frequency generation spectroscopy studies. Langmuir. 2011;27:14343–14351. doi: 10.1021/la203192c. [DOI] [PMC free article] [PubMed] [Google Scholar]
- 33.Yang P, Ramamoorthy A, Chen Z. Membrane orientation of MSI-78 measured by sum frequency generation vibrational spectroscopy. Langmuir. 2011;27:7760–7767. doi: 10.1021/la201048t. [DOI] [PMC free article] [PubMed] [Google Scholar]
- 34.Nguyen KT, Le Clair SV, Ye SJ, Chen Z. Molecular Interactions between Magainin 2 and Model Membranes in Situ. Journal of Physical Chemistry B. 2009;113:12358–12363. doi: 10.1021/jp904154w. [DOI] [PMC free article] [PubMed] [Google Scholar]
- 35.Yang P, Wu FG, Chen Z. Dependence of Alamethicin Membrane Orientation on the Solution Concentration, The journal of physical chemistry. C. Nanomaterials and interfaces. 2013;117:3358–3365. doi: 10.1021/jp3099522. [DOI] [PMC free article] [PubMed] [Google Scholar]
- 36.Ding B, Chen Z. Molecular interactions between cell penetrating peptide Pep-1 and model cell membranes. The journal of physical chemistry B. 2012;116:2545–2552. doi: 10.1021/jp209604m. [DOI] [PMC free article] [PubMed] [Google Scholar]
- 37.Chen X, Wang J, Kristalyn CB, Chen Z. Real-time structural investigation of a lipid bilayer during its interaction with melittin using sum frequency generation vibrational spectroscopy. Biophysical journal. 2007;93:866–875. doi: 10.1529/biophysj.106.099739. [DOI] [PMC free article] [PubMed] [Google Scholar]
- 38.Chen XY, Wang J, Boughton AP, Kristalyn CB, Chen Z. Multiple orientation of melittin inside a single lipid bilayer determined by combined vibrational spectroscopic studies. J Am Chem Soc. 2007;129:1420–1427. doi: 10.1021/ja067446l. [DOI] [PubMed] [Google Scholar]
- 39.Ramamoorthy A, Thennarasu S, Lee DK, Tan A, Maloy L. Solid-state NMR investigation of the membrane-disrupting mechanism of antimicrobial peptides MSI-78 and MSI-594 derived from magainin 2 and melittin. Biophysical journal. 2006;91:206–216. doi: 10.1529/biophysj.105.073890. [DOI] [PMC free article] [PubMed] [Google Scholar]
- 40.Woys AM, Lin YS, Reddy AS, Xiong W, de Pablo JJ, Skinner JL, Zanni MT. 2D IR Line Shapes Probe Ovispirin Peptide Conformation and Depth in Lipid Bilayers. J Am Chem Soc. 2010;132:2832–2838. doi: 10.1021/ja9101776. [DOI] [PubMed] [Google Scholar]
- 41.Yamaguchi S, Huster D, Waring A, Lehrer RI, Kearney W, Tack BF, Hong M. Orientation and dynamics of an antimicrobial peptide in the lipid bilayer by solid-state NMR spectroscopy. Biophys J. 2001;81:2203–2214. doi: 10.1016/S0006-3495(01)75868-7. [DOI] [PMC free article] [PubMed] [Google Scholar]
- 42.Zasloff M, Martin B, Chen HC. Antimicrobial activity of synthetic magainin peptides and several analogs. Proc Natl Acad Sci U S A. 1988;85:910–913. doi: 10.1073/pnas.85.3.910. [DOI] [PMC free article] [PubMed] [Google Scholar]
- 43.Matsuzaki K. Magainins as paradigm for the mode of action of pore forming polypeptides. Biochim Biophys Acta-Rev Biomembr. 1998;1376:391–400. doi: 10.1016/s0304-4157(98)00014-8. [DOI] [PubMed] [Google Scholar]
- 44.Wieprecht T, Beyermann M, Seelig J. Binding of antibacterial magainin peptides to electrically neutral membranes: Thermodynamics and structure. Biochemistry. 1999;38:10377–10387. doi: 10.1021/bi990913+. [DOI] [PubMed] [Google Scholar]
- 45.Chen Z, Shen YR, Somorjai GA. Studies of polymer surfaces by sum frequency generation vibrational spectroscopy. Annu Rev Phys Chem. 2002;53:437–465. doi: 10.1146/annurev.physchem.53.091801.115126. [DOI] [PubMed] [Google Scholar]
- 46.Shen YR. Surface properties probed by second-harmonic and sum-frequency generation. Nature. 1989;337:519–525. [Google Scholar]
- 47.Zhuang X, Miranda PB, Kim D, Shen YR. Mapping molecular orientation and conformation at interfaces by surface nonlinear optics. Physical Review B. 1999;59:12632–12640. [Google Scholar]
- 48.Eisenthal KB. Liquid interfaces probed by second-harmonic and sum-frequency spectroscopy. Chem Rev. 1996;96:1343–1360. doi: 10.1021/cr9502211. [DOI] [PubMed] [Google Scholar]
- 49.Voges AB, Al-Abadleh HA, Musorrariti MJ, Bertin PA, Nguyen ST, Geiger FM. Carboxylic acid- and ester-functionalized siloxane scaffolds on glass studied by broadband sum frequency generation. Journal of Physical Chemistry B. 2004;108:18675–18682. [Google Scholar]
- 50.Moad AJ, Simpson GJ. A unified treatment of selection rules and symmetry relations for sum-frequency and second harmonic spectroscopies. Journal of Physical Chemistry B. 2004;108:3548–3562. [Google Scholar]
- 51.Paszti Z, Guczi L. Amino acid adsorption on hydrophilic TiO2: A sum frequency generation vibrational spectroscopy study. Vib Spectrosc. 2009;50:48–56. [Google Scholar]
- 52.Perry A, Neipert C, Space B, Moore PB. Theoretical modeling of interface specific vibrational spectroscopy: Methods and applications to aqueous interfaces. Chem Rev. 2006;106:1234–1258. doi: 10.1021/cr040379y. [DOI] [PubMed] [Google Scholar]
- 53.Liljebad JFD, Bulone V, Rutland MW, Johnson CM. Supported Phospholipid Monolayers. The Molecular Structure investigated by Vibrational Sum Frequency Spectroscopy. J Phys Chem C. 2011;115:10617–10629. [Google Scholar]
- 54.Wurpel GWH, Sovago M, Bonn M. Sensitive probing of DNA binding to a cationic lipid monolayer. J Am Chem Soc. 2007;129:8420. doi: 10.1021/ja072552o. [DOI] [PubMed] [Google Scholar]
- 55.Fu L, Ma G, Yan ECY. In Situ Misfolding of Human Islet Amyloid Polypeptide at Interfaces Probed by Vibrational Sum Frequency Generation. J Am Chem Soc. 2010;132:5405–5412. doi: 10.1021/ja909546b. [DOI] [PubMed] [Google Scholar]
- 56.Liu J, Conboy JC. 1,2-diacyl-phosphatidylcholine flip-flop measured directly by sum-frequency vibrational spectroscopy. Biophys J. 2005;89:2522–2532. doi: 10.1529/biophysj.105.065672. [DOI] [PMC free article] [PubMed] [Google Scholar]
- 57.Lu XL, Shephard N, Han JL, Xue G, Chen Z. Probing Molecular Structures of Polymer/Metal Interfaces by Sum Frequency Generation Vibrational Spectroscopy. Macromolecules. 2008;41:8770–8777. [Google Scholar]
- 58.Keszthelyi T, Hill K, Kiss E. Interaction of Phospholipid Langmuir Mono layers With an Antibiotic Peptide Conjugate. Journal of Physical Chemistry B. 2013;117:6969–6979. doi: 10.1021/jp401533c. [DOI] [PubMed] [Google Scholar]
- 59.Yang JT, Zhang MZ, Chen H, Chang Y, Chen Z, Zheng J. Probing the Structural Dependence of Carbon Space Lengths of Poly(N-hydroxyalkyl acrylamide)-Based Brushes on Antifouling Performance. Biomacromolecules. 2014;15:2982–2991. doi: 10.1021/bm500598a. [DOI] [PubMed] [Google Scholar]
- 60.Kim J, Cremer PS. Elucidating changes in interfacial water structure upon protein adsorption. ChemPhysChem. 2001;2:543. doi: 10.1002/1439-7641(20010917)2:8/9<543::AID-CPHC543>3.0.CO;2-5. [DOI] [PubMed] [Google Scholar]
- 61.Kim G, Gurau M, Kim J, Cremer PS. Investigations of lysozyme adsorption at the air/water and quartz/water interfaces by vibrational sum frequency spectroscopy. Langmuir. 2002;18:2807–2811. [Google Scholar]
- 62.Wang J, Buck SM, Chen Z. The effect of surface coverage on conformation changes of bovine serum albumin molecules at the air-solution interface detected by sum frequency generation vibrational spectroscopy. The Analyst. 2003;128:773–778. doi: 10.1039/b212551j. [DOI] [PubMed] [Google Scholar]
- 63.Liu J, Conboy JC. Structure of a gel phase lipid bilayer prepared by the Langmuir-Blodgett/Langmuir-Schaefer method characterized by sum-frequency vibrational spectroscopy. Langmuir. 2005;21:9091–9097. doi: 10.1021/la051500e. [DOI] [PubMed] [Google Scholar]
- 64.Yang CSC, Richter LJ, Stephenson JC, Briggman KA. In situ, vibrationally resonant sum frequency Spectroscopy study of the self-assembly of dioctadecyl disulfide on gold. Langmuir. 2002;18:7549–7556. [Google Scholar]
- 65.Krimm S, Bandekar J. Vibrational spectroscopy and conformation of peptides, polypeptides and proteins. Adv Protein Chem. 1986;38:181–364. doi: 10.1016/s0065-3233(08)60528-8. [DOI] [PubMed] [Google Scholar]
- 66.Giacometti A, Cirioni O, Kamysz W, D’Amato G, Silvestri C, Licci A, Nadolski P, Riva A, Lukasiak J, Scalise G. In vitro activity of MSI-78 alone and in combination with antibiotics against bacteria responsible for bloodstream infections in neutropenic patients. International journal of antimicrobial agents. 2005;26:235–240. doi: 10.1016/j.ijantimicag.2005.06.011. [DOI] [PubMed] [Google Scholar]
- 67.Epand RF, Maloy WL, Ramamoorthy A, Epand RM. Probing the “Charge Cluster Mechanism” in Amphipathic Helical Cationic Antimicrobial Peptides. Biochemistry. 2010;49:4076–4084. doi: 10.1021/bi100378m. [DOI] [PMC free article] [PubMed] [Google Scholar]
- 68.Buer BC, Chugh J, Al-Hashimi HM, Marsh EN. Using fluorine nuclear magnetic resonance to probe the interaction of membrane-active peptides with the lipid bilayer. Biochemistry. 2010;49:5760–5765. doi: 10.1021/bi100605e. [DOI] [PubMed] [Google Scholar]
- 69.Ding B, Soblosky L, Nguyen K, Geng JQ, Yu XL, Ramamoorthy A, Chen Z. Physiologically-Relevant Modes of Membrane Interactions by the Human Antimicrobial Peptide, LL-37, Revealed by SFG Experiments. Sci Rep. 2013;3:1–8. doi: 10.1038/srep01854. [DOI] [PMC free article] [PubMed] [Google Scholar]
- 70.Kalfa VC, Jia HP, Kunkle RA, McCray PB, Tack BF, Brogden KA. Congeners of SMAP29 kill ovine pathogens and induce ultrastructural damage in bacterial cells. Antimicrobial Agents and Chemotherapy. 2001;45:3256–3261. doi: 10.1128/AAC.45.11.3256-3261.2001. [DOI] [PMC free article] [PubMed] [Google Scholar]
- 71.Sawai MV, Waring AJ, Kearney WR, McCray PB, Forsyth WR, Lehrer RI, Tack BF. Impact of single-residue mutations on the structure and function of ovispirin/novispirin antimicrobial peptides. Protein Eng. 2002;15:225–232. doi: 10.1093/protein/15.3.225. [DOI] [PubMed] [Google Scholar]
- 72.Huang HW. Action of antimicrobial peptides: Two-state model. Biochemistry. 2000;39:8347–8352. doi: 10.1021/bi000946l. [DOI] [PubMed] [Google Scholar]
- 73.Dennison SR, Morton LH, Harris F, Phoenix DA. The impact of membrane lipid composition on antimicrobial function of an alpha-helical peptide. Chemistry and physics of lipids. 2008;151:92–102. doi: 10.1016/j.chemphyslip.2007.10.007. [DOI] [PubMed] [Google Scholar]
- 74.Matsuzaki K, Murase O, Tokuda H, Funakoshi S, Fujii N, Miyajima K. Orientational and aggregational states of magainin-2 in phospholipid bilayers. Biochemistry. 1994;33:3342–3349. doi: 10.1021/bi00177a027. [DOI] [PubMed] [Google Scholar]
- 75.Imura Y, Nishida M, Matsuzaki K. Action mechanism of PEGylated magainin 2 analogue peptide. Biochim Biophys Acta-Biomembr. 2007;1768:2578–2585. doi: 10.1016/j.bbamem.2007.06.013. [DOI] [PubMed] [Google Scholar]
- 76.Ludtke SJ, He K, Heller WT, Harroun TA, Yang L, Huang HW. Membrane pores induced by magainin. Biochemistry. 1996;35:13723–13728. doi: 10.1021/bi9620621. [DOI] [PubMed] [Google Scholar]
- 77.Matsuzaki K, Murase O, Fujii N, Miyajima K. An antimicrobial peptide, magainin 2, induced rapid flip-flop of phospholipids coupled with pore formation and peptide translocation. Biochemistry. 1996;35:11361–11368. doi: 10.1021/bi960016v. [DOI] [PubMed] [Google Scholar]
- 78.Gregory SM, Pokorny A, Almeida PFF. Magainin 2 Revisited: A Test of the Quantitative Model for the All-or-None Permeabilization of Phospholipid Vesicles. Biophys J. 2009;96:116–131. doi: 10.1016/j.bpj.2008.09.017. [DOI] [PMC free article] [PubMed] [Google Scholar]
- 79.Murzyn K, Pasenkiewicz-Gierula M. Construction of a toroidal model for the magainin pore. J Mol Model. 2003;9:217–224. doi: 10.1007/s00894-003-0127-z. [DOI] [PubMed] [Google Scholar]
- 80.Kim C, Spano J, Park EK, Wi S. Evidence of pores and thinned lipid bilayers induced in oriented lipid membranes interacting with the antimicrobial peptides, magainin-2 and aurein-3.3. Biochimica et biophysica acta. 2009;1788:1482–1496. doi: 10.1016/j.bbamem.2009.04.017. [DOI] [PubMed] [Google Scholar]
- 81.Hirsh DJ, Hammer J, Maloy WL, Blazyk J, Schaefer J. Secondary structure and location of a magainin analogue in synthetic phospholipid bilayers. Biochemistry. 1996;35:12733–12741. doi: 10.1021/bi961468a. [DOI] [PubMed] [Google Scholar]
- 82.Matsuzaki K, Murase O, Miyajima K. Kinetics of pore formation by an antimicrobial peptide, magainin-2, in phospholipid bilayers. Biochemistry. 1995;34:12553–12559. doi: 10.1021/bi00039a009. [DOI] [PubMed] [Google Scholar]
- 83.Ye SJ, Nguyen KT, Chen Z. Interactions of Alamethicin with Model Cell Membranes Investigated Using Sum Frequency Generation Vibrational Spectroscopy in Real Time in Situ. Journal of Physical Chemistry B. 2010;114:3334–3340. doi: 10.1021/jp911174d. [DOI] [PMC free article] [PubMed] [Google Scholar]
- 84.Matsuzaki K, Sugishita K, Ishibe N, Ueha M, Nakata S, Miyajima K, Epand RM. Relationship of membrane curvature to the formation of pores by magainin 2. Biochemistry. 1998;37:11856–11863. doi: 10.1021/bi980539y. [DOI] [PubMed] [Google Scholar]
- 85.Heller WT, He K, Ludtke SJ, Harroun TA, Huang HW. Effect of changing the size of lipid headgroup on peptide insertion into membranes. Biophys J. 1997;73:239–244. doi: 10.1016/S0006-3495(97)78064-0. [DOI] [PMC free article] [PubMed] [Google Scholar]
- 86.Ludtke S, He K, Huang H. Membrane thinning caused by magainin 2. Biochemistry. 1995;34:16764–16769. doi: 10.1021/bi00051a026. [DOI] [PubMed] [Google Scholar]
- 87.Hristova K, Selsted ME, White SH. Critical role of lipid composition in membrane permeabilization by rabbit neutrophil defensins. J Biol Chem. 1997;272:24224–24233. doi: 10.1074/jbc.272.39.24224. [DOI] [PubMed] [Google Scholar]
Associated Data
This section collects any data citations, data availability statements, or supplementary materials included in this article.


