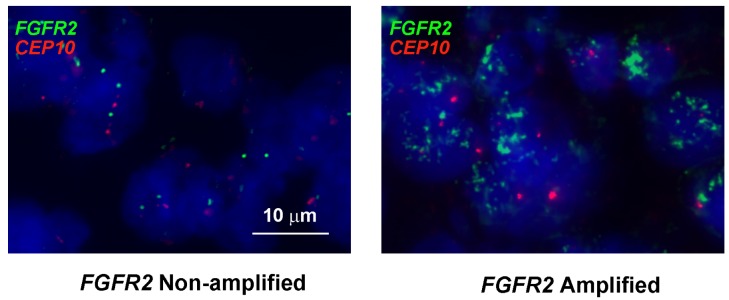
Figure 6. Representative example of FISH analysis of FGFR2 gene status from a cohort of GC specimens (n = 145).

Left panel is a non-amplified sample, right is an amplified sample. Red signals represent CEP10 genes whist green signals are FGFR2 (original magnification × 1000).
