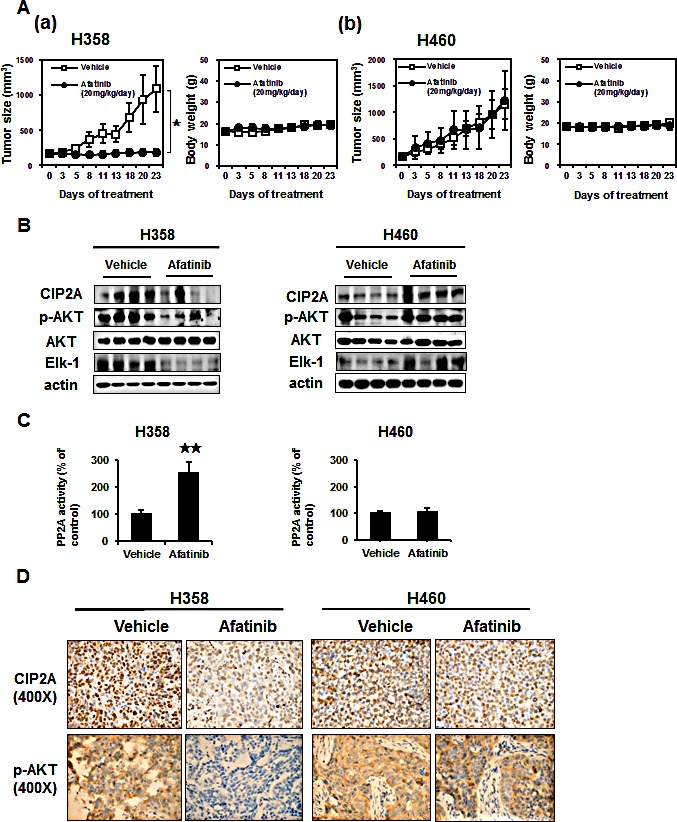
Figure 5. In vivo effects of afatinib on xenografts mice.

(A)(a) Left, effects of afatinib on tumor size in H358 xenografts. Afatinib inhibited the growth of H358 tumors by > 80%. Right, effects on body weight of H358 xenograft mice. (b) Left, effects of afatinib on tumor size in H460 xenograft mice. Right, effects on body weight of H460 xenograft mice. Mice were treated with vehicle, or oral afatinib at 20 mg/kg daily for 3 weeks (n = 8 each). Data are mean ± SD; *, p < 0.05. (B) Western blot analysis of CIP2A, p-AKT and AKT in H358 (Left) and H460 (Right) tumors. (C) The activities of PP2A in H358 (Left) and H460 (Right) tumors. mean ± SD, n = 8 for each condition.**p <0.01. (D) Representative immunohistochemical patterns of CIP2A and p-AKT in xenografts tumors.
