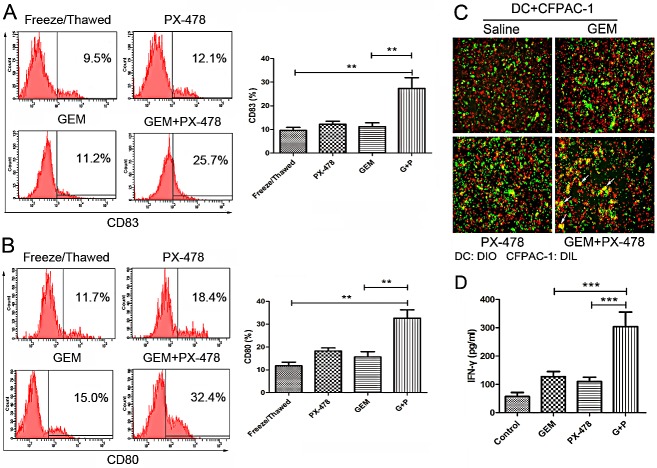
Figure 6. Comparison of treatment-induced immune response in both DCs and cytotoxic T cells.
(A and B) DC maturation. DCs were stimulated with conditioned supernatant of freeze/thawed, PX-478, Gem or Gem/PX-478 treated cell culture medium. The maturation markers for DCs, CD83 or CD80, were evaluated by flow cytometry and compared between freeze/thawed, PX-478, Gem and Gem/PX-478-treated groups. **P<0.01. Data were expressed as mean ± SD and each value represented the mean of three replicates. (C) Fluorescence microscopy analysis of phagocytosis. After 24 hours co-culture of immature DCs with killed tumor cells, the engulfment of tumor cells was verified by fluorescence microscopy. DCs were stained with DiO (green) and CFPAC-1 cells were stained with DiI (red). Double positive or yellow cells are fully phagocytized cells. (D) IFN-γ production. Immature DCs were pulsed with killed tumor cells for 24 hours and then co-cultured with autologous CD3+/CD8+ T lymphocytes. IFN-γ concentration in the supernatant was assessed after 10 days using the IFN-γ ELISA kit. A representative out of three independent experiments is depicted. ***P<0.001.

