

Abstract
Calf muscles and Achilles tendon play important roles in functional activities. However, it is not clear how biomechanical properties of the uniarticular soleus (SOL) and biarticular gastrocnemius muscle and Achilles tendon, including the fascicle length, pennation angle, and stiffness, change concurrently post stroke. Biomechanical properties of the medial gastrocnemius (GM) and soleus muscles were evaluated bilaterally in 10 hemiparetic stroke survivors using combined ultrasonography-biomechanical measurements. Biomechanical properties of the Achilles tendon including the length, cross-sectional area (CSA), stiffness, and Young's modulus were evaluated, together with calf muscle biomechanical properties. Gastrocnemius and SOL contributions were separated using flexed and extended knee positions. The impaired side showed decreased fascicle length (GM: 6%, P = 0.002 and SOL: 9%, P = 0.03, at full knee extension and 0° ankle dorsiflexion) and increased fascicular stiffness (GM: 64%, P = 0.005 and SOL: 19%, P = 0.012, at a common 50 N force level). In contrast, Achilles tendon on the impaired side showed changes in the opposite direction as the muscle fascicles with increased tendon length (5%, P < 0.001), decreased tendon CSA (5%, P = 0.04), decreased tendon stiffness (42%, P < 0.001) and Young's modulus (30%, P < 0.001) compared with the unimpaired side. The fascicle and tendon stiffness changes were correlated negatively to the corresponding fascicle and tendon length changes, and decrease in Achilles tendon stiffness was correlated to the increases of SOL and GM fascicular stiffness (P < 0.05). Characterizations of calf muscle fascicles and Achilles tendon biomechanical properties help us better understand concurrent changes of fascicles and tendon as part of the calf muscle-tendon unit and facilitate development of more effective treatments.
Keywords: stiffness, muscle fascicles, tendon, stroke
calf muscles and achilles tendon play important roles in functional activities. Spasticity, contracture, and muscle weakness commonly observed in calf muscles post stroke, which contribute considerably to disabilities post stroke (5, 12, 16, 34, 38). The spastic plantar flexors, weak dorsiflexor, and associated foot drop post stroke make it hard for the foot to clear the ground during locomotion. In addition, the calf muscle weakness results in reduced forward propulsion (31, 33, 34, 37). Recent studies using ultrasonography reported decreased fascicle length and increased fascicle stiffness of the calf muscles associated with the decreased ankle joint range of motion and increased joint stiffness post stroke (10, 11, 21). Most of the studies were on the gastrocnemius muscle with few on the whole calf muscle-tendon unit including Achilles tendon together with soleus (SOL) as well as gastrocnemius muscles (40).
Tendons play an essential role in transmitting muscle force to the bone and controlling limb movements. It has been reported that metabolic activity in human tendon is remarkably high, which affords the tendon the ability to adapt to changing demands (3, 4, 17, 18). Our recent study found increased tendon length, decreased stiffness, and increased mechanical hysteresis of the Achilles tendon post stroke (39). The marked muscle fascicular changes post stroke may be closely associated with biomechanical changes in the corresponding tendon. However, few studies have been done to investigate the simultaneous biomechanical changes of the SOL and gastrocnemius medialis (GM) muscles and Achilles tendon post stroke. It is not clear how the uniarticular SOL and the biarticular GM become stiffer differently and contribute to the increased ankle joint stiffness and spasticity post stroke.
B-mode ultrasonography has been commonly used in studying muscle and tendon properties in vivo and noninvasively (8, 9, 13, 22–26, 29). However, ultrasound images often suffer from poor quality and high level of speckle noise so that manual measurement adopted in those studies was subjective and might not be accurate. In this study, we adopted an automatic linear feature detection method based on localized Radon transform (6, 28, 32), combined with an extended field-of-view technique (35) to analyze muscle fascicle images under controlled passive movements.
The purpose of the present study was to investigate concurrent biomechanical changes of the biarticular GM and uniarticular SOL muscle fascicles and Achilles tendon in both the impaired and unimpaired sides of patients post stroke. The hypotheses were that both SOL and GM muscle fascicles would become shorter and stiffer, whereas Achilles tendon became longer and more compliant in the impaired side, compared with the unimpaired side.
METHODS
Subjects.
Ten stroke survivors participated in the study (6 right side impaired and 4 left side impaired, the left and right side impaired groups each had one female subject). The inclusion criteria for the patients were at least 1 year poststroke, hemiplegia, able to walk with a cane or without any mechanical aid, able to generate plantar flexion torque using the calf muscles. Exclusion criteria were having other severe neuromuscular disease, leg musculoskeletal injuries, and/or orthopedic surgeries on the leg. The patients had a mean age of 54.0 ± 12.0 (mean ± SD, range 24.8∼67.8) yr, stroke duration of 9.5 ± 4.6 (range 1.8∼16.3) yr, a mean height of 170.8 ± 10.0 (range 147.0∼180.0) cm, body mass of 81.6 ± 19.4 (range 59.9∼113.9) kg. Their modified Ashworth scale (MAS) at the impaired ankle was 2.5 ± 1.4 (range 0∼4) (2). Their passive range of motion (ROM) at the impaired ankle was 1.6 ± 15.4 (range −25∼17) degrees in dorsiflexion and 46.2 ± 6.1 (range 37∼60) degrees in plantar flexion. The ROM was measured with a goniometer by moving the joint manually between the dorsiflexion and plantar flexion extremities. One subject wore knee-ankle-foot orthotics (KAFO), and one subject wore ankle-foot orthotics (AFO) regularly. Five subjects used straight canes. One patient had dorsiflexor contracture and the 30° ankle plantar flexion was reached very slowly during the experiment. All participants gave written informed consent that was approved by the Institutional Review Board of Northwestern University.
Experimental setup.
The experimental setup was comprised of the following four major components: a custom knee-ankle joint-driving device, an ultrasound imaging system (LOGIQ-9, GE Healthcare, Waukesha, WI), an electromyography (EMG) system (Delsys, Boston, MA), and a personal computer (Fig. 1).
Fig. 1.

Schematic diagram of the experimental setup. Setup was comprised of a custom knee-ankle driving device, a commercial ultrasound imaging system, an EMG system, and a personal computer. Ankle joint torque signal collected by the torque sensor in the knee-ankle device and the EMG signal were recorded by the personal computer and synchronized with the ultrasound image data using a trigger signal.
Experimental procedure.
The experiment for each subject was composed of two visits. Each of the legs was tested in one of the two visits, following the same protocol. The sequence of the side being tested was selected randomly. Time between the two visits for each subject was within 1 wk.
The subject was seated upright with the thigh and trunk secured using Velcro straps. The leg and foot were securely attached to the leg linkage and footplate, respectively, with the knee and ankle joints aligned with the shaft of the corresponding knee and ankle motors, respectively. To evaluate muscle fascicle properties, the ankle was fixed at various dorsiflexion angles (at 5° step) across the subject's ankle ROM. The knee was positioned at 90° flexion and full extension in different trials to separate ankle joint torque contributions from the uniarticular SOL and biarticular GM muscles, because with flexed knee at 90°, most of the ankle joint torque can be attributed to uniarticular muscles (SOL) (36). The torque difference between fully extended knee and flexed knee should be attributed to biarticular muscles (gastrocnemius). With the dorsiflexion axis aligned with the motor shaft at extreme dorsiflexion, the heel of the subject was securely fixed to the footplate using a Velcro strap in front of the ankle. The heel position was monitored throughout the experiment to ensure its contact with the footplate. Between different ankle positions, the ankle was moved slowly without eliciting spasm or reflex. The ankle joint torque and position and the ultrasound images of the SOL and GM muscles were measured at each of the knee-ankle configurations, after the ankle was stabilized. The subject was asked to relax his leg muscles during the experiment. The Achilles tendon mechanical properties were evaluated following the same protocols described in Ref. (39). Briefly, tendon length (defined as the distance between calcaneus tendon insertion site and SOL muscle-tendon junction), CSA, and moment arm were measured using ultrasonography combined with mechanical measurement. Then the subject performed a controlled isometric plantar flexion effort, following the target (15 N·m) and actual torques displayed in real time on the monitor. The torque target was selected such that all the subjects could accomplish the task without losing control or causing much fatigue. Tendon stiffness, Young's modulus (the slope of the stress-strain curve), and mechanical hysteresis were calculated based on the ultrasound video and ankle joint torque. EMG signal from the tibialis anterior muscle was used to monitor the activities of dorsiflexors, and the subjects were asked to minimize the dorsiflexor cocontraction EMG during the plantar flexion task (39).
GM and SOL fascicle images.
To improve the accuracy of the GM fascicle measurement, the probe was moved, scanning the transverse plane of the distal muscle belly of GM to locate the fascicle plane. Once at the middle of the ultrasound image the deep aponeurosis of GM was parallel to the bottom of the image, the probe was rotated 90°, and the image plane was regarded as being aligned with the fascicle plane (1). The probe was then moved proximally within the fascicle plane to cover the full longitudinal image of the GM muscle using an extended field of view technique (35) called LOGIQView. To obtain the SOL fascicle image, the probe was moved along the middle line on the posterior side of the lower leg scanning the sagittal plane using LOGIQView. Representative fascicle images of GM and SOL muscles are shown in Fig. 2, A and B, respectively.
Fig. 2.

Longitudinal images of gastrocnemius (GM; A) and soleus (SOL; B) muscles using the LOGIQView technique. Selection of fascicle and measurement of fascicle length and pennation angle, as well as some important anatomic landmarks, including muscle belly and distal end, were shown in the images. C: a representative image of GM demonstrating automatic fascicle detection using localized Radon transform. A region around the middle point between muscle belly and muscle-tendon junction (MTJ) was selected, and 3 lines were detected that were superficial and deep aponeuroses and a fascicle. Length of the fascicle and angle between the fascicle and deep aponeurosis were then calculated automatically.
Measurements of the SOL and GM muscle fascicle length and pennation angle.
In this study, the fascicle length was measured halfway between the middle muscle belly and the distal end of the muscle (Fig. 2). Usually the clearest fascicle in the region was selected for length measurement. For GM, the pennation angle was measured as the angle between the fascicle selected for length measurement and the deep aponeurosis of GM. For SOL, the pennation angle was measured as the angle between the fascicle selected for length measurement and the superficial aponeurosis of SOL. Representative fascicles and measurement of pennation angles for GM and SOL muscles are shown in Fig. 2, A and B, respectively.
The above measurements could be done either manually using software such as ImageJ (National Institutes of Health, Bethesda, MD) or automatically using linear detection methods. Because ultrasound images usually suffer from poor quality and high level of speckle noise, manual measurement could be time consuming and subjective. A linear feature detection method based on localized Radon transform (6, 28, 32) was adopted to detect the fascicles in a specified region (41). Briefly, this method uses prior knowledge to specify in which region and in what orientation range the fascicle is most likely to be detected. Then the image space is transformed into Radon space where the integrated intensity of every possible line is calculated. Points in Radon space with high intensities correspond to possible line features in image space. A revoting strategy is also applied to extract multiple lines one by one following the descending order of integrated pixel intensities (42). After the line with highest integrated intensity is detected, it is removed from the image space and Radon transform is applied again (revote) to the modified image to detect the second line. Revoting strategy provides a simple and robust way to extract lines one by one. The same procedure is applied several times until all the expected line features are detected.
Figure 2C demonstrates linear feature detection using the proposed method. Image as shown in Fig. 2A was used to measure the GM fascicle length and pennation angle. A region around the halfway between the GM muscle belly and distal end was selected, and three linear features including the deep aponeurosis, superficial aponeurosis, and one fascicle were detected. The fascicle length and pennation angle were then calculated based on the positions of the detected lines.
Achilles tendon mechanical properties.
Achilles tendon resting length was measured using LOGIQView. The tendon moment arm was measured using a method combining ultrasonography and mechanical measurement. The distance between the posterior skin above the Achilles tendon and the center of rotation was measured using a caliper. The distance between the Achilles tendon line of action and the posterior skin was measured from the LOGIQView image. The tendon moment arm was measured by subtracting the latter result from the former one. The CSA of the Achilles tendon was measured in the transverse plane ultrasound images. Both CSA and length of Achilles tendon were measured at neutral ankle position with zero ankle joint torque. For each subject's each side, three measurements were taken at each of the three locations equally dividing the Achilles tendon between calcaneus tendon insertion and SOL muscle-tendon junction (MTJ) into four segments. Then the mean value from the nine measurements was regarded as the CSA of the Achilles tendon. The Achilles tendon stiffness, Young's modulus, and hysteresis were measured at 3% tendon strain by tracking tendon elongation and recording ankle joint torque signal during subject's voluntary contraction of the calf muscles, which was further converted to Achilles tendon force by dividing the torque with the measured tendon moment arm. Further detailed descriptions can be found in Ref. (39).
Muscle fascicular stiffness.
The moment arm of the Achilles tendon at 0° dorsiflexion was measured for each subject's impaired and unimpaired sides, using the method described above. The values of the moment arm at other ankle joint angles were computed based on the moment arm at 0° dorsiflexion and the moment arm-ankle joint angle relation curve obtained from musculoskeletal simulation software OpenSim (7). It was assumed that the contribution of the passive gastrocnemius muscle to the ankle joint torque was negligible at 90° knee flexion (10, 27). Therefore, the ankle resistance torque at 90° knee flexion was regarded as determined by the SOL muscle alone. The SOL passive force was then calculated in the range of 20° plantar flexion to 15° dorsiflexion. The corresponding SOL fascicular force was scaled by 1/cos(θSOL), with θSOL being the pennation of SOL fascicles. The gastrocnemius contribution to the ankle passive resistance torque was estimated as the difference of the passive ankle resistance torque between full knee extension and 90° knee flexion, because the biarticular gastrocnemius muscles are the major ankle plantar flexors crossing the knee joint as well as the ankle. The gastrocnemius passive force was also calculated in the range of 20° plantar flexion to 15° dorsiflexion. The passive force from GM was determined as 61% of the total passive gastrocnemius force based on the method described previously (10). The corresponding GM fascicular force was scaled by 1/cos(θGM), with θGM being the pennation of GM fascicles. The resulting force-angle data were curve fitted using second-order polynomial to establish the fascicular force-length relation. Constraint was applied such that the fitted fascicular force rose monotonically with length. The fascicular stiffness of GM and SOL were determined as the slope of the corresponding fascicular force-length relation curves.
Statistical analysis.
Analysis of variance with repeated measures was used to analyze the response variables (fascicle length, stiffness, and pennation angles of the GM and SOL muscles, Achilles tendon length, CSA, stiffness, and Young's modulus) with respect to each factor (subject's side, ankle position, knee position). The significance level was set at 0.05. The paired Student t-test was used for further comparison of the variables between groups. Significance level was adjusted using Bonferroni corrections. Pearson correlation coefficients were calculated to quantify associations among the biomechanical changes in SOL and GM muscle fascicles and Achilles tendon. The results were presented as means ± standard deviations unless specified otherwise.
RESULTS
SOL and GM fascicle lengths.
The GM fascicles of the impaired side were significantly shorter than that of the unimpaired side across the ankle ROM and at both the extended and flexed knee positions (P < 0.046) (Fig. 3, A and B). For example, at 0° ankle dorsiflexion and extended knee position, fascicles in the impaired side (45.4 ± 6.5 mm) were significantly (P = 0.03) shorter than that of the unimpaired side (48.3 ± 5.4 mm). At 0° ankle dorsiflexion and 90° knee flexion, fascicles in the impaired side (34.0 ± 5.6 mm) were significantly (P = 0.046) shorter than unimpaired side (36.0 ± 6.2 mm). In addition, significantly shorter fascicle length was found at 90° knee flexion than that at full knee extension both in the impaired side (P < 0.001) and unimpaired side (P < 0.001) (Fig. 3, A and B).
Fig. 3.

GM and SOL fascicle lengths of the impaired (dashed lines) and unimpaired (solid lines) sides at different ankle and knee positions. A: GM fascicles at various ankle joint angles and full knee extension; B: GM fascicles at various ankle joint angles and 90° knee flexion; C: SOL fascicles at full knee extension; D: GM fascicles at 90° knee flexion. Note the error bar represents the standard error of mean, and shaded area indicates significant difference between the impaired and unimpaired sides.
The SOL fascicle length of the impaired side was significantly shorter (P < 0.001) than that of the unimpaired side across the ankle ROM and at both the extended and flexed knee positions (Fig. 3, C and D). For example, at 0° ankle dorsiflexion and flexed knee position, SOL fascicles of the impaired side (35.2 ± 5.8 mm) were significantly (P = 0.002) shorter than that of the unimpaired side (38.3 ± 5.6 mm). Similarly, at 0° ankle dorsiflexion and extended knee position, SOL fascicles of the impaired side (35.5 ± 5.6 mm) were significantly (P < 0.001) shorter than that of the unimpaired side (39.2 ± 5.6 mm) (Fig. 3C). Considering the uniarticular SOL muscle only crosses the ankle, no significant difference in SOL fascicle length was found between 90° knee flexion and full knee extension at both the impaired side (P = 0.60) and unimpaired side (P = 0.80) (Fig. 3, C and D).
SOL and GM fascicle pennation angle.
For GM fascicles, there was significant difference in the pennation angle between full knee extension and 90° knee flexion in both the impaired and unimpaired sides (Fig. 4, A and B). For example, in the impaired side at 0° ankle dorsiflexion, GM pennation angle at full knee extension (22.5 ± 5.1°) was significantly (P < 0.001) smaller than at 90° knee flexion (27.0 ± 5.7°), reflecting the effect of passive stretch on the GM fascicles at full knee extension. Similarly, in the unimpaired side at 0° ankle dorsiflexion, pennation angle at full knee extension (21.6 ± 3.8°) was significantly (P < 0.001) smaller than at 90° knee flexion (27.5 ± 5.4°). No significant difference was found on the GM pennation between the impaired and unimpaired sides either at full knee extension or at 90° knee flexion.
Fig. 4.

GM and SOL pennation angles of the impaired (dashed lines) and unimpaired (solid lines) sides at different ankle and knee positions. A: GM pennation angles at various ankle joint angles and full knee extension; B: GM pennation angles at various ankle joint angles and 90° knee flexion; C: SOL pennation angles at full knee extension; D: SOL pennation angles at 90° knee flexion. Note the error bar represents the standard error of mean, and shaded area indicates significant difference between the impaired and unimpaired sides.
For the SOL muscle, at full knee extension and 0° to 30 ankle° plantar flexion, pennation angle of the impaired side was significantly greater than that of the unimpaired side (P < 0.05) (Fig. 4C). For example, at full knee extension and 0° dorsiflexion, pennation angle of the impaired side (27.4 ± 3.6°) was significantly (P = 0.04) greater than that of the unimpaired side (24.7 ± 4.5°). However, no significant difference was found between the impaired side and unimpaired side at 90° knee flexion and any ankle dorsiflexion position (Fig. 4D).
SOL and GM fascicular force-length relation.
For both SOL and GM, the force-length relation curve of the impaired side shifted to the upper left and had a steeper slope compared with the unimpaired side, indicating the fascicles were shorter and stiffer in the impaired side (Fig. 5, A and B). At 50 N GM fascicular force, the fascicle length was 44.9 ± 6.6 and 47.3 ± 5.6 mm (P = 0.010) for the impaired and unimpaired sides, and the fascicular stiffness (the slope of the force-length relation) was 20.2 ± 7.9 and 12.3 ± 5.1 N/mm (p = 0.005) for the impaired and unimpaired sides, respectively. At 50 N SOL fascicular force, the fascicle length was 36.9 ± 5.7 and 39.4 ± 6.4 mm (P = 0.023) for the impaired and unimpaired sides, and the fascicular stiffness of the impaired side (15.7 ± 6.4 N/mm) was significantly higher than that of the unimpaired side (13.2 ± 4.3 N/mm) (P = 0.012). The 50 N force level was selected because it was achievable comfortably by all the subjects, such that the results were more reliable with a larger sample size.
Fig. 5.
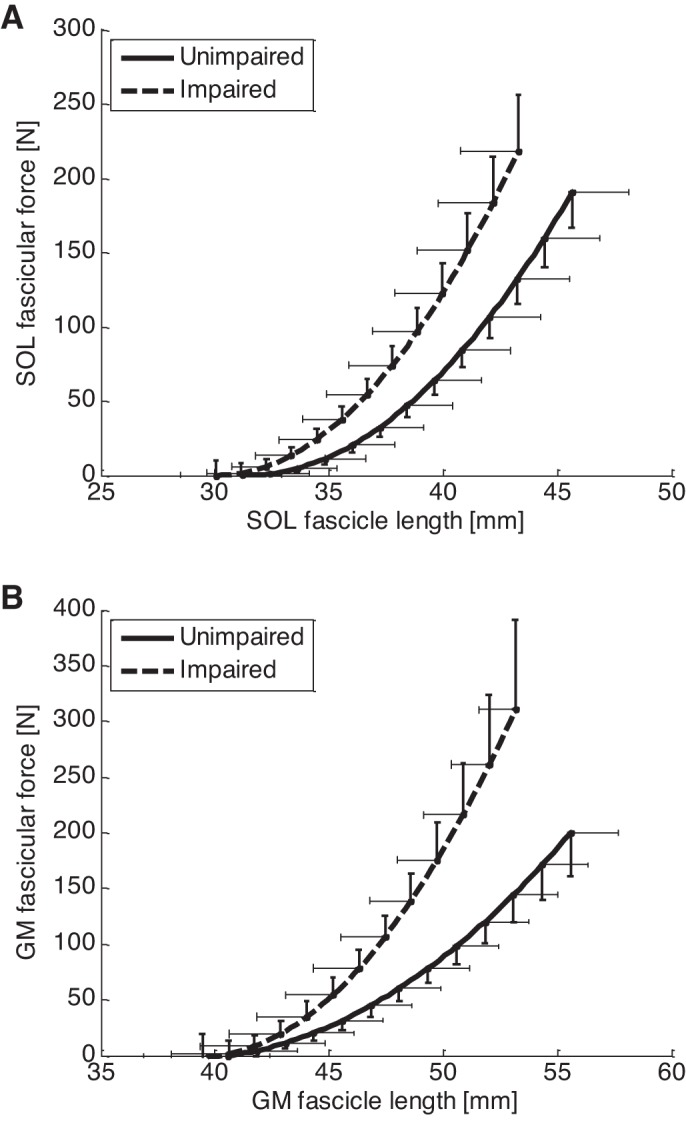
SOL (A) and GM (B) fascicle force-length relation curves. Compared with the unimpaired side, both SOL and GM fascicle force-length curves shifted to the left and became steeper, indicating reduced fascicle length and increased fascicular stiffness in the impaired side. Notice that the error bar represents the standard error of mean.
Achilles tendon mechanical properties.
The Achilles tendon length measured in the impaired side (68.9 ± 9.1 mm) was significantly longer (P < 0.001) than in the unimpaired side (65.9 ± 8.2 mm), accompanied by the significant shortening of the SOL and GM fascicles. Achilles tendon CSA measured in the impaired side (53.3 ± 10.5 mm2) was significantly smaller than in the unimpaired side (56.2 ± 10.4 mm2) (P = 0.04). The estimated Achilles tendon stiffness in the impaired side (144.2 ± 45.8 N/mm) was significantly lower (P < 0.001) than that in the unimpaired side (248.6 ± 96.3 N/mm), accompanied by the significant increases in SOL and GM fascicular stiffness. Similarly, the estimated Achilles tendon Young's modulus in the impaired side (205.6 ± 76.8 MPa) was significantly lower (P < 0.001) than that in the unimpaired side (292.1 ± 137.0 MPa).
Correlations between muscle and tendon mechanical properties changes.
Pearson correlation coefficients showed correlations between the SOL and GM muscle fascicle and Achilles tendon biomechanical changes from the unimpaired side to the impaired side (Table 1). At 0° ankle dorsiflexion and full knee extension, significant positive correlation was found between GM and SOL fascicle length changes (ρ = 0.92, P < 0.001), whereas significant negative correlation was found between GM fascicle and Achilles tendon stiffness changes (ρ = −0.87, P = 0.001), between SOL fascicle and Achilles tendon stiffness changes (ρ = −0.71, P = 0.02), between GM fascicle length and stiffness (ρ = −0.83, P = 0.002), SOL fascicle length and stiffness (ρ = −0.75, P = 0.01), and between Achilles tendon length and stiffness (ρ = −0.94, P < 0.001) (Table 1).
Table 1.
Pearson correlation coefficients of the biomechanical changes of Achilles tendon, GM, and SOL fascicles of the impaired side versus the unimpaired side at 0° ankle dorsiflexion and full knee extension
| LGM | KGM | LSOL | KSOL | LAch | KAch | |
|---|---|---|---|---|---|---|
| LGM | 1.0 | |||||
| KGM | −0.83 | 1.0 | ||||
| LSOL | 0.92 | −0.47 | 1.0 | |||
| KSOL | −0.56 | 0.30 | −0.75 | 1.0 | ||
| LAch | −0.32 | 0.26 | −0.19 | 0.21 | 1.0 | |
| KAch | 0.53 | −0.87 | 0.64 | −0.71 | −0.94 | 1.0 |
GM, gastrocnemius; SOL, soleus; Ach, Achilles.
L and K represent length and stiffness, respectively. Correlations with statistical significance are shown in bold.
DISCUSSION
In the present study, changes in the mechanical properties of GM and SOL muscle fascicles and Achilles tendon post stroke were evaluated in vivo and noninvasively using ultrasonography combined with biomechanical measurements. Results showed concurrent significant changes in the biomechanical properties of muscle fascicles and tendon, including decreased GM and SOL fascicle length, higher fascicular stiffness, increased tendon length, decreased tendon CSA, and lower tendon stiffness and Young's modulus in the impaired side compared with the matched unimpaired side of the stroke survivors.
Localized Radon transform was used to calculate the fascicle length and pennation angle, assuming fascicles and aponeuroses were straight lines. Most fascicles of GM and SOL under passive stretch were very close to straight linear structures. Although aponeuroses, especially superficial aponeurosis of GM was not straight (Fig. 2C), within a small region, it could still be treated as linear. Moreover, the automatic measurement results were corroborated with the manual measurement results.
In addition to the MAS score, we also measured the GM and SOL muscle thickness in both sides of the patients from the fascicle images at 90° knee angle and 0° ankle dorsiflexion. GM muscle in the impaired side (14.6 ± 2.4 mm) was found significantly (P < 0.005) thinner than the unimpaired side (16.0 ± 2.2 mm). Similarly, SOL muscle in the impaired side (14.2 ± 2.9 mm) was significantly (P = 0.013) thinner than the unimpaired side (16.8 ± 1.6 mm). Both indicated that there was substantial muscle atrophy in patients' impaired side.
The GM fascicle length and pennation angle found in the unimpaired side in our study were comparable to those in cadavers and in healthy subjects in Ref. (1) (fascicle length ranged from 27 to 64 mm; pennation angle ranged from 11 to 30°). The GM fascicle results in the impaired side from our study were also comparable with a previous study on stroke survivors (10) (fascicle length: 32 to 59 mm; pennation angle: 14 to 37°). GM fascicle length found in Ref. (8) was longer (97 to 133 mm) than what we found, and pennation angle was smaller (14 to 18°), which was probably due to the variations of subjects and methods. In another study (20), the reported GM fascicle lengths (35 mm in stroke patients and 38 mm in healthy controls) were also comparable to the values reported in this study. The physical dimensions and mechanical properties found in Achilles tendon in this study were comparable to what were reported in Ref. (39).
For the SOL pennation angles, there was a trend of increasing pennation from the 90° knee flexion and full knee extension in the impaired side (but no significant difference), indicating increased intermuscular coupling (myofacial force transmission) between the spastic gastrocnemius and SOL muscles (also see Fig. 2C on their relationship) (14, 15).
To measure the Achilles tendon mechanical properties, the subject was asked to perform a controlled isometric contraction following the torque target. Fifteen Newtons per meter was selected as the torque target such that every subject (with moderate spasticity) could achieve the target without losing control or causing much fatigue. Tibialis anterior muscle activity was monitored using EMG to minimize cocontraction, which would result in less calculated muscle force than the true force. The triceps surae muscle EMG signals were not recorded because the placement of EMG electrodes would interfere with the ultrasound transducer.
There are limitations with the present study. The fascicular force-length relation might be affected by the simplified model of calculating the fascicular force from the ankle joint dorsiflexion resistance torque. The model assumed the torque contribution from SOL did not change with knee flexion angle, and the ankle torque at 90° knee flexion came from SOL. Moreover, the model did not take into account the torque contribution from other muscles and soft tissues, the intramuscular force, the complicated relation between muscle force and fascicular force. Ignoring force contributions from other muscles would result in fascicular stiffness overestimation of the muscle to which the force was attributed. However, most plantar flexion torques can be attributed to SOL and gastrocnemius muscles (30). Nevertheless, according to Fig. 3, A and B, the fascicle length of SOL did not change from 90° knee flexion to full knee extension, indicating the resistance torque from SOL did not change with knee flexion angle significantly. Curve fitting using second-order polynomial was used for fascicular force-length relation, assuming that stiffness increased linearly with the fascicle length, which may be another limitation of the present study. Restrictions were also applied to ensure the curve bent upward, considering stiffness is positive.
The GM force as 61% of the total gastrocnemius force was based on the averaged ratio of GM physiological CSA (area perpendicular to the fiber orientation that is proportional to the number of fibers in parallel or the muscle force generating capacity) of the total gastrocnemius muscle physiological CSA. Such ratio may vary for different individuals and different pathological conditions such as stroke, atrophy, etc., which is another limitation of the study.
The tendon length and CSA were measured at ankle rest position, with about zero ankle joint torque. Still, the actual tension in the tendon may be slightly different from zero, and such tension in the tendon may be different among different subjects and between affected and unaffected sides. It was thus possible that the longer tendon length in the impaired side was partially due to the greater plantar flexor muscle tension on the impaired side.
The leg posture of 0° ankle dorsiflexion and full knee extension were used to compare GM or SOL fascicle mechanical properties between impaired and unimpaired sides to be consistent with Achilles tendon evaluation. Results showed longer and more compliant Achilles tendon and shorter and stiffer calf muscle fascicles in the impaired side than the unimpaired side. It was possible that muscle atrophy associated with impaired neural control and lack of movement post stroke made muscle fascicles shorter and stiffer with muscle stiffness also increasing further with tonic contraction, which applied strong and sustaining stretch to the tendon. Over time, it might result in elongation of the tendon and reduction of its stiffness. Calf muscles and Achilles tendon can be approximated as springs in series (Fig. 6), with the total length related to the leg length. With the calf muscles become stiffer and shorter post stroke, the middle point between the two springs (MTJ) may shift proximally toward the calf muscles and the Achilles tendon gets elongated. Such difference could be due to the adaptations of both impaired and unimpaired sides. Results also showed in both impaired and unimpaired sides, Achilles tendon was much stiffer than GM or SOL fascicles under passive conditions due to different structures, which is consistent with the finding in Ref. (19).
Fig. 6.
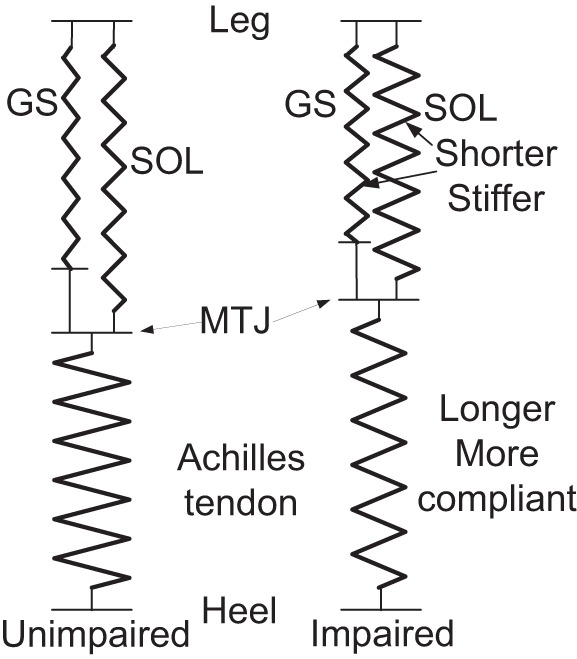
Spring model of the SOL and gastrocnemius muscles and Achilles tendon of the impaired (right) and unimpaired (left) sides at comparable ankle position.
Based on Fig. 5, at 0 N fascicular force, GM fascicle length was 39.5 ± 8.2 mm in the impaired side and 40.6 ± 5.7 mm in the unimpaired side, and SOL fascicle length at 0 N was 30.0 ± 4.8 mm in the impaired side and 31.2 ± 5.4 mm in the unimpaired side, with no significant difference between the impaired and unimpaired sides for either GM or SOL fascicles. However, the fascicle slack lengths at 0 N were curve-fitted results using second-order polynomial. Furthermore, for stroke survivors, GM and SOL fascicles may be always under certain tension. Therefore, comparison and interpretation of fascicle slack length at 0 N needs to be done with care.
No significant correlation was found between the fascicles, and Achilles tendon length changes might be due to the small difference between the impaired and unimpaired sides and the small sample. As the difference of the mechanical properties were much larger than that of the physical dimensions, significant correlation was found between the fascicles and Achilles tendon stiffness changes.
Conclusions
In the present study, GM, SOL, and Achilles tendon physical size and mechanical properties of both the impaired and the unimpaired sides of 10 hemiparetic stroke survivors were investigated in vivo and noninvasively. Decreased fascicle length, increased fascicular stiffness, increased tendon length, and decreased tendon stiffness and Young's modulus were found in the impaired side compared with the unimpaired side. The biomechanical properties changes of SOL and gastrocnemius muscle fascicles and Achilles tendon were closely correlated. These changes may reflect calf muscle passive properties changes and the adaptations of the Achilles tendon to such changes post stroke, which may help us gain insight into spasticity/contracture and motor impairment post stroke and facilitate development of more effective rehabilitation treatment.
DISCLOSURES
No conflicts of interest, financial or otherwise, are declared by the author(s).
AUTHOR CONTRIBUTIONS
Author contributions: H.Z. and L.-Q.Z. conception and design of research; H.Z. and Y.R. performed experiments; H.Z., Y.R., and L.-Q.Z. analyzed data; H.Z., Y.R., E.J.R., R.L.H., and L.-Q.Z. interpreted results of experiments; H.Z. and Y.R. prepared figures; H.Z. drafted manuscript; H.Z., Y.R., E.J.R., R.L.H., and L.-Q.Z. edited and revised manuscript; L.-Q.Z. approved final version of manuscript.
ACKNOWLEDGMENTS
The authors acknowledge the support of the National Institute of Child Health and Human Development (R01-HD044295) and National Institute on Disability and Rehabilitation Research.
REFERENCES
- 1.Benard MR, Becher JG, Harlaar J, Huijing PA, Jaspers RT. Anatomical information is needed in ultrasound imaging of muscle to avoid potentially substantial errors in measurement of muscle geometry. Muscle Nerve 39: 652–665, 2009. [DOI] [PubMed] [Google Scholar]
- 2.Bohannon RW, Smith MB. Interrater reliability of modified Ashworth scale of muscle spasticity. Phys Ther 67: 206–207, 1987. [DOI] [PubMed] [Google Scholar]
- 3.Bojsen-Moller J, Kalliokoski KK, Seppanen M, Kjaer M, Magnusson SP. Low-intensity tensile loading increases intratendinous glucose uptake in the Achilles tendon. J Appl Physiol 101: 196–201, 2006. [DOI] [PubMed] [Google Scholar]
- 4.Christensen B, Dyrberg E, Aagaard P, Enehjelm S, Krogsgaard M, Kjaer M, Langberg H. Effects of long-term immobilization and recovery on human triceps surae and collagen turnover in the Achilles tendon in patients with healing ankle fracture. J Appl Physiol 105: 420–426, 2008. [DOI] [PubMed] [Google Scholar]
- 5.Chung SG, Van Rey E, Bai Z, Roth EJ, Zhang LQ. Biomechanic changes in passive properties of hemiplegic ankles with spastic hypertonia. Arch Phys Med Rehabil 85: 1638–1646, 2004. [DOI] [PubMed] [Google Scholar]
- 6.Copeland AC, Ravichandran G, Trivedi MM. Localized Radon transform-based detection of ship wakes in Sar Images. IEEE Trans Geosci Remote Sensing 33: 35–45, 1995. [Google Scholar]
- 7.Delp SL, Anderson FC, Arnold AS, Loan P, Habib A, John CT, Guendelman E, Thelen DG. OpenSim: open-source software to create and analyze dynamic simulations of movement. IEEE Trans Biomed Eng 54: 1940–1950, 2007. [DOI] [PubMed] [Google Scholar]
- 8.Fukunaga T, Ichinose Y, Ito M, Kawakami Y, Fukashiro S. Determination of fascicle length and pennation in a contracting human muscle in vivo. J Appl Physiol 82: 354–358, 1997. [DOI] [PubMed] [Google Scholar]
- 9.Fukunaga T, Ito M, Ichinose Y, Kuno S, Kawakami Y, Fukashiro S. Tendinous movement of a human muscle during voluntary contractions determined by real-time ultrasonography. J Appl Physiol 81: 1430–1433, 1996. [DOI] [PubMed] [Google Scholar]
- 10.Gao F, Grant TH, Roth EJ, Zhang LQ. Changes in passive mechanical properties of the gastrocnemius muscle at the muscle fascicle and joint levels in stroke survivors. Arch Phys Med Rehabil 90: 819–826, 2008. [DOI] [PubMed] [Google Scholar]
- 11.Gao F, Zhang LQ. Altered contractile properties of the gastrocnemius muscle post stroke. J Appl Physiol 105: 1802–1806, 2008. [DOI] [PMC free article] [PubMed] [Google Scholar]
- 12.Harlaar J, Becher JG, Snijders CJ, Lankhorst GJ. Passive stiffness characteristics of ankle plantar flexors in hemiplegia. Clin Biomech 15: 261–270, 2000. [DOI] [PubMed] [Google Scholar]
- 13.Herbert RD, Moseley AM, Butler JE, Gandevia SC. Change in length of relaxed muscle fascicles and tendons with knee and ankle movement in humans. J Physiol 539: 637–645, 2002. [DOI] [PMC free article] [PubMed] [Google Scholar]
- 14.Huijing P, Yaman A, Ozturk C, Yucesoy C. Effects of knee joint angle on global and local strains within human triceps surae muscle: MRI analysis indicating in vivo myofascial force transmission between synergistic muscles. Surg Radiol Anat 33: 869–879, 2011. [DOI] [PMC free article] [PubMed] [Google Scholar]
- 15.Huijing PA. Epimuscular myofascial force transmission between antagonistic and synergistic muscles can explain movement limitation in spastic paresis. J Electromyog Kinesiol 17: 708–724, 2007. [DOI] [PubMed] [Google Scholar]
- 16.Katz RT, Rymer WZ. Spastic hypertonia: mechanisms and measurement. Arch Phys Med Rehabil 70: 144–155, 1989. [PubMed] [Google Scholar]
- 17.Kjaer M, Langberg H, Miller BF, Boushel R, Crameri R, Koskinen S, Heinemeier K, Olesen JL, Dossing S, Hansen M, Pedersen SG, Rennie MJ, Magnusson P. Metabolic activity and collagen turnover in human tendon in response to physical activity. J Musculoskelet Neuronal Interact 5: 41–52, 2005. [PubMed] [Google Scholar]
- 18.Kjaer M, Magnusson P, Krogsgaard M, Boysen Moller J, Olesen J, Heinemeier K, Hansen M, Haraldsson B, Koskinen S, Esmarck B, Langberg H. Extracellular matrix adaptation of tendon and skeletal muscle to exercise. J Anat 208: 445–450, 2006. [DOI] [PMC free article] [PubMed] [Google Scholar]
- 19.Kubo K, Kanehisa H, Fukunaga T. Is passive stiffness in human muscles related to the elasticity of tendon structures? Eur J Appl Physiol 85: 226–232, 2001. [DOI] [PubMed] [Google Scholar]
- 20.Kwah LK, Herbert RD, Harvey LA, Diong J, Clarke JL, Martin JH, Clarke EC, Hoang PD, Bilston LE, Gandevia SC. Passive mechanical properties of gastrocnemius muscles of people with ankle contracture after stroke. Arch Phys Med Rehabil 93: 1185–1190. [DOI] [PubMed] [Google Scholar]
- 21.Li L, Tong KY, Hu X. The effect of poststroke impairments on brachialis muscle architecture as measured by ultrasound. Arch Phys Med Rehabil 88: 243–250, 2007. [DOI] [PubMed] [Google Scholar]
- 22.Loram ID, Maganaris CN, Lakie M. Use of ultrasound to make noninvasive in vivo measurement of continuous changes in human muscle contractile length. J Appl Physiol 100: 1311–1323, 2006. [DOI] [PubMed] [Google Scholar]
- 23.Maganaris CN, Baltzopoulos V, Sargeant AJ. In vivo measurements of the triceps surae complex architecture in man: implications for muscle function. J Physiol 512: 603–614, 1998. [DOI] [PMC free article] [PubMed] [Google Scholar]
- 24.Maganaris CN, Paul JP. In vivo human tendon mechanical properties. J Physiol 521: 307–313, 1999. [DOI] [PMC free article] [PubMed] [Google Scholar]
- 25.Magnusson SP, Aagaard P, Dyhre-Poulsen P, Kjaer M. Load-displacement properties of the human triceps surae aponeurosis in vivo. J Physiol 531: 277–288, 2001. [DOI] [PMC free article] [PubMed] [Google Scholar]
- 26.Magnusson SP, Narici MV, Maganaris CN, Kjaer M. Human tendon behaviour and adaptation, in vivo. J Physiol 586: 71–81, 2008. [DOI] [PMC free article] [PubMed] [Google Scholar]
- 27.Muraoka T, Chino K, Muramatsu T, Fukunaga T, Kanehisa H. In vivo passive mechanical properties of the human gastrocnemius muscle belly. J Biomech 38: 1213–1219, 2005. [DOI] [PubMed] [Google Scholar]
- 28.Murphy LM. Linear feature detection and enhancement in noisy images via the radon-transform. Pattern Recognition Letters 4: 279–284, 1986. [Google Scholar]
- 29.Narici MV, Binzoni T, Hiltbrand E, Fasel J, Terrier F, Cerretelli P. In vivo human gastrocnemius architecture with changing joint angle at rest and during graded isometric contraction. J Physiol 496: 287–297, 1996. [DOI] [PMC free article] [PubMed] [Google Scholar]
- 30.Neptune RR, Kautz SA, Zajac FE. Contributions of the individual ankle plantar flexors to support, forward progression and swing initiation during walking. J Biomech 34: 1387–1398, 2001. [DOI] [PubMed] [Google Scholar]
- 31.Olney SJ, Richards C. Hemiparetic gait following stroke. Part I: characteristics. Gait Posture 4: 136–148, 1996. [Google Scholar]
- 32.Onana V, Trouve E, Mauris G, Rudant JP, Tonye E. Detection of linear features in synthetic-aperture radar images by use of the localized Radon transform and prior information. Appl Optics 43: 264–273, 2004. [DOI] [PubMed] [Google Scholar]
- 33.Perry J. Gait Analysis: Normal and Pathological Function. New York: McGraw-Hill, 1992. [Google Scholar]
- 34.Vattanasilp W, Ada L, Crosbie J. Contribution of thixotropy, spasticity, and contracture to ankle stiffness after stroke. J Neurol Neurosurg Psychiatry 69: 34–39, 2000. [DOI] [PMC free article] [PubMed] [Google Scholar]
- 35.Weng L, Tirumalai AP, Lowery CM, Nock LF, Gustafson DE, Von Behren PL, Kim JH. US extended-field-of-view imaging technology. Radiology 203: 877–880, 1997. [DOI] [PubMed] [Google Scholar]
- 36.Wickiewicz TL, Roy RR, Powell PL, Edgerton VR. Muscle architecture of the human lower limb. Clin Orthop Relat Res 179: 275–283, 1983. [PubMed] [Google Scholar]
- 37.Winter DA. Biomechanics and Motor Control of Human Movement. New York: John Wiley & Sons, 2004. [Google Scholar]
- 38.Zhang LQ, Chung SG, Ren Y, Liu L, Roth EJ, Rymer WZ. Simultaneous characterizations of reflex and nonreflex dynamic and static changes in spastic hemiparesis. J Neurophysiol 110: 418–430, 2013. [DOI] [PMC free article] [PubMed] [Google Scholar]
- 39.Zhao H, Ren Y, Wu YN, Liu SQ, Zhang LQ. Ultrasonic evaluations of Achilles tendon mechanical properties post stroke. J Appl Physiol 106: 843–849, 2009. [DOI] [PMC free article] [PubMed] [Google Scholar]
- 40.Zhao H, Wu YN, Hwang M, Ren Y, Gao F, Gaebler-Spira D, Zhang LQ. Changes of calf muscle-tendon biomechanical properties induced by passive stretching and active movement training in children with cerebral palsy. J Appl Physiol 111: 435–442, 2011. [DOI] [PMC free article] [PubMed] [Google Scholar]
- 41.Zhao H, Zhang LQ. Automatic tracking of muscle fascicles in ultrasound images using localized radon transformation. IEEE Trans Biomed Eng 58: 2094–2101, 2011. [DOI] [PubMed] [Google Scholar]
- 42.Zhou Y, Zheng YP. Estimation of muscle fiber orientation in ultrasound images using revoting hough transform (RVHT). Ultrasound Med Biol 34: 1474–1481, 2008. [DOI] [PubMed] [Google Scholar]