

Abstract
Preliminary proteomics studies between tonic vs. phasic smooth muscles identified three distinct protein spots identified to be those of transgelin (SM22). The latter was found to be distinctly downregulated in the internal anal sphincter (IAS) vs. rectal smooth muscle (RSM) SMC. The major focus of the present studies was to examine the differential molecular control mechanisms by SM22 in the functionality of truly tonic smooth muscle of the IAS vs. the adjoining phasic smooth muscle of the RSM. We monitored SMC lengths before and after incubation with pFLAG-SM22 (for SM22 overexpression), and SM22 small-interfering RNA. pFLAG-SM22 caused concentration-dependent and significantly greater relaxation in the IAS vs. the RSM SMCs. Conversely, temporary silencing of SM22 caused contraction in both types of the SMCs. Further studies revealed a significant reverse relationship between the levels of SM22 phosphorylation and the amount of SM22-actin binding in the IAS and RSM SMC. Data showed higher phospho-SM22 levels and decreased SM22-actin binding in the IAS, and reverse to be the case in the RSM SMCs. Experiments determining the mechanism for SM22 phosphorylation in these smooth muscles revealed that Y-27632 (Rho kinase inhibitor) but not Gö-6850 (protein kinase C inhibitor) caused concentration-dependent decreased phosphorylation of SM22. We speculate that SM22 plays an important role in the regulation of basal tone via Rho kinase-induced phosphorylation of SM22.
Keywords: proteomics, actin-myosin binding, transgelin-actin binding
smooth muscles (SM) have been classified into tonic and phasic types on the bases of agonist-induced contraction (14, 15). The initial component is the “phasic” and the latter component of sustained contraction the “tonic.” Classic examples of truly tonic SM (that exhibit spontaneous tone in the absence of any stimulus), sphincteric SM of the gastrointestinal tract, are the lower esophageal sphincter (LES) and the internal anal sphincter (IAS) (4, 7, 27, 40). Typically, in the IAS, the basal tone is primarily maintained by the unique properties of SM proper that plays a pivotal role in anorectal continence (27, 35). The molecular mechanisms for the development of basal tone in the IAS are the focus of recent studies in our laboratory and those of others.
IAS and RSM representing tonic and phasic SM, respectively (38), are located adjacently, and yet have different physiological properties. Therefore, these SM offer a unique opportunity to examine the differences between tonic and phasic SM (29). Tonic or phasic characteristics of SM have been associated with the variation in the contractile proteins contents (6, 9, 19, 24, 26, 29, 40). Previously we have reported higher expression of RhoA/Rho kinase (ROCK) in tonic IAS vs. phasic RSM SM and smooth muscle cells (SMC) (25, 26, 32, 38).
Preliminary proteomics experiments (data not presented here) revealed transgelin (SM22) to be consistently downregulated in the IAS vs. RSM SMC. In these exploratory studies, we used two-dimensional differential in gel electrophoresis (2D-DIGE), an advance discovery proteomics technique (1, 10, 11), coupled with ProteomeX Electrospray Ion-Trap (ThermoElectron) MS based on Peptide Mass Fingerprinting techniques (16). However, to examine the functionally differential regulation of the tonic IAS vs. phasic RSM, the focus of the present studies is to investigate the role of SM22 in the mechanistic differences in these respective SMC. To examine this issue, we performed systematic studies using the overexpression and silencing of SM22 by small-interfering RNA (siRNA) strategies in IAS vs. RSM SMC. We also monitored phosphorylation and actin-binding assays of the differentially expressed proteins in these phenotypically SM, before and after different concentrations of ROCK (Y-27632) and protein kinase C (PKC) (Gö-6850) inhibitors, respectively (25, 26, 30).
MATERIALS AND METHODS
Tissue preparation.
Male Sprague-Dawley rats (300–350 g) were killed by decapitation, and the anal canal with an adjacent region of the rectum was quickly removed and transferred to oxygenated (95% O2-5% CO2) Krebs physiological solution (KPS) of the following composition (in mM): 118.07 NaCl, 4.69 KCl, 2.52 CaCl2, 1.16 MgSO4, 1.01 NaH2PO4, 25 NaHCO3, and 11.10 glucose (37°C). Adventitious structures connected to the IAS and the RSM were removed carefully by sharp dissection. After this, the mucosa was removed using sharp dissection, and circular SM strips (∼1 × 7 mm) of the IAS and RSM were prepared as explained previously (28, 38). The experimental protocols were approved by the institutional animal care and use committee of Thomas Jefferson University in accordance with the recommendations of the American Association for the Accreditation of Laboratory Animal Care.
Measurement of isometric tension.
The SM strips were transferred to a 2-ml muscle bath containing oxygenated KPS at 37°C. One end of the strips was anchored at the bottom of the muscle bath, whereas the other end was connected to a force transducer (model FT03; Grass Instruments, Quincy, MA). Isometric tension was measured by the Powerlab/8SP data-acquisition system (AD Instruments, Castle Hill, Australia) and recorded using chart 4.1.2 (AD Instruments). Each SM strip was initially stretched to a tension of 0.7 g. The muscle strips were then given at least 1 h to equilibrate during which they were washed with KPS every 20 min. For IAS only the SM strips that developed spontaneous tone and responded by relaxation to electrical field stimulation were used for the study (31, 38). The RSM was characterized by the presence of a low-grade tone with the superimposed phasic contractions. After the equilibration period, the SM strips were treated with different concentrations of inhibitors.
Preparation of dispersed IAS and RSM SMC.
SMCs were isolated from IAS and RSM by sequential enzymatic digestion, filtration, and centrifugation as described previously (26, 37). Briefly, the SM tissues were cut into 0.2 × 0.2-mm blocks and incubated in KPS containing 0.1% collagenase and 0.01% trypsin inhibitor. The partly digested tissues were washed, and SMC were allowed to disperse spontaneously for 30 min. Cells were harvested by filtration through 500 μM Nitex mesh and centrifuged two times at 350 g for 10 min.
Sample preparation.
IAS and RSM SMC were homogenized with tissue homogenizer in homogenization buffer (50 mM Tris, 150 mM NaCl, 1% NP-40, and 0.5% sodium deoxycholate) on ice. Smooth muscle actin was precipitated using agarose-bound actin antibody (Santa Cruz Biotechnology, Santa Cruz, CA). Briefly, 2,000 μg of lysate were incubated with 200 μg of agarose-bound antibody for 4 h at 4°C. At the end of incubation, actin was precipitated with agarose via centrifugation, and supernatant was collected. Protein samples were purified using a two-dimensional clean-up kit (GE Healthcare). Protein concentrations were determined using the GE Healthcare Quant Kit (Piscataway, NJ). Samples were stored at −80°C until further processing.
Fluorescent tagging: 2D-DIGE labeling (minimal labeling) and electrophoresis.
The protein samples were brought to pH of 8–8.5 with 1 M NaOH to optimize minimal labeling. To overrule any dye-based artifacts in quantitation, samples were randomly labeled with Cy3 or Cy5 from each group (IAS or RSM SMC). Each sample aliquot of 50 μg of protein was labeled with Cy3 or Cy5 (400 pmol). Equal amounts of protein from every sample were mixed to create a normalization pool, and then an aliquot (50 μg) of the pool was labeled with Cy2 (400 pmol). The labeling reaction was stopped by addition of 1 μl of 10 mM lysine and incubated on ice for 15 min. Equal amounts (50 μg) of Cy3-labeled sample, Cy5-labeled sample, and Cy2-labeled pool sample were combined and applied to each gel. Use of a normalization pool (which serves as an internal standardization) nearly abolishes the possibility of erroneous results due to different concentration loads and other related issues (2, 33).
An equal volume of 2× sample buffer [2 M thiourea, 7 M urea, 2% IPG buffer (pH 3–10; nonlinear and 1.2% DeStreak reagent)] was added to all samples to give a final volume of 150 μl. The 18-cm pH 3–10 nonlinear gradient Immobiline DryStrips (GE Healthcare) were rehydrated for 12 h with 350 μl of protein sample in rehydration buffer [DeStreak Rehydration Solution containing 0.5% IPG buffer (pH 3–10) using an IPG-phor (GE Healthcare)] following the manufacturer's instructions. Proteins were focused by using the following steps: 500 V for 3 h (step and hold), 1,000 V for 6 h (gradient), and finally 8,000 V for 6 h (step and hold).
After isoelectric focusing the IPG strips were incubated for 15 min in equilibration buffer I (0.375 M Tris·HCl, pH 8.8, 6 M urea, 2% SDS, 20% glycerol, and 13 mM dithiothreitol) to eliminate disulfide bonds in the focused proteins in preparation for the second dimension. The IPG strips were then soaked in equilibration buffer II [0.375 M Tris·HCl (pH 8.8), 6 M urea, 2% SDS, 20% glycerol, and 2.5% iodoacetamide] for an additional 15 min to alkylate the sulfhydryl groups. Next, isoelectric focusing strips were applied to 12.5% polyacrylamide gels (26 cm width × 20 cm height × 1 mm thick), sealed with 0.7% low-melting-point agarose containing bromophenol blue in a buffer of 1× Tris/glycine/SDS buffer [25 mM Tris, 192 mM glycine, and 0.1% (wt/vol) SDS, pH 8.3]. This was run for 30 min at 2 W/gel and then for 6–7 h at 20 W/gel at 20°C using the Ettan DALTtwelve system (GE Healthcare) for separation of proteins on the basis of molecular weight.
For preparative (picking) gels, an aliquot of 350 μg of sample was diluted with an equal volume of 2× sample buffer [2 M thiourea, 7 M urea, 2% IPG buffer (pH 3–10), and 1.2% DeStreak reagent]. The total volume was brought up to 450 μl with rehydration buffer [DeStreak Rehydration Solution and 0.5% IPG buffer (pH 3–10)]. Proteins were focused as described above for other gels. Each of these strips was equilibrated in equilibration solutions as mentioned above. For the preparative picking gel, a single plate for each gel plate sandwich was treated with Bind-Silane solution (80% ethanol, 0.02% glacial acetic acid, and 0.001% Bind-Silane) and had reference markers placed on them. After the completion of electrophoresis, the plates that had not been silane treated were removed from the sandwich, and the gels were fixed overnight with 30% ethanol and 7.5% glacial acetic acid. The preparative picking gels were then stained with Deep Purple Total Protein Stain (GE Healthcare) for 2 h.
Gel scanning and image analysis.
All two-dimensional gels were imaged on a Typhoon 9400 fluorescent imager (GE Healthcare) at a resolution of 100 μm. Photomultiplier tube voltages were individually set for each of the three colored lasers to ensure maximum linear signals. The same voltages were used for all the gels. The DIGE gels were imaged at three different wavelengths (Cy2: 520 nm; Cy3: 580 nm; Cy5: 670 nm), and the Deep Purple Total Protein Stain-stained gels were imaged at 100 μm with a separate filter (610 nm).
Gel images were imported into the DeCyder software 5.01 (GE Healthcare) for analysis. Gel alignment was conducted automatically and then checked manually to ensure correct alignment. A reference gel with minimum distortion and streaks was then selected from the Cy2 gels. Spot detection and spot matching across all the gels were conducted automatically, and then spot matching was checked and manually edited to ensure correct matching, merging, and splitting of spots. All of the spots included in analysis were transported to the DIA module of DeCyder using a value of 1,000 as the initial estimate of protein spots present. Quantitation of spots was accomplished by comparing the ratio of each Cy3 and Cy5 value with the values obtained from the normalization pool/Cy2 channel present on each gel. DIA analyses were collected in a single analysis using the BVA module of DeCyder, and final values for the expression ratio of specific protein spots between IAS and RSM were calculated. Statistical analysis was performed by t-test to confirm the level of significance among various groups. For identified proteins having multiple isoforms, the normalized volumes of all isoforms of a given protein were added together, and statistical analysis was repeated on the totals.
Protein identification with ProteomeX electrospray ion-trap.
For identification of spots, protein spots were picked from picking gels using a robot-directed spot picker (Ettan Spot Picker; GE Healthcare). The spots selected for picking were determined on the basis of differential expression from the 2D-DIGE analyses. The picker head was calibrated using the reference stickers placed on the preparative picking gel, and gel plugs were picked and placed in a bar-coded 96-well plate. The picked spots were then identified by using ProteomeX Electrospray Ion-Trap (ThermoElectron) MS where protein primary sequence information was determined using Peptide Mass Fingerprinting techniques (16). The data were submitted to the MASCOT search engine using the NCBI nonredundant and SwissProt databases against mammals for identification. MASCOT confidence interval scores of >95% were considered as positive protein identification.
Measurement of SM22 phosphorylation.
Levels of phosphorylated SM22 were determined from IAS and RSM in the basal state and following Y-27632 treatments. The SM were homogenized on ice in lysis buffer (composed of 50 mM Tris·HCl, pH 7.5, 150 mM NaCl, 1% Nonidet P-40, 0.5% sodium deoxycholate, 2 mM NaVO4, and 25 mM NaF), and SM22 was immunoprecipitated using a Roche Diagnostics immunoprecipitation kit (Protein G) (Fisher). Lysate (200 μg) in 250 μl were precleared with 25 μl protein G agarose beads. Precleared lysate was incubated with 2 μg of SM22 rabbit polyclonal antibody (H-75, sc-50446; Santa Cruz Biotechnology) for 1 h. Later, 25 μl of protein G agarose beads were added and further incubated for 4 h to immobilize antigen-antibody complexes. Agarose beads were centrifuged for 20 s at 10,000 g and washed three times with wash buffer (50 mM Tris·HCl, pH 7.5, 150 mM NaCl, 1% Nonidet P-40, and 0.5% sodium deoxycholate) to remove nonspecific bindings. Later 50 μl of low-salt buffer (LSB) were added to the beads and placed in a boiling water bath for 5 min. Protein samples were separated by 15% SDS-PAGE, and Western blot was performed using anti-phospho-serine monoclonal antibody (Calbiochem).
Coimmunoprecipitation of SM22-actin complexes.
Actin-SM22 complexes were coimmunoprecipitated using agarose-conjugated actin polyclonal antibody (Santa Cruz). Briefly, 200 μg of lysate in 250 μl were incubated with 20 μl of anti-actin antibody-agarose for 4 h. Agarose beads were centrifuged for 20 s at 10,000 g and washed repeatedly with wash buffer (50 mM Tris·HCl, pH 7.5, 150 mM NaCl, 1% Nonidet P-40, and 0.5% sodium deoxycholate) to remove nonspecific binding. Later 50 μl of LSB were added to the beads and placed in a boiling water bath for 5 min. Protein samples were separated by 15% SDS-PAGE, and Western blot analysis was performed using rabbit anti-SM22 antibody (Santa Cruz).
Immunoblot analysis.
Protein samples (20 μg in SDS loading buffer) were separated by electrophoresis on 15% SDS-polyacrylamide gel, transferred to polyvinylidene difluoride membrane, and probed with the specific primary antibodies (listed in Chemicals and drugs) diluted in TBS-T containing 1% milk for 1 h at room temperature (RT). After being washed three times, the membranes were incubated with the horseradish peroxidase (HRP)-conjugated secondary antibodies (1:10,000 for each bovine anti-rabbit for SM22 and bovine anti-mouse for phospho-serine antibody). After the blot was washed three times, the corresponding bands were visualized with enhanced chemiluminescence substrate using the SuperSignal West Pico Chemiluminescent Substrate (Pierce, Rockford, IL) and Hyperfilm MP (Amersham Bioscience, Piscataway, NJ). The membranes were stripped of secondary and primary antibodies by incubating with Restore Western blot stripping buffer (Pierce) for 15 min at RT. The membranes were again reprobed with α-actin antibody. Bands corresponding to different proteins on X-ray films were scanned with a scanner (model SNAPSCAN 310; Agfa, Ridgefield Park, NJ), and their relative densities were determined using Image-Pro Plus 4.0 software (Media Cybernetics).
SMC transfections and measurement of SMC lengths.
Isolated SMC from IAS and RSM were cultured in Dulbecco's modified Eagle's medium with 5% penicillin-streptomycin, 50 μg/ml gentamycin, and 2 μg/ml amphotericin B at 37°C with 5% CO2 for 24 h. Later, IAS and RSM SMC were transfected with pFLAG-SM22 (12) using Lipofectamine 2000 transfection reagent (Invitrogen, Carlsbad, CA) at a final concentration of 0.5, 1, and 2 μg/ml plasmid DNA. Control SMCs were similarly transfected with empty vector. SMC were further incubated at 37°C with 5% CO2 for 36 h. Likewise, SMC were also transfected with different concentrations of SM22 siRNA (50–200 nM). Control SMC were similarly transfected with scrambled (control) siRNA.
At the end of incubation period, culture medium was removed from the plates, and SMCs were incubated for 5–10 min with 1 ml of 0.05% trypsin-EDTA. SMC were then centrifuged, washed two times with fresh KPS, and then resuspended in KPS, and 104 SMC were suspended in 100 μl of KPS. Lengths of the individual cells were measured by computerized image microscopy. Average length of SMC from different groups was obtained from 50 cells encountered randomly in successive microscopic fields.
Confocal microscopy.
SMC were cultured in culture medium as described above on Lab-Tek II chamber slides (Nulge Nunc, Naperville, IL) at 37°C with 5% CO2 for 24 h. Later, culture medium was removed, and SMC were fixed in 4% paraformaldehyde solution in Dulbecco's phosphate-buffered saline (DPBS) at RT for 15 min. SMCs were washed three times with DPBS and incubated overnight at RT in a humid environment with 1:100 dilution of SM22 primary antibody (raised in rabbit; Santa Cruz Biotechnology) in DPBS containing 0.2% Triton X-100 and 0.5% bovine serum albumin. Later, SMC were washed three times with DPBS and further incubated with Texas red-conjugated anti-rabbit secondary antibody (1:200 dilution in DPBS; Santa Cruz Biotechnology) and fluorescein isothiocyanate-conjugated α-actin antibody (1:800; Sigma Chemical, St. Louis, MO) in DPBS with 0.3% Triton X-100 and 2% donkey serum for 1 h. SMC were then washed three times with DPBS, and chambers were removed from slides. The slides were air-dried, and coverslips were mounted on the slides using Vectashield mounting medium (Vector Laboratories, Burlingame, CA). Fluorescence was analyzed with a Bio-Rad MRC 600 laser-scanning confocal microscope (Zeiss Anxiovert 100; Zeiss, Overkochen, Germany), and images were generated automatically by the imaging software (29).
Chemicals and drugs.
Y-27632 was purchased from Biomol (Plymouth Meeting, PA), and Gö-6850 (bisindolylmaleimide I) was from Tocris Bioscience (Ellisville, MO). The following antibodies were used in this study: SM22, agarose-conjugated actin antibody, and HRP-conjugated rabbit secondary antibodies were obtained from Santa Cruz. α-Actin and FITC-conjugated α-actin antibodies were from Sigma.
Statistical analysis.
Results were expressed as means ± SE from four independent experiments. For the Western blot analysis, values were calculated using Image-Pro Plus 4.0 software (Media Cybernetics) as described previously (26). The relative densities were normalized over total SM22 (for p-SM22) and α-actin (for SM22-actin binding assay). Comparisons between two groups were made by Student's unpaired t-test.
RESULTS
2D-DIGE analysis of the IAS vs. RSM SMC protein samples demonstrated decreased expression of SM22 in the tonic IAS SMC. As shown in Fig. 1, studies have identified three spots (nos. 1262, 1380, and 1381) having accession number 62653429, molecular mass 22.6 kDa, isoelectric point 9.4 and that were downregulated in the IAS (tonic) vs. RSM (phasic). Quantitative differences between IAS vs. RSM revealed an average significant decrease (−1.87) in all three spots in their expression in the IAS SMC. ProteomeX Electrospray Ion-Trap MS analysis of tryptic digests of the three downregulated proteins against NCBI database identified all of these spots to be SM22 as discussed below.
Fig. 1.

Overlaid representative images for 2-dimensional gels (pH 3–10) used in separations of proteins extracted from the internal anal sphincter (IAS) smooth muscle cells (SMC, labeled with Cy5 in red) and rectal smooth muscle (RSM) cells (labeled with Cy3 in green) of the rat. Protein spots with significant quantitative expression differences and that have been identified by ProteomeX Electrospray Ion-Trap mass spectrometry (MS) are circled, numbered, and named (see enlarged inset of actual gel). Spots with the predominant red and green color are highly upregulated in IAS and RSM, respectively. Samples were depleted of actin via precipitation with agarose-conjugated actin antibody before run on the gels. The first dimension was run on an immobilized pH gradient (3–10), and the second dimension resolved on a 12.5% SDS-PAGE. Molecular weight range is shown on the left (y-axis), and pH range is shown at the bottom (x-axis). Individual protein spots showing difference in the expression in IAS vs. RSM as shown in gel with a circle. Three spots showing lower intensity in IAS vs. RSM SMC are identified as transgelin (SM22).
We analyzed the changes in these proteins and determined the role of SM22 in the functionality of the phenotypic tonic vs. phasic SMs, especially how higher expression of SM22 in the RSM keeps it from becoming completely tonic. (In this regard data in Fig. 1 have identified three spots that specifically were downregulated in the IAS vs. RSM SMCs.)
Effects of SM22 overexpression and SM22 silencing on IAS SMC.
As a follow up of proteomic analysis showing discrete differences in the phasic vs. tonic SM with regard to the role of SM22, to gain further insights into the role of SM22 in these phenotypic SMCs, we overexpressed SM22 (using pFLAG-SM22) and silenced SM22 expression (using SM22 siRNA) in these cells and monitored changes in their length for the functional (contraction/relaxation) role in the IAS vs. RSM SMCs.
Transfection of pFLAG-SM22 (0.5–2 μg/ml) concentration dependently and significantly (P < 0.05; n = 4) increased IAS SMC length (indicating SMC relaxation). Maximal relaxation caused by SM22 overexpression in the IAS SMC was 23.8 ± 2.3%. On the other hand, RSM SMC showed only marginal increase in the relaxation following SM22 overexpression, and the maximal relaxation in RSM SMCs was only 5.2 ± 1.7% (Fig. 2A).
Fig. 2.

A: transfection of IAS SMC with pFLAG-SM22 significantly (*P < 0.05; n = 4) and concentration dependently increases the IAS SMC length (considered SMC relaxation), but the increase was not significant (P > 0.05; n = 4) for RSM SMC length. Percent increase in SMC length in pFLAG-SM22 transfected SMC is calculated relative to mean SMC length from the control group of SMC transfected with empty vector. B: SM22 small-interfering RNA (siRNA) causes a concentration-dependent decrease of IAS and RSM SMC length (considered SMC contraction), not significantly different from each other (P > 0.05; n = 4). Percent decrease of SMC length in siRNA-transfected SMC is calculated relative to mean SMC length from control groups (45.6 ± 4.5 and 61.4 ± 5.4 μm in the case of the IAS and RSM, respectively) similarly transfected with control siRNA.
On the other hand SM22 siRNA concentration dependently (50–200 nM) decreased lengths of the IAS and RSM SMC (indicating SMC contraction). Maximal SMC contraction in IAS and RSM SMC was 23.1 ± 1.1 and 26.2 ± 1.5% (Fig. 2B).
Confocal microscopic studies showing the effects of SM22 siRNA on SM22 expression in IAS vs. RSM SMC.
To further confirm the significance of SM22 expression differences in IAS and RSM SMCs, we performed confocal microscopy studies under the treatment of SM22 siRNA. Such studies using SM22 antibody confirmed the success of SM22 siRNA by the decreased expression of SM22 in the IAS and RSM SMC transfected with 200 nM of SM22 siRNA (Fig. 3). Also, in the basal state, data revealed higher immunofluorescence intensity of SM22 in the RSM SMC vs. IAS SMC (Fig. 3), in agreement with the proteomic data for the expression differences. In these studies, α-actin antibody was used as a marker for SMC.
Fig. 3.

A: confocal microscopy reveals immunofluorescence intensity (IFI) levels of actin (a) vs. SM22 (b) in the IAS SMC in control experiments. Incubation of the IAS SMC with SM22 siRNA causes contraction of the SMCs (as indicated in α-actin-stained SMC, c) with decrease in the IFI of SM22 in the IAS SMC (d). B: corresponding data in the RSM SMCs show higher IFI levels of SM22 in control experiments (b) and decrease in the levels of SM22 following SM22 siRNA.
Effects of ROCK inhibitor Y-27632 on phosphorylation of SM22 in the IAS.
Because RhoA/ROCK and PKC pathways have been suggested to be the major determinant of the tonic and phasic SM contractions, respectively (38), it was considered important to determine the effect of inhibitions of these pathways on phospho-SM22. In that regard, we first proceeded to determine the effect of ROCK inhibitor Y-27632.
SM22 was precipitated via immunoprecipitation using SM22 antibody. Precipitates were further analyzed via Western blot analysis using antiphosphoserine antibody to detect phosphorylation of SM22 in vivo. As described in Fig. 4, data revealed higher levels of phospho-SM22 in the IAS vs. RSM SM. In sharp contrast, levels of total SM22 were higher in the RSM vs. IAS. Y-27632 concentration dependently (10−8 to 10−5 M) and significantly (P < 0.05; n = 4) decreased phosphorylation of SM22 in the IAS SM (Fig. 4). Basal levels of SM22 phosphorylation in the IAS SM were considered 100%.
Fig. 4.

Effect of Rho kinase (ROCK) inhibitor Y-27632 (10−8 to 10−5 M) on pser-SM22 in IAS smooth muscle. Y-27632 causes significant (*P < 0.05; n = 4) and concentration-dependent decrease in the phosphorylation of SM22 in the IAS. Phosphorylation of SM22 is almost absent in the RSM. Levels of total SM22 do not show significant change following incubation with Y-27632. Levels of total SM22 are higher in RSM vs. IAS.
Effects of Y-27632 on binding of SM22 to actin in the IAS.
Because SM22 is transgelin or actin-binding protein, it was important to determine the effect of ROCK inhibition in relation to SM22 biding to actin. For that, SM22-actin complexes were coimmunoprecipitated using agarose-bound actin antibody. Complexes were analyzed via Western blot using SM22-specific antibody to determine the levels of actin-bound SM22. Y-27632 concentration dependently (10−8 to 10−5 M) and significantly (P < 0.05; n = 4) increased SM22-actin binding. Conversely, RSM revealed the highest levels of SM22-actin binding (Fig. 5). This confirms the role of SM22 (also known as transgelin) in the actin binding, thus impairing the actin-myosin binding and therefore impeding the development of full tone in the RSM, in the basal state.
Fig. 5.

Effect of ROCK inhibitor Y-27632 (on SM22-actin binding). Y-27632 cause significant (*P < 0.05; n = 4) and concentration-dependent increase in binding of SM22 to actin. Actin-SM22 complexes precipitated by using agarose-conjugated actin antibody and SM22 levels in the precipitates detected via Western blot analysis. Note highest binding of SM22 to actin in the RSM.
Effects of PKC inhibitor on SM22 phosphorylation and SM22-actin binding in the IAS.
To discriminately determine the role of PKC vs. the RhoA/ROCK pathway in relation to the role of SM22 in the tonic and phasic SM phenotypes, we determined the effect of PKC inhibitor, as discussed above. PKC inhibitor Gö-6850 in contrast to the ROCK inhibitor Y-27632 caused no significant (P > 0.05; n = 4) effect on SM22 phosphorylation (Fig. 6). Similarly, SM22-actin binding was not affected by incubation of IAS SM with Gö-6850 (Fig. 7).
Fig. 6.

PKC inhibitor Gö-6850 in contrast with the ROCK inhibitor Y-27632 does not cause significant change in the SM22 phosphorylation in the IAS smooth muscle (P > 0.05; n = 4).
Fig. 7.
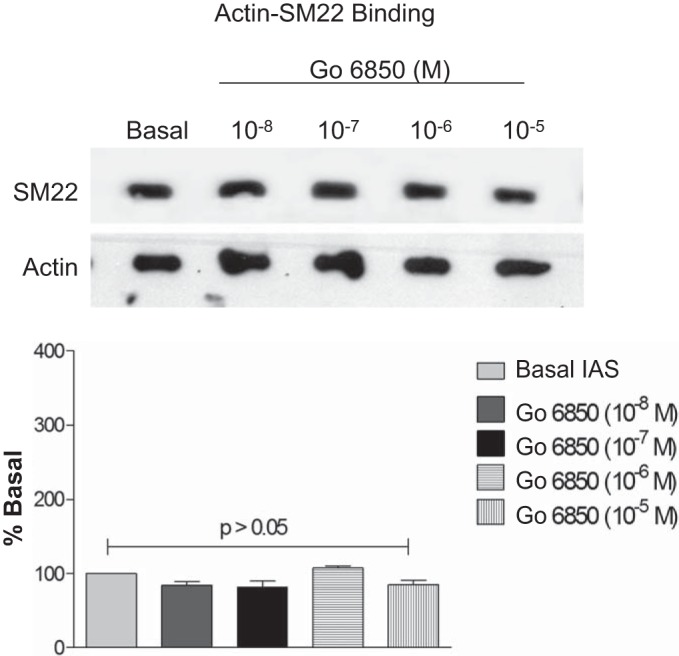
PKC inhibitor Gö-6850 does not cause significant effect on the SM22-actin binding in the IAS smooth muscle (P > 0.05; n = 4).
DISCUSSION
Preliminary studies from our laboratory (for details, see materials and methods) revealed downregulation of SM22 (transgelin/calponin) protein expression in the tonic IAS vs. phasic RSM SMC. Because SM22 plays a significant role in the SM contraction with its role as actin-binding protein (17), in the present investigation, we focused on its mechanistic differential role in developing basal tone within IAS and RSM SMC. SM22-actin binding data reveal lower levels in the IAS vs. RSM. Further studies show that overexpression of wild-type SM22 causes relaxation of IAS SMC. Additionally, silencing of SM22 by SM22 siRNA contracts IAS SMC. Data further show higher levels of SM22 phosphorylation in the IAS vs. RSM. Additional data suggest that SM22 phosphorylation may be ROCK mediated as in the ROCK inhibitor decreases phosphorylation of SM22 and increases its binding to actin in the IAS. Figure 8 in the form of a cartoon illustrates the role of SM22 and p-SM22 in the IAS vs. RSM.
Fig. 8.

A cartoon explaining the role of SM22 in the tonic vs. phasic smooth muscle. In phasic smooth muscles, e.g., RSM (left), SM22 may inhibit actin-myosin interaction via its actin-binding properties. In tonic smooth muscles, e.g., IAS (right), ROCK decreases SM22 binding to actin via phosphorylation of SM22.
The IAS is a purely tonic SM, since it develops spontaneous tone in the absence of any stimulus. The RSM on the other hand is primarily a phasic SM. The comparison of these SMC proteomes provides important clues on the molecular mechanisms for the regulation of basal tone in the tonic SM. Several proteins are known to be differentially expressed between tonic vs. phasic SM. RhoA/ROCK are expressed at higher levels in the tonic vs. phasic SM (25, 26, 38). Previously Szymanski et al. reported higher levels of caldesmon and myosin light chain kinase in the phasic SM of the esophageal body than the LES (tonic) (39, 40). Also Woodsome et al. demonstrated higher levels of CPI-17 and lower levels of myosin light chain phosphatase regulatory/target subunit in tonic (femoral artery) vs. phasic (vas deferens) SM (43).
SM22 is a 22-kDa SM specific cytoskeletal protein that is one of the most abundant proteins in SM. Three isoelectric isoforms of SM22 have been identified as α, β, and γ (21, 22). SM22 has been identified in many different species, including mouse (23), rat (18), bovine (36), and human (5). SM22 has also been described as transgelin (20), WS3–10 (42), and p27 (3). The exact function of SM22 in SMC, however, is not known.
We speculate, higher levels of SM22 in the RSM may have inhibitory effects on the development of basal tone in the RSM. On the other hand, lower expression of SM22 may facilitate development of basal tone in the IAS, as illustrated in Fig. 8. In agreement with this concept, data reveal that overexpression of SM22 in the IAS SMC causes relaxation of these SMCs. However, overexpression of SM22 in the RSM SMC only produced marginal further relaxation, since phasic RSM SMCs are mostly relaxed in their basal state. In sharp contrast silencing of SM22 using SM22-specific siRNA increased contractions in the IAS and RSM SMCs.
SM22 shares a high degree of amino acid sequence homology with thin filament myofibrillar regulatory and also SMC-specific protein calponin (34, 41). Calponin is an actin-binding protein that directly inhibits actin-activated Mg-ATPase activity of myosin. Similar to calponin, SM22 also binds to actin in vitro and in vivo in SMC (12). PKC has been described to phosphorylate SM22 in vitro in certain systems (8, 12). We speculate that, in the basal state of the SMCs, SM22 binds with actin to inhibit actin myosin cross-bridge function, resulting in limited or no tone. Upon phosphorylation, SM22 dissociates itself from actin, leading to the development of the SM tone as the case in IAS. However, there is a dire need for precise studies to substantiate these speculations.
In agreement with this concept, our data show lower levels of total SM22 and higher levels of phosphorylated SM22 in the tonic IAS vs. phasic RSM in the basal state. Phosphorylation of SM22 is almost absent in the RSM. Further studies revealed that ROCK phosphorylates SM22 in the IAS SM in the basal state. ROCK inhibitor Y-27632 concentration dependently decreases phosphorylation of SM22 in the IAS SM strips. However, PKC inhibitor Gö-6850 fails to modify SM22 phosphorylation. These findings are in agreement with the concept that RhoA/ROCK but not PKC plays a major role in the maintenance of IAS basal tone (25, 26, 38). Previously, Gimona et al. reported absence of 32P incorporation to SM22 in the chicken gizzard and guinea pig tenia coli SM (13). However, these studies were limited to the phasic SM.
Unphosphorylated SM22 in the phasic RSM is primarily actin bound. On the other hand, in the IAS, SM22 is primarily in the phosphorylated state, and its binding with actin is minimal. Y-27632 concentration dependently increased SM22-actin binding in the IAS. Interestingly, substitution of Ser181 with aspartic acid [SM22-(S181D)-recombinant SM22 that mimic phosphorylation] decreases SM22-actin binding in tracheal SMC (12).
In summary, as shown in Fig. 8, the present studies for the first time identify that SM22 is characteristically differentially expressed in the basal state of the IAS and RSM. We speculate that SM22, via its actin-binding properties, interferes with actin-myosin interaction, thus inhibiting SM tone development in RSM. Additionally, phosphorylation of SM22 in vivo by ROCK may be involved in the inhibition of SM22-actin interaction leading to the development of basal tone as in the IAS. However, the exact mechanism of SM22-mediated inhibition of SM contractions is not presently known. We further speculate that, in the tonic SM, phosphorylation of SM22 (which removes biding of SM22 with actin) may be ROCK mediated.
GRANTS
This work was supported by National Institute of Diabetes and Digestive and Kidney Diseases Grant RO1-DK-035385 and by an institutional grant from Thomas Jefferson University.
DISCLOSURES
No conflicts of interest, financial or otherwise, are declared by the authors.
AUTHOR CONTRIBUTIONS
S.R. conception and design of research; S.R. and M.A. equally contributed to performing experiments, data analyses and interpretation, preparation of figures, manuscripts' drafts and revisions, and approval of final version of manuscript.
REFERENCES
- 1.Alban A, David SO, Bjorkesten L, Andersson C, Sloge E, Lewis S, Currie I. A novel experimental design for comparative two-dimensional gel analysis: two-dimensional difference gel electrophoresis incorporating a pooled internal standard. Proteomics 3: 36–44, 2003. [DOI] [PubMed] [Google Scholar]
- 2.Ali M, Umstead TM, Haque R, Mikerov AN, Freeman WM, Floros J, Phelps DS. Differences in the BAL proteome after Klebsiella pneumoniae infection in wild type and SP-A−/− mice. Proteome Sci 8: 1–18, 2010. [DOI] [PMC free article] [PubMed] [Google Scholar]
- 3.Almendral JM, Santaren JF, Parera J, Zerial M, Bravo R. Expression, cloning and cDNA sequence of a fibroblast serum-regulated gene encoding a putative actin-associated protein (p27). Exp Cell Res 181: 518–530, 1989. [DOI] [PubMed] [Google Scholar]
- 4.Biancani P, Sohn UD, Rich HG, Harnett KM, Behar J. Signal transduction pathways in esophageal and lower esophageal sphincter circular muscle. Am J Med Suppl 103: 23S–28S, 1997. [DOI] [PubMed] [Google Scholar]
- 5.Camoretti-Mecado B, Forsythe SM, LeBeau MM, Espinosa R, Vieira JE, Halayko AJ, Willadsen S, Ober C, Evan GA, Thweatt R, Shapiro S, Niu Q, Qin Y, Padrid PA, Solway J. Expression and cytogenetic localization of the human SM22 gene (TAGLN). Genomics 49: 452–457, 1998. [DOI] [PubMed] [Google Scholar]
- 6.Choudhury N, Khromov AS, Somlyo AP, Somlyo AV. Telokin mediates Ca2+-desensitization through activation of myosin phosphatase in phasic and tonic smooth muscle. J Muscle Res Cell Motil 25: 657–665, 2004. [DOI] [PubMed] [Google Scholar]
- 7.Culver PJ, Rattan S. Genesis of anal canal pressures in the opossum. Am J Physiol Gastrointest Liver Physiol 251: G765–G771, 1986. [DOI] [PubMed] [Google Scholar]
- 8.Dammeler S, Lovric J, Eulitz M, Kolch W, Mushinski JF, Mischak H. Identification of the smooth muscle-specific protein, sm22 as a novel protein kinase C substrate using two-dimensional gel electrophoresis and mass spectrometry. Electrophoresis 21: 2443–2453, 2000. [DOI] [PubMed] [Google Scholar]
- 9.Dirksen WP, Vladic G, Fisher SA. A myosin phosphatase targeting subunit isoform transition defines a smooth muscle developmental phenotypic switch. Am J Physiol Cell Physiol 278: C589–C600, 2000. [DOI] [PubMed] [Google Scholar]
- 10.Freeman WM, Brebner K, Amara SG, Reed MS, Pohl J, Phillips AG. Distinct proteomic profiles of amphetamine self-administration transitional states. Pharmacogenomics J 5: 203–214, 2005. [DOI] [PubMed] [Google Scholar]
- 11.Freeman WM, Hemby SE. Proteomics for protein expression profiling in neuroscience. Neurochem Res 29: 1065–1081, 2004. [DOI] [PMC free article] [PubMed] [Google Scholar]
- 12.Fu Y, Liu HW, Forsythe SM, Kogot P, McConville JF, Halayko AJ, Camoretti-Mecado B, Solway J. Mutagenesis analysis of human SM22: characterization of actin binding. J Appl Physiol 89: 1985–1990, 2000. [DOI] [PubMed] [Google Scholar]
- 13.Gimona M, Sparrow MP, Strasser P, Herzog M, Small JV. Calponin and SM22 isoforms in avian and mammalian smooth muscle Absence of phosphorylation in vivo. Eur J Biochem 205: 1067–1075, 1992. [DOI] [PubMed] [Google Scholar]
- 14.Golenhofen K, Mandrek K. Phasic and tonic contraction processes in the gastrointestinal tract. Dig Dis Sci 9: 341–346, 1991. [DOI] [PubMed] [Google Scholar]
- 15.Gong MC, Cohen P, Kitazawa T, Ikebe M, Masuo M, Somlyo AP, Somlyo AV. Myosin light chain phosphatase activities and the effects of phosphatase inhibitors in tonic and phasic smooth muscle. J Biol Chem 267: 14662–14668, 1992. [PubMed] [Google Scholar]
- 16.Graves PR, Haystead TAJ. A functional proteomic approach to signal transduction. Recent Prog Horm Res 58: 1–24, 2003. [DOI] [PubMed] [Google Scholar]
- 17.Jiang Y, Yin H, Zheng XL. MicroRNA-1 inhibits myocardin-induced contractility of human vascular smooth muscle cells. J Cell Physiol 225: 506–511, 2010. [DOI] [PubMed] [Google Scholar]
- 18.Kemp PR, Osbourn JK, Grainger DJ, Metcalf JC. Cloning and analysis of the promoter region of the rat SM22 alpha gene. Biochem J 310: 1037–1043, 1995. [DOI] [PMC free article] [PubMed] [Google Scholar]
- 19.Khalil RA, Lajoie C, Resnick MS, Morgan KG. Ca2+-independent isoforms of protein kinase-C differentially translocate in smooth muscle. Am J Physiol Cell Physiol 263: C714–C719, 1992. [DOI] [PubMed] [Google Scholar]
- 20.Lawson D, Harrison M, Shapland C. Fibroblast transgelin and smooth muscle SM22 alpha are the same protein, the expression of which is down-regulated in many cell lines. Cell Motil Cytoskeleton 38: 250–257, 2012. [DOI] [PubMed] [Google Scholar]
- 21.Lees-Miller JP, Heeley DH, Smillie LB. An abundant and novel protein of 22 kDa (SM22) is widely distributed in smooth muscles. Purification from bovine aorta. Biochem J 244: 705–709, 1987. [DOI] [PMC free article] [PubMed] [Google Scholar]
- 22.Lees-Miller JP, Heeley DH, Smillie LB, Kay CM. Isolation and characterization of an abundant and novel 22 kDa protein (SM22) from chicken gizzard smooth muscle. J Biol Chem 262: 2988–2993, 1987. [PubMed] [Google Scholar]
- 23.Leinweber BD, Leavis PC, Grabarek Z, Wang CLA, Morgan KG. Extracellular regulated kinase (ERK) interaction with actin and the calponin homology (CH) domain of actin-binding proteins. Biochem J 344: 117–123, 1999. [PMC free article] [PubMed] [Google Scholar]
- 24.North AJ, Gimona M, Lando Z, Small JV. Actin isoform compartments in chicken gizzard smooth muscle cells. J Cell Sci 107: 445–455, 1994. [DOI] [PubMed] [Google Scholar]
- 25.Patel CA, Rattan S. Spontaneously tonic smooth muscle has characteristically higher levels of RhoA/ROK compared with the phasic smooth muscle. Am J Physiol Gastrointest Liver Physiol 291: G830–G837, 2006. [DOI] [PubMed] [Google Scholar]
- 26.Patel CA, Rattan S. Cellular regulation of basal tone in internal anal sphincter smooth muscle by RhoA/ROCK. Am J Physiol Gastrointest Liver Physiol 292: G1747–G1756, 2007. [DOI] [PubMed] [Google Scholar]
- 27.Rattan S. The internal anal sphincter: regulation of smooth muscle tone and relaxation. Neurogastroenterol Motil 17: 50–59, 2005. [DOI] [PubMed] [Google Scholar]
- 28.Rattan S, Chakder S. Role of nitric oxide as a mediator of internal anal sphincter relaxation. Am J Physiol Gastrointest Liver Physiol 262: G107–G112, 1992. [DOI] [PubMed] [Google Scholar]
- 29.Rattan S, De Godoy MAF, Patel CA. Rho kinase as a novel molecular therapeutic target for hypertensive internal anal sphincter. Gastroenterology 131: 108–116, 2006. [DOI] [PubMed] [Google Scholar]
- 30.Rattan S, Patel CA. Selectivity of ROCK inhibitors in the spontaneously tonic smooth muscle. Am J Physiol Gastrointest Liver Physiol 294: G687–G693, 2008. [DOI] [PubMed] [Google Scholar]
- 31.Rattan S, Regan RF, Patel CA, De Godoy MAF. Nitric oxide not carbon monoxide mediates nonadrenergic noncholinergic relaxation in the murine internal anal sphincter. Gastroenterology 129: 1954–1966, 2005. [DOI] [PubMed] [Google Scholar]
- 32.Rattan S, Singh J. RhoA/ROCK pathway is the major molecular determinant of basal tone in intact human internal anal sphincter. Am J Physiol Gastrointest Liver Physiol 302: G664–G675, 2012. [DOI] [PMC free article] [PubMed] [Google Scholar]
- 33.Sakai J, Ishikawa H, Satoh H, Yamamoto S, Kojima S, Kanaoka M. Two-dimensional differential gel electrophoresis of rat heart proteins in ischemia and ischemia-reperfusion. Methods Mol Biol 357: 33–43, 2007. [DOI] [PubMed] [Google Scholar]
- 34.Samaha FF, Ip HS, Morrisey EE, Seltzer J, Tang ZH, Solway J, Parmacek MS. Developmental pattern of expression and genomic organization of the calponin-h1 gene: a contractile smooth muscle cell marker. J Biol Chem 271: 395–403, 1996. [DOI] [PubMed] [Google Scholar]
- 35.Schiller LR. Fecal incontinence. In: Sleisenger & Fordrtran's Gastrointestinal and Liver Disease, edited by Feldman M. Philadelphia, PA: Saunders, 2002. [Google Scholar]
- 36.Shishibori T, Yamashita K, Bandoh J, Oyama Y, Kobayashi R. Presence of Ca2+ -sensitive and -insensitive SM22 alpha isoproteins in bovine aorta. Biochem Biophys Res Commun 229: 225–230, 1996. [DOI] [PubMed] [Google Scholar]
- 37.Singh J, Mehendiratta V, Del Galdo F, Jimenez SA, Cohen S, DiMarino AJ, Rattan S. Immunoglobulins from scleroderma patients inhibit the muscarinic receptor activation in internal anal sphincter smooth muscle cells. Am J Physiol Gastrointest Liver Physiol 297: G1206–G1213, 2009. [DOI] [PMC free article] [PubMed] [Google Scholar]
- 38.Singh J, Rattan S. Role of PKC and RhoA/ROCK pathways in the spontaneous phasic activity in the rectal smooth muscle. Am J Physiol Gastrointest Liver Physiol 304: G723–G731, 2013. [DOI] [PMC free article] [PubMed] [Google Scholar]
- 39.Szymanski PT, Chacko TK, Rovner AS, Goyal RK. Differences in contractile protein content and isoforms in phasic and tonic smooth muscles. Am J Physiol Cell Physiol 275: C684–C692, 1998. [DOI] [PubMed] [Google Scholar]
- 40.Szymanski PT, Szymanska G, Goyal RK. Differences in calmodulin and calmodulin-binding proteins in phasic and tonic smooth muscles. Am J Physiol Cell Physiol 282: C94–C104, 2002. [DOI] [PubMed] [Google Scholar]
- 41.Takahashi K, Nadal-Ginard B. Molecular cloning and sequence analysis of smooth muscle calponin. J Biol Chem 266: 13284–13288, 1991. [PubMed] [Google Scholar]
- 42.Thweatt R, Lumpkin CK, Goldstein S. A novel gene encoding a smooth muscle protein is overexpressed in senescent human fibroblasts. Biochem Biophys Res Commun 187: 1–7, 1992. [DOI] [PubMed] [Google Scholar]
- 43.Woodsome TP, Eto M, Everett A, Brautigan DL, Kitazawa T. Expression of CPI-17 and myosin phosphatase correlates with Ca2+ sensitivity of protein kinase C-induced contraction of rabbit smooth muscle. J Physiol (Lond) 535: 553–564, 2001. [DOI] [PMC free article] [PubMed] [Google Scholar]