Abstract
Background:
Robust markers that predict prognosis and detect early treatment response in malignant pleural mesothelioma (MPM) would enhance patient care.
Methods:
Consecutive patients with MPM who were considered fit for first-line chemotherapy were prospectively recruited. Patients of similar performance status opting for best supportive care were included as a comparator group. Baseline and interval CT, PET-CT and serum markers (mesothelin, fibulin-3 and neutrophil–lymphocyte ratio (NLR)) were obtained, and patients followed up for a minimum 12 months.
Findings:
Seventy-three patients were recruited (58 chemotherapy/15 comparator arm). Baseline TGV (total glycolytic volume on PET-CT) was an independent predictor of worse overall survival (OS) (P=0.001). Change in interval TGV(baseline/after two cycles of chemotherapy) did not predict OS or chemotherapy response on CT. Baseline NLR<4 was an independent predictor of better OS (median survival 453 (IQR 272–576) days vs NLR⩾4, 257 (IQR 147–490), P=0.002). Although baseline serum mesothelin did not predict OS, a falling level at 8 weeks significantly predicted longer time to progression (TTP) (P<0.001).
Interpretation:
Neutrophil–lymphocyte ratio and baseline TGV predict prognosis in malignant pleural mesothelioma (MPM), but PET-CT is unhelpful in monitoring chemotherapy response. Serum mesothelin is a useful early treatment response marker when measured serially during chemotherapy and may have a role in evaluating patients' treatment response.
Malignant pleural mesothelioma (MPM) remains a universally fatal neoplasm with a median life expectancy of 9–14 months following diagnosis (Yates et al, 1997; Chapman et al, 2009).
In 2008, the National Institute for Health and Care Excellence (NICE) recommended the use of chemotherapy with pemetrexed and cisplatin for the palliative treatment of mesothelioma in England and Wales and this remains the first-line chemotherapy regimen of choice in patients with good performance status (Vogelzang et al, 2003; NICE (2008), HTA No. 135).
With variable clinical responses to pemetrexed and cisplatin in MPM and common associated adverse effects (particularly nausea, fatigue and haematological toxicity) (Vogelzang et al, 2003), patient selection for treatment, individualised prognostic information at diagnosis and early disease response evaluation are important areas about which little is currently established.
The most widely used method of chemotherapy response evaluation for MPM in a clinical trial setting is serial CT scanning, using the modified RECIST criteria (Nowak, 2005). Although the modified RECIST method has been shown to correlate with survival in patients receiving chemotherapy, it does not make a full assessment of the circumferential growth pattern of MPM, and high levels of interobserver variability have been reported (Armato et al, 2004; Byrne and Nowak, 2004). Volumetric assessment of CT may be superior to the modified RECIST (Guntulu et al, 2010), but both methods are labour intensive and probably not of universal applicability to clinical practice.
Metabolic imaging with PET-CT using a composite output value incorporating 18FDG uptake and tumour volume (total glycolytic volume (TGV)), serum biomarkers including mesothelin and fibulin-3 and measures of systemic inflammation such as the NLR have all been the subject of preliminary research as markers of prognosis or treatment response in MPM (Francis et al, 2007; Grigoriu et al, 2008; Creaney et al, 2010; Kao et al, 2010; Nowak et al, 2010; Veit-Haibach et al, 2010; Pass et al, 2012; Creaney et al, 2014).
The SWAMP trial was designed to systematically and prospectively examine the value of serum biomarkers, NLR and TGV measured by PET-CT, with correlation of markers to disease response, survival and quality of life.
Materials and methods
Study design
Multicentre prospective observational parallel cohort study evaluating biomarkers and novel imaging techniques as predictors of mesothelioma tumour response to first-line chemotherapy (pemetrexed and cisplatin/carboplatin). The trial incorporated a self-selecting ‘comparator' group of patients of similar performance status who declined chemotherapy after consultation with an oncologist. Randomisation to a ‘no-chemotherapy' arm was considered unethical by the investigators on the basis of the previous published data and NICE guidance.
Study setting and enrolment
Subjects were screened from normal clinical practice following discussion in the regional mesothelioma multidisciplinary team meeting. Patients were enrolled from oncology clinics of seven hospitals in the South West of the United Kingdom (North Bristol NHS Trust, University Hospitals Bristol NHS Foundation Trust, Royal United Hospital Bath, Gloucestershire Hospitals Foundation Trust, Taunton and Somerset NHS Foundation Trust, Great Western NHS Foundation Trust Swindon and Weston General Hospital). Inclusion criteria were histologically proven MPM and sufficient performance status and medical history to consider first-line chemotherapy. Patients were excluded if the estimated life expectancy was <3 months, there was previous or planned debulking surgery or there was no measurable pleural thickening on baseline CT imaging to allow assessment of the primary end point (Supplementary Information 1 online).
Standard care and baseline tests
Patients had a staging CT within 12 weeks of trial entry before any chemotherapy and underwent a standard oncology clinical assessment. Patients who opted for chemotherapy received pemetrexed and cisplatin or carboplatin, up to a maximum of six cycles at 21-day intervals according to a standardised regimen (Supplementary Information 2 online). Patients opting for best supportive care without chemotherapy were offered inclusion in the comparator arm.
Trial interventions
Consented patients underwent a PET-CT scan at baseline and again after two cycles of chemotherapy (or a 6- to 8-week interval in the non-chemotherapy comparator arm). Positron emission tomography-computed tomography methodology is given in Supplementary Information 3 online. A standard thorax and abdomen CT was performed following three cycles of chemotherapy, and at 4, 9 and 12 months after recruitment. Neutrophil–lymphocyte ratio (NLR) was recorded at baseline. Blood was stored for mesothelin and fibulin-3 assay at recruitment, after two cycles and at completion of chemotherapy (or equivalent timings in the comparator arm). All patients were followed up for a minimum of 12 months or until death, with recording of clinical data. All scans were double reported by consultant radiologists who were blind to clinical data. Health-related quality of life (HRQoL) data was recorded at 5 time-points (baseline, 6 weeks, 4 months, 12 months and 18 months). Three HRQoL questionnaires were used: the EQ-5D, EORTC QLQ-C30 and EORTC LC13. Health-related quality of life data is presented separately (Arnold et al, 2015).
Trial outcomes
Primary end point
The primary end point was defined as the difference in time to progression (TTP) on serial CT scans. This was compared between patients demonstrating a metabolic response (MR) to chemotherapy on interval PET-CT after two cycles of chemotherapy vs those demonstrating no MR.
Time to progression: TTP was defined by the modified RECIST criteria as the time to a 20% or greater increase in linear measurement of pleural tumour compared with baseline on CT (Nowak, 2005).
Metabolic responder: MR was defined as a decrease in TGV on interval PET-CT of 30% or more (Francis et al, 2007).
Secondary end points
The secondary outcomes were:
Relationship between overall survival (OS), baseline PET-CT parameters, MR on PET-CT (TGV) and baseline and interval biomarkers.
Correlation of interval biomarkers and PET-CT parameters to TTP on CT.
Data analysis and preparation of the manuscript
A written analysis plan, including pre hoc decisions on subgroups to be analysed, was finalised by the trial steering committee before data analysis. As per a prespecified analysis plan, those subjects who did not receive both PET-CT scans, at least two cycles of chemotherapy and a 2-month CT scan, were excluded from the primary end-point analysis (as these parameters were all necessary for the primary outcome measurement) but included in all other analyses.
The comparator group was used to examine the interval behaviour of the radiographic and biomarkers examined in the absence of systemic anticancer treatment.
Statistical analysis and sample size
The study was powered to examine the association between MR and TTP status using standard tests of association (Pearson's χ2 test of association, Fisher' exact test). A minimum sample size of n=58 in the chemotherapy arm would be needed to detect a medium to large effect size (odds ratio=6) with 80% power using standard levels of significance (α=0.05) assuming uniform marginal probabilities. The nonparametric Mantel–Cox log-rank test was used in a Kaplan–Meier survival analysis to investigate the relationship between potential biomarkers and OS. Censoring (due to death and loss to follow-up) occurred at the time of data analysis with all patients receiving a minimum of 12 months follow-up. Censored patients are marked on all Kaplan–Meier curves presented. Cox proportional hazards survival analysis was used to evaluate the independent and joint multivariate effects of histological subtype and baseline measures of TGV and neutrophil lymphocyte ratio on OS. Data imputation for any missing values was not used.
Trial funding and support
The trial was funded through an unrestricted education grant from the Cobalt Appeal Fund, Cheltenham, UK.
Ethical approval and registration
Ethical and regulatory approval for the study was obtained before recruitment commenced (UK REC Reference: 08/H0102/46). The trial was registered in the national portfolio (UKCRN ID: 8450).
Results
Patients
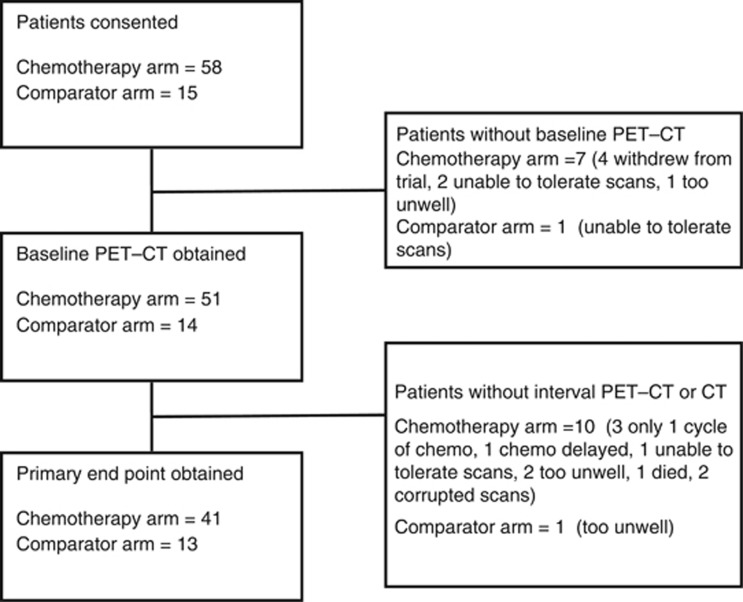
Seventy-three patients were recruited between September 2008 and December 2011. Patient enrolment, withdrawal and primary end-point acquisition is summarised in Figure 1. Median time from diagnosis to trial entry was 11 days (IQR 7–44). Of the enrolled patients, 63 (86%) were male, and 50 (68%) had epithelioid subtype histology. Baseline characteristics of all enrolled patients are summarised in Table 1.
Figure 1.
Patient enrolment, withdrawal and primary end point acquisition.
Table 1. Baseline patient characteristics (including all enrolled patients).
| Chemotherapy arm | Comparator arm | |
|---|---|---|
| Number of patients | 58 | 15 |
| Age: median (IQR) | 69 (65–73) | 77 (68–80) |
| Male:female | 52:6 | 11:4 |
|
Histology | ||
| Epithelioid | 39 (67%) | 11 (73%) |
| Biphasic | 4 (7%) | 0 (0%) |
| Sarcomatoid | 15 (26%) | 4 (26%) |
|
Mode of biopsy | ||
| CT guided | 24 (41%) | 8 (53%) |
| LAT | 19 (33%) | 5 (33%) |
| VATS | 15 (26%) | 2 (13%) |
|
WHO PS | ||
| 0 | 17 (29%) | 2 (13%) |
| 1 | 37 (64%) | 11 (73%) |
| 2 | 4 (7%) | 2 (13%) |
| Talc pleurodesis before trial entry | 21 (36%) | 6 (40%) |
| Body mass index (BMI), mean (SD) | 26.5 (3.3) | 24.5 (3.6) |
|
CT IMIG TMN stage | ||
| I | 7 (12%) | 1 (7%) |
| II | 4 (7%) | 1 (7%) |
| III | 28 (48%) | 6 (40%) |
| IV | 19 (33%) | 7 (47%) |
Abbreviations: BMI=body mass index; CT=computed tomography; IMIG=International Mesothelioma Interest Group; IQR=interquartile range; LAT=limited axillary thoracotomy; PS=performance status; TMN=tumour node metastasis; VATS=Video-assisted thoracoscopic surgery; WHO, World Health Organisation.
Patient characteristics at baseline (including all enrolled patients).
Clinical outcomes
Median survival from consent to death in the chemotherapy group was 368 days (IQR 195–526) and in the comparator group 325 days (IQR 176–458) equating to 12.3 and 10.8 months, respectively (P=0.401). The number of chemotherapy cycles delivered was determined by oncologists using standard clinical assessment without access to serum biomarkers or PET-CT TGV. Eighty-seven per cent of patients in the chemotherapy group received two or more cycles, 64% received four or more cycles and 36% received six cycles.
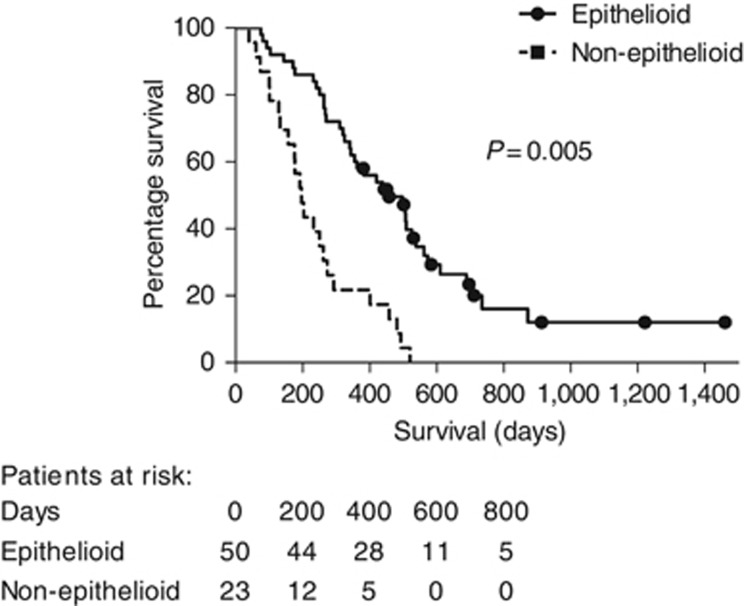
Histological subtype was a strong independent predictor of survival in the group as a whole, with epithelioid histology associated with a median survival of 456 (IQR 303–609) days, compared with 197 (IQR 155–239) days in patients with non-epithelioid histology (HR 0.17; 95% CI: 0.08–0.35; χ2=23.10; d.f.=1; P< 0.001; see Figure 2).
Figure 2.
Survival (days from trial entry to death) comparing epithelioid and non-epitheliod histological subtypes among all enrolled patients (n=73).
In patients receiving chemotherapy, 13% had a partial response, 41% stable disease and 46% progressive disease on CT scan by the modified RECIST criteria after three cycles of chemotherapy. Overall survival in chemotherapy patients with progression on CT was 311 (IQR 177–458) days compared with 520 (IQR 291–584) days in patients with CT-stable or -responsive disease. In the comparator group, 86% had progressive disease and 14% stable disease on CT at the equivalent time point with OS of 270 (IQR 177–458) days given disease progression and 625 (IQR 398–792) days given disease stability.
Primary end point
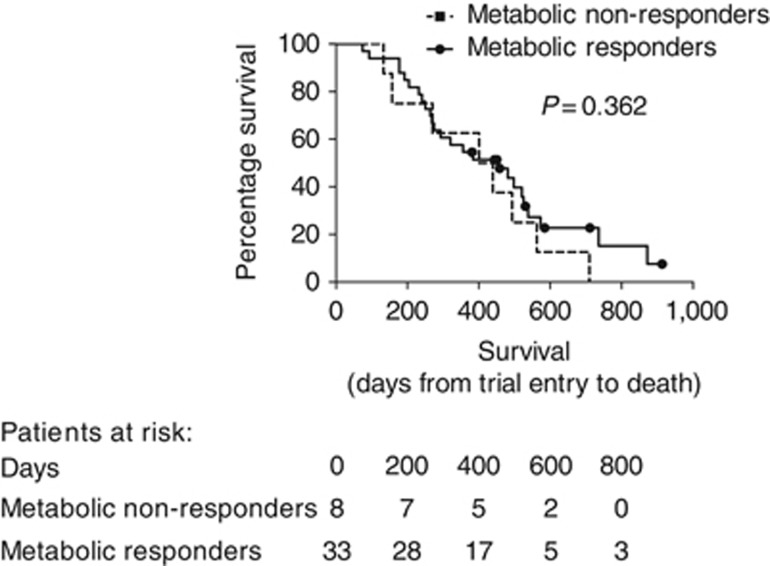
Forty-one patients in the chemotherapy group were included in the primary end point analysis. Thirty-three out of 41 (80%) were classified as metabolic responders on interval PET-CT (30% or greater fall in TGV). The median fall in TGV in the chemotherapy group was 60%. There was no significant difference between the MR and non-MR group in TTP on interval CT at 2 months (after three cycles of chemotherapy) (P=0.429) or 4 months (P=0.703). There remained no significant difference in TTP independent of histological subtype and when considering an alternative fall in TGV of 60% or 70% in the definition of MR.
Median OS was not significantly higher in the MR group (456 (IQR 254–657) days) compared with the non-MR group (401 (IQR166–635) days) (P=0.362) (see Figure 3).
Figure 3.
Survival in chemotherapy patients (who were included in the primary end point analysis n=41), classified as metabolic responders (⩾30% reduction in TGV) and non-responders (<30% fall in TGV).
Secondary end points
Radiographic markers
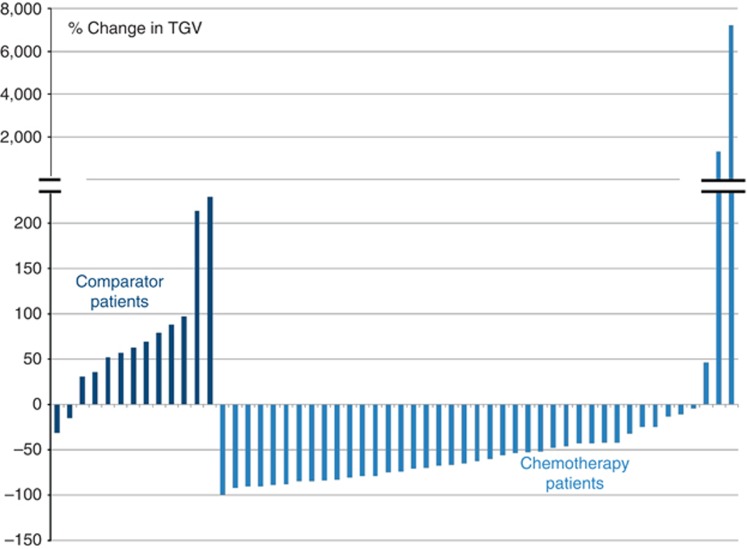
Higher values of all baseline PET-CT parameters were significantly associated with shorter survival. Considering a division at the median TGV of 1800, in the chemotherapy group, patients with a baseline TGV⩾1800 had a significantly shorter median survival of 266 (IQR 180–479) days compared with 456 (IQR 266–653) days in patients with TGV <1800 (HR 3.00; 95% CI: 1.53–5.88; χ2=13.53; d.f.=1; P=0.001). Total glycolytic volume was independently predictive of survival in a multivariable Cox proportional hazards model including histological subtype (P<0.001). Data are given in online Supplementary Information 4. Total glycolytic volume fell between baseline and the 6-week PET-CT in 38 out of 41 (93%) chemotherapy patients and 2 out of 13(15%) comparator patients for whom interval PET-CT scans were available (see Figure 4).
Figure 4.
Percentage change in TGV between baseline and 6-week PET-CT scan in comparator (n=13) and chemotherapy (n=41) patients for whom interval PET-CT scans were available.
Percentage change in TGV was not significantly associated with survival (P=0.726) or TTP at any time point.
Among all patients undergoing a PET-CT scan at baseline, 26 out of 63 (41%) had received talc pleurodesis before trial entry. Baseline PET-CT parameters were not significantly different between patients with and those without prior talc pleurodesis.
Of the chemotherapy patients who underwent interval PET-CT scanning following two cycles of chemotherapy, 17 out of 41 (41%) had undergone talc pleurodesis. There was no significant difference in change in SUVmax (P=0.517) or TGV (P=0.229) between those with and without prior talc pleurodesis. Data are given in Supplementary Information 5 online. The primary outcome was unchanged by the exclusion of patients who had received prior talc pleurodesis.
Biomarkers
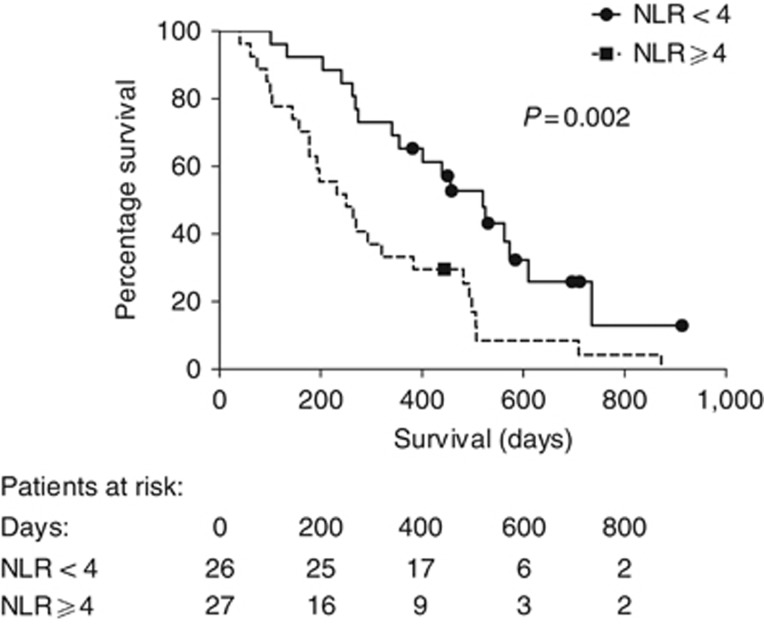
Neutrophil–lymphocyte ratio: In the whole group, median NLR at baseline was 4.0 (IQR 3.1–6.4). Neutrophil–lymphocyte ratio did not differ significantly between histological subgroups (P=0.40). An NLR <4.0 was a strong predictor of better survival (chemotherapy group: NLR<4.0, median survival 453 (IQR 272–576) days vs NLR⩾4, 257 (IQR 147–490) (HR 0.38; 95% CI: 0.20–0.71; χ2=9.28; d.f.=1; P=0.002) as shown in Figure 5. The same was true of the comparator group and was true in a multivariable Cox proportional hazards model including histological subtype and TGV; NLR was an independent predictor of OS (P=0.01).
Figure 5.
Survival in days from trial entry to death in chemotherapy patients with NLR <4 and NLR≥4 (all chemotherapy patients with baseline NLR available are included, n=53).
Baseline NLR also significantly predicted TTP in the whole group and chemotherapy subgroup.
Serum mesothelin: Median serum mesothelin was 4.2 nM (IQR 2.65–9.88) in patients with epithelioid subtype histology and 1.36 nM (IQR 0.78–1.92) with non-epithelioid histology (P<0.001). In the chemotherapy group, serum mesothelin at baseline was not significantly associated with survival when considering a median division (P=0.196).Baseline mesothelin was positively correlated with disease burden on initial CT using the modified RECIST criteria (Spearman's rank correlation coefficient=0.446 (P=0.002).
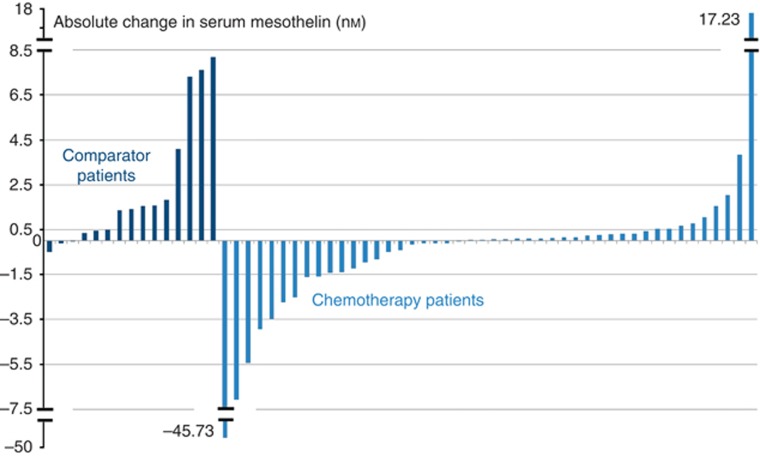
A falling mesothelin level between baseline and 6–8 weeks (after two cycles of chemotherapy) was significantly associated with longer TTP (P<0.001). A falling mesothelin level between baseline and completion of chemotherapy (15–17 weeks) was significantly associated with longer OS (481 days (IQR 192–525) compared with those with a rising level (293 days (IQR 204–493) (HR 0.46; 95% CI: 0.22–0.93; χ2=4.66; d.f.=1; P=0.031) (Table 2, Figure 6 and Supplementary Information 6online). Sensitivity analysis, in which patients with a low mesothelin (<1 nM) level at baseline were included and excluded, did not alter these results, neither did defining thresholds for a rising or falling mesothelin.
Table 2. Time to progression on CT in chemotherapy patients with falling or stable mesothelin compared with rising mesothelin at 6–8 weeks.
| Time point CT modified RECIST report | Fall or stable serum mesothelin Number (%) | Rise in serum mesothelin Number (%) | Significant difference |
|---|---|---|---|
|
7–9 weeks (after three cycles) | |||
| Progression | 5/20 (25%) | 15/25 (60%) | P=0.002 |
| No progression | 15/20 (75%) | 10/25 (40%) | OR 7.50 (2.15–26.18) |
|
15–17 weeks (after chemo) | |||
| Progression | 6/20 (30%) | 18/25 (72%) | P< 0.001 |
| No progression | 14/20 (70%) | 7/25 (28%) | OR 15.71 (3.22–71.41) |
Abbreviations: CT=computed tomography; OR=odds ratio; RECIST=Response Evaluation Criteria In Solid Tumours.
All chemotherapy patients with interval CT and interval mesothelin data available are included, n=45.
Figure 6.
Change in serum mesothelin (nM) between baseline and 6–8 weeks in the comparator (n=15) and chemotherapy (n=46) groups (all patients with serial mesothelin results available are included).
Fibulin-3: Considering chemotherapy and comparator patients together, baseline median plasma fibulin-3 was 21.17 ng ml−1 (IQR 13.46–34.41). Higher baseline plasma fibulin-3 was observed in patients with epithelioid histology when compared with non-epithelioid histology, and in the group as a whole, higher levels were significantly associated with longer survival when a median split was used (P=0.044). However, survival differences were not observed in either subgroup when epithelioid and non-epithelioid subjects were analysed separately. Interval change in fibulin-3 was not associated with survival (P=0.972) or TTP at 2 months (P=0.288) or 4 months (P=0.57). Fibulin-3 did not prove useful in predicting response to treatment.
Discussion
This is the first prospective, cohort study of patients with newly diagnosed MPM receiving national guideline-driven chemotherapy or best supportive care within the United Kingdom, to examine the utility of PET-CT parameters, NLR and serum mesothelin in prognostication and treatment response evaluation. Our results have demonstrated that PET-CT at baseline predicts prognosis, as does NLR, but these data do not support the use of PET-CT as a tool to predict treatment response in mesothelioma.
It is notable that chemotherapy with pemetrexed and cis/carboplatin was well tolerated in this series, with 64% patients who opted to have treatment receiving four or more cycles. Quality of life data from this series is published separately in the same issue of this journal (Arnold et al, 2015).
We have demonstrated that PET-CT parameters strongly and independently predict survival in patients with MPM when measured at baseline. A TGV greater than the median (1800) in patients receiving chemotherapy is associated with a median survival of 9 months, compared with 16 months when the TGV is <1800. In this study, a fall in TGV after two cycles of chemotherapy was not of prognostic value, after removing those who had had a talc pleurodesis. Therefore, the routine use of serial PET-CT in treatment response monitoring is not indicated.
Recent studies have also demonstrated an association between baseline PET-CT parameters and survival. Nowak et al (2010) examined prognostic markers in 89 patients with MPM undergoing a range of management strategies and found TGV greater than the median to predict worse survival in patients with non-sarcomatoid histology but that sarcomatoid subtype was the strongest predictor of poor survival. Lee et al (2010) examined a similar semiquantitative volume-based PET-CT parameter, the total lesion glycolyis (TLG) in 13 patients undergoing surgery or palliative chemotherapy, demonstrating good performance in predicting TTP on CT.
Two previous published studies have scrutinised volume-based semiquantitative analysis of serial PET-CT scans as an early treatment response indicator in MPM. Francis et al (2007) performed PET-CT with TGV in 20 patients receiving cisplatin and gemcitabine, before and after the first cycle of chemotherapy, and demonstrated a significantly greater fall in TGV in seven patients with a partial response on CT compared those with CT stable disease in addition to an association between percentage change in TGV and improved survival. Most recently, Veit-Haibach et al (2010) examined PET-CT with TLG in 41 patients receiving either first- or second-line chemotherapy (seven patients having undergone prior surgical management), reporting a significant association between percentage fall in TLG after three cycles of chemotherapy and improved survival.
In our series, TGV fell in 93% of patients receiving chemotherapy and increased in 85% of comparator patients at 6 weeks, but MR, absolute or percentage change in TGV did not predict TTP on CT or OS. The particularly robust radiographic processes that were applied in this study suggest that this is a true finding. The most plausible explanation is that an early MR to chemotherapy is not sustained or translated into pleural tumour stability as measured by interval CT. It is now recognised that chemotherapeutic agents cause a transient change in glucose metabolism within some tumour cells, resulting in reduced FDG uptake in an effect known as ‘stunning', with an unknown duration of persistence (Engles et al, 2006). Stunning is one potential explanation for reduced measured PET-CT parameters without correlation to sustained treatment response or survival.
An NLR <4 strongly and independently predicts better survival and progression-free survival in our study patients in both the chemotherapy and comparator groups. There was nearly 7 months greater median survival in the low baseline NLR patients when considering the chemotherapy group.
Systemic inflammation in patients with malignancy is considered to reflect the cytokine profile produced both by the tumour and as a component of the host response to it. Increased levels of systemic inflammation has been shown to correlate to worse survival and poor response to treatment in a number of solid organ tumours (Proctor et al, 2010; Roxburgh and McMillian, 2010). Increased NLR has been specifically evaluated in non-small-cell lung cancer and colorectal carcinoma and shown to be an independent predictor of poor prognosis (Walsh et al, 2005; Sarraf et al, 2009). There is evidence that the production of proinflammatory cytokines by mesothelioma cells is a major driving force for tumour progression (Fitzpatrick et al, 1995) and immunotherapy; targeting aspects of the inflammatory response to MPM may form an important component of future therapeutic strategies. Neutrophil–lymphocyte ratio has been studied retrospectively by Kao et al (2010, 2011) in two series of patients with MPM receiving systemic therapy and those undergoing EPP with a lower NLR (<5) independently associated with improved survival. Pinato et al (2012) further performed an analysis of the prognostic value of NLR in a retrospective series of 171 patients diagnosed over an 18-year period, finding a high NLR (>5) to be a stronger baseline predictor of survival than patient performance status. The independent association of NLR with survival was further demonstrated in a retrospective study of 910 patients who received surgery, chemotherapy or best supportive care (Linton et al, 2014). Ours is the first prospective series of mesothelioma patients undergoing uniform clinical management to demonstrate the prognostic value of this clinically accessible marker at baseline. The optimal NLR cutoff value requires further evaluation in a large prospectively collected cohort.
Mesothelin is a cell adhesion glycoprotein that is present on the surface of mesothelial cells and is overexpressed in several malignancies, including mesothelioma (Creaney and Robinson, 2005). The diagnostic value of serum mesothelin is limited by a lack of specificity and low or negative results in patients with non-epithelioid histology (Hooper et al, 2013), but two previous studies have suggested its utility in monitoring disease response to treatment. Creaney et al (2010) studied serial mesothelin levels in 55 patient receiving two possible chemotherapy regimens and demonstrated that percentage change between baseline and completion of chemotherapy correlated to survival and that patients with partial response on CT were more likely to have a falling mesothelin. Grigoriu et al (2008) measured serial serum mesothelin in 40 patients undergoing experimental intrapleural gene therapy, demonstrating significantly shorter OS in patients with a 10% or greater increase in mesothelin between baseline and the end of treatment compared with those with stable values.
In our study, we showed a fall in serum mesothelin between baseline and following two cycles of chemotherapy occurred in 44% of patients and significantly predicted stability on CT at 2 and 4 months. A falling level at completion of chemotherapy is significantly associated with longer survival. For a patient experiencing troublesome side effects from chemotherapy, early predictive information from serial serum mesothelin might usefully contribute to clinical decision making and should be the subject of further study.
Fibulin-3 is a further cell-adhesion glycoprotein that is expressed by condensing mesenchyme and can be measured in plasma and pleural fluid by ELISA. A series published in 2012 presented excellent diagnostic accuracy in identifying MPM from selective cohorts of asbestos exposed and healthy individuals, as well as those with non-MPM malignancy, using a plasma fibulin-3 cutoff of 46 ng ml−1 (Pass et al, 2012). Plasma levels were seen to fall following cytoreductive surgery, suggesting a place in treatment response monitoring. Recently, Creaney et al (2014) demonstrated an association between higher pleural fluid fibulin-3 and reduced survival, which may have been confounded by higher levels of the biomarker in non-epithelioid effusions. Plasma fibulin-3 was shown to have poor diagnostic sensitivity and no significant association with prognosis or histology. Plasma fibulin-3 levels measured in our series were comparable with those reported by Creaney et al (2014) but considerably lower than those reported by Pass et al (2012), with just 5 out of 63 (8%) having a level above the proposed diagnostic cutoff. An apparent association between higher levels of plasma fibulin-3 and longer survival in the current series is likely to be explained by the confounding effect of histological subtype. No association between interval change in fibulin-3 and TTP or OS was seen. In summary, in this data set there appears to be no role for fibulin-3 as a marker of treatment response.
Despite not being a randomised study, the SWAMP trial has several strengths. Radiographic and clinical assessments were robust with double reporting of all CT and PET-CT scans. Only patients with a histological diagnosis of mesothelioma were recruited, while many similar studies have accepted a cytological diagnosis. This resulted in one of the largest groups of non-epithelioid histology patients to have been prospectively recruited to a trial of prognostic and treatment response markers. There was no loss to follow-up such that survival data is complete.
There are also a few study limitations that need to be highlighted. First, because of time and financial restraints, we did not manage to recruit the number of patients identified in our original power calculation. In addition, often because of patient deterioration, only 41 out of 58 chemotherapy patients were included in the primary end point analysis. Although this is one of the largest mesothelioma studies of its kind, the small patient numbers raise the possibility of type II errors with the secondary outcomes and further studies in these areas would be beneficial, perhaps with more frequent biomarker assessments.
In summary, NLR is readily available in clinical practice and could assist clinicians when evaluating patients overall prognosis. It may be a useful minimisation factor when setting up further randomised clinical trials in mesothelioma. There appears to be no role for routine interval PET-CT scanning in patients undergoing chemotherapy; however, change in serum mesothelin could be an indicator of treatment response and warrants further study. It might also be useful if a future study attempted to split patients into three categories (rising, falling and stable mesothelin), which was not explored here because of study size. If mesothelin was monitored regularly throughout treatment, it might have the potential to assist oncologists in evaluating response.
Acknowledgments
This work was supported by unrestricted educational grant from the Cobalt Appeal Fund.
The authors declare no conflict of interest.
Footnotes
Supplementary Information accompanies this paper on British Journal of Cancer website (http://www.nature.com/bjc)
Supplementary Material
References
- Armato SG, III, Oxnard GR, MacMahon H, Vogelzang NJ, Kindler HL, Kocherginsky M, Starkey A. Measurement of mesothelioma on thoracic CT scans: a comparison of manual and computer-assisted techniques. Med Phys. 2004;31:1105–1115. doi: 10.1118/1.1688211. [DOI] [PubMed] [Google Scholar]
- Arnold DT, Hooper CE, Morley A, White P, Lyburn ID, Searle J, Darby M, Hall T, Hall D, Rahman NM, de Winton E, Clive A, Masani V, Dangoor A, Guglani S, Jankowska P, Lowndes SA, Harvey JE, Braybrooke JP, Maskell NA. The effect of chemotherapy on health related quality of life in mesothelioma – results from the SWAMP trial. Br J Cancer. 2015. [DOI] [PMC free article] [PubMed]
- Byrne MJ, Nowak AK. Modified RECIST criteria for assessment of response in malignant pleural mesothelioma. Ann Oncol. 2004;5:257–260. doi: 10.1093/annonc/mdh059. [DOI] [PubMed] [Google Scholar]
- Chapman A, Mulrennan S, Ladd B, Muers MF. Population based epidemiology and prognosis of mesothelioma in Leeds, UK. Thorax. 2009;63:435–439. doi: 10.1136/thx.2007.081430. [DOI] [PubMed] [Google Scholar]
- Creaney J, Dick IM, Meniawy TM, Leong SL, Leon JS, Demelker Y, Segal A, Musk AW, Lee YCG, Skates SJ, Nowak AK, Robinson BWS. Comparison of fibulin-3 and mesothelin as markers of malignant mesothelioma. Thorax. 2014;69 (10:895–902. doi: 10.1136/thoraxjnl-2014-205205. [DOI] [PMC free article] [PubMed] [Google Scholar]
- Creaney J, Francis RJ, Dick IM, Musk AW, Robinson BW, Byrne MJ, Nowak AK. Serum soluble mesothelin concentrations in malignant pleural mesothelioma: relationship to tumour volume, clinical stage and changes in tumour burden. Am Assoc Cancer Res. 2010;17:1181–1189. doi: 10.1158/1078-0432.CCR-10-1929. [DOI] [PubMed] [Google Scholar]
- Creaney J, Robinson BW. Detection of malignant mesothelioma in asbestos exposed individuals: the potential role of soluble mesothelin-related protein. Haematol Oncol Clin N Am. 2005;19:1025–1040. doi: 10.1016/j.hoc.2005.09.007. [DOI] [PubMed] [Google Scholar]
- Engles JM, Quarless SA, Mambo E, Ishimori T, Cho SY, Wahl RL. Stunning and its effect on 3H-FDG uptake and key gene expression in breast cancer cells undergoing chemotherapy. J Nucl Med. 2006;47:603–608. [PubMed] [Google Scholar]
- Fitzpatrick DR, Peroni DJ, Bielefeldt-Ohmann H. The role of growth factors and cytokines in the tumorigenesis and immunobiology of malignant mesothelioma. Am J Respir Cell Mol Biol. 1995;12:455–460. doi: 10.1165/ajrcmb.12.5.7742009. [DOI] [PubMed] [Google Scholar]
- Francis RJ, Byrne MJ, van der Schaaf AA, Boucek JA, Nowak AK, Phillips M, Price R, Patrikeos AP, Musk W, Millward MJ. Early prediction of response to chemotherapy and survival in malignant pleural mesothelioma using a novel semiautomated 3-dimensional volume-based analysis of serial 18F-FDG PET scans. J Nucl Med. 2007;48:1449–1458. doi: 10.2967/jnumed.107.042333. [DOI] [PubMed] [Google Scholar]
- Grigoriu BD, Chahine B, Vachani A, Gey T, Conti M, Sterman DH, Marchandise G, Porte H, Albelda SM, Scherpereel A. Kinetics of soluble mesothelin in patients with malignant pleural mesothelioma during treatment. Am J Respir Crit Care Med. 2008;179:950–954. doi: 10.1164/rccm.200807-1125OC. [DOI] [PubMed] [Google Scholar]
- Guntulu A, Metintas M, Metintas S, Yildirim H, Ozkan R, Ozden H. Three-dimensional evaluation of chemotherapy response in malignant pleural mesothelioma. Eur J Radiol. 2010;74:130–135. doi: 10.1016/j.ejrad.2009.02.002. [DOI] [PubMed] [Google Scholar]
- Hooper CE, Morley AJ, Virgo P, Harvey JE, Kahan B, Maskell NA. A prospective trial evaluating the role of mesothelin in undiagnosed pleural effusions. Eur Respir. 2013;41 (1:18–24. doi: 10.1183/09031936.00148211. [DOI] [PubMed] [Google Scholar]
- Kao SC, Klebe S, Henderson DW, Reid G, Chatfield M, Armstrong NJ, Yan TD, Vardy J, Clarke S, van Zandwijk N, McCaughan B. Low calretinin expression and high neutrophil-to-lymphocyte ratio are poor prognostic factors in patients with malignant mesothelioma undergoing extrapleural pneumonectomy. J Thorac Oncol. 2011;6:1923–1929. doi: 10.1097/JTO.0b013e31822a3740. [DOI] [PubMed] [Google Scholar]
- Kao SCH, Pavlakis N, Harvie R, Vardy JL, Boyer MJ, van Zandwijk N. High blood neutrophil-to-lymphocyte ratio is an indicator of poor prognosis in malignant mesothelioma patients undergoing systemic therapy. Clin Cancer Res. 2010;16:5805–5813. doi: 10.1158/1078-0432.CCR-10-2245. [DOI] [PubMed] [Google Scholar]
- Lee HY, Hyun SH, Lee KS, Kim BT, Kim J, Shim YM, Ahn MJ, Kim TS, Yi CA, Chung MJ. Volume-based parameter of 18F-FDG PET/CT in malignant pleural mesothelioma: prediction of therapeutic response and prognostic implications. Ann Surg Oncol. 2010;17:2787–2794. doi: 10.1245/s10434-010-1107-z. [DOI] [PubMed] [Google Scholar]
- Linton A, Pavlakis N, O'Connell RO, Soeberg M, Kao S, Clarke S, Vardy J, van Zandwijk N. Factors associated with survival in a large series of patients with malignant pleural mesothelioma in New South Wales. Br J Cancer. 2014;111 (9:1860–1869. doi: 10.1038/bjc.2014.478. [DOI] [PMC free article] [PubMed] [Google Scholar]
- NICE Technology appraisal guidance 135. Pemetrexed for the treatment of malignant pleural mesothelioma 2008.
- Nowak AK. CT, RECIST, and malignant pleural mesothelioma. Lung Cancer. 2005;49S1:S37–S40. doi: 10.1016/j.lungcan.2005.03.030. [DOI] [PubMed] [Google Scholar]
- Nowak AK, Francis RJ, Phillips MJ, Millward MJ, van der Schaaf AA, Boucek J, Musk AW, McCoy MJ, Segal A, Robins P, Byrne MJ. A novel prognostic model for malignant mesothelioma incorporating quantitative FDG-PET imaging with clinical parameters. Clin Cancer Res. 2010;16:2409–2417. doi: 10.1158/1078-0432.CCR-09-2313. [DOI] [PubMed] [Google Scholar]
- Pass HI, Levin SM, Harbut MR, Melamed J, Chiriboga L, Donington J, Huflejt M, Carbone M, Chia D, Goodglick L, Goodman GE, Thornquist MD, Liu G, de Perrot M, Tsao MS, Goparaju C. Fibulin-3 as a blood and effusion biomarker for pleural mesothelioma. N Engl J Med. 2012;367:1417–1427. doi: 10.1056/NEJMoa1115050. [DOI] [PMC free article] [PubMed] [Google Scholar]
- Pinato DJ, Mauri FA, Ramakrishnan R, Wahab L, Lloyd T, Sharma R. Inflammation-based prognostic indices in malignant pleural mesothelioma. J Thorac Oncol. 2012;7:587–594. doi: 10.1097/JTO.0b013e31823f45c1. [DOI] [PubMed] [Google Scholar]
- Proctor MJ, Talwar D, Balmar SM, O'Reilly DSJ, Foulis AK, Horgan PG, Morrison DS, McMillan DC. The relationship between the presence and site of cancer, an inflammation-based prognostic score and biochemical parameters. Initial results of the Glasgow Inflammation Outcome Study. Br J Cancer. 2010;103:870–876. doi: 10.1038/sj.bjc.6605855. [DOI] [PMC free article] [PubMed] [Google Scholar]
- Roxburgh CS, McMillian DC. Role of systemic inflammatory response in predicting survival in patients with primary operable cancer. Fut Oncol. 2010;6:149–163. doi: 10.2217/fon.09.136. [DOI] [PubMed] [Google Scholar]
- Sarraf KM, Belcher E, Raevsky E, Nicholson AG, Goldstraw P, Lim E. Neutrophil/lymphocyte ratio and its association with survival after complete resection in non-small cell lung cancer. J Thorac Cardiovasc Surg. 2009;137:425–428. doi: 10.1016/j.jtcvs.2008.05.046. [DOI] [PubMed] [Google Scholar]
- Veit-Haibach P, Schaefer N, Steinerta H, Soyka JD, Seifert B, Stahel RA. Combined FDG-PET/CT in response evaluation of malignant pleural mesothelioma. Lung Cancer. 2010;67:311–317. doi: 10.1016/j.lungcan.2009.04.015. [DOI] [PubMed] [Google Scholar]
- Vogelzang NJ, Rusthoven J, Symanowski J, Denham C, Kaukel E, Ruffie P, Gatzemeier U, Boyer MES, Manegold C, Niyikiza C, Paoletti P. Phase III study of pemetrexed in combination with cisplatin versus cisplatin alone in patients with malignant pleural mesothelioma. J Clin Oncol. 2003;21:2636–2644. doi: 10.1200/JCO.2003.11.136. [DOI] [PubMed] [Google Scholar]
- Walsh SR, Cook EJ, Goulder F, Justin TA, Keeling NJ. Neutrophil–lymphocyte ratio as a prognostic factor in colorectal cancer. J Surg Oncol. 2005;91:181–184. doi: 10.1002/jso.20329. [DOI] [PubMed] [Google Scholar]
- Yates DH, Corrin B, Stidolph PN, Browne K. Malignant mesothelioma in south east England: clinicopathological experience of 272 cases. Thorax. 1997;52:507–512. doi: 10.1136/thx.52.6.507. [DOI] [PMC free article] [PubMed] [Google Scholar]
Associated Data
This section collects any data citations, data availability statements, or supplementary materials included in this article.


