

Significance
The discovery of grid cells in the entorhinal cortex quickly led to the hypothesis that grid cell inputs might be responsible for the generation of discrete place fields downstream in the hippocampus. Simulations have shown that if this conjecture is correct, then lesions of dorsal medial entorhinal cortex (MEC), which expresses the most tightly spaced grids, should cause place fields to expand, whereas lesions of ventral MEC, which expresses the most widely spaced grids, should cause fields to contract. Using muscimol to make small inactivations along the dorsoventral axis of the MEC, we tested this hypothesis. Our results deviate from the prediction but most likely result from a combination of the predicted effects and a weakening of the self-motion signal within the MEC.
Keywords: hippocampus, medial entorhinal cortex, place cells, grid cells, path integration
Abstract
Both hippocampal place fields and medial entorhinal cortex (MEC) grid fields increase in scale along the dorsoventral axis. Because the connections from MEC to hippocampus are topographically organized and divergent, it has been hypothesized that place fields are generated by a Fourier-like summation of inputs over a range of spatial scales. This hypothesis predicts that inactivation of dorsal MEC should cause place field expansion, whereas inactivation of ventral MEC should cause field contraction. Inactivation of dorsal MEC caused substantial expansion of place fields; however, as inactivations were made more ventrally, the effect diminished but never switched to contraction. Expansion was accompanied by proportional decreases in theta power, intrinsic oscillation frequencies, phase precession slopes, and firing rates. Our results are most consistent with the predicted loss of specific Fourier components coupled with a path integration gain reduction, which raises the overall place field scale and masks the contraction expected from ventral inactivations.
When a rodent navigates through an environment, the principal cells in its hippocampi become tuned to its physical location (1). The continuous updating of positional information through integration of head angular velocity and linear velocity using vestibular, proprioceptive, and visual self-motion signals, termed path integration, is thought to play an important role in this process (2, 3). The grid cell network (4, 5) displays a number of properties, including regularly repeating fields and cells conjunctive for position and direction (6), predicted by a model for path integration in a toroidal attractor map network (7, 8). Given that the connections from the medial entorhinal cortex (MEC) to the hippocampus are topographically organized (9), and both grid and place fields increase in scale along the dorsoventral axes of their respective structures (5, 10–13), it is reasonable to speculate that the features of path integration observed in the hippocampus, including its place fields, may be inherited from the MEC.
The periodic nature of grid fields and the range of spatial scales they express suggested they might enable hippocampal place field generation through a Fourier synthesis mechanism (8, 14). In the Fourier model, place field size is proportional to the scales of the input grid fields; a field generated from input grids with a distribution of spatial scales skewed towards smaller scales will be smaller than one whose input spatial scales are skewed in the opposite direction. Therefore, a testable prediction of the model is that lesion of the most dorsal portion of MEC sending inputs to the dorsal hippocampus should increase the scale of place fields recorded there, whereas lesion of the most ventral portion of the MEC sending inputs to the same region should have the opposite effect (14). We performed this experiment by infusing muscimol at multiple sites along the dorsoventral axis of MEC while recording from areas CA3 and CA1 in the dorsal half of the hippocampus, allowing us to track place field properties immediately before and after temporary inactivations. The experiment was conducted on a circular track, as previous studies showed that place fields recorded on narrow tracks are dependent on path integration (15, 16).
Results
We recorded place cells in six rats. Cannulae were targeted to dorsal, intermediate, and ventral MEC. One-half of the animals had multiple cannulae implanted (Fig. 1) so that, in total, we had three animals with cannulae targeting dorsal MEC, three with cannulae targeting intermediate MEC, and three with cannulae targeting ventral MEC. Distances between adjacent injection sites were ∼2.25 mm. At the higher concentration, units recorded 2 mm away (but not 4 mm away) were partially inactivated, as measured in MEC under urethane anesthesia in a separate set of rats [Fig. S1; two-way repeated-measures ANOVA, F(2,144) = 9.972, P < 0.001]. We considered the possibility that the inactivations produced by this higher concentration might be too extensive to properly test our hypothesis, and therefore also made smaller inactivations in all animals (lower concentration is equal to ∼25% of the high concentration). Typically, during the first session within which animals received high-concentration muscimol infusions to intermediate or ventral MEC, their ability to run on the track was impaired. Motor behavior was normal in subsequent sessions, and there was no significant difference in running velocity between control sessions and the inactivation sessions in which the animals were able to run the task [running alternately clockwise and counterclockwise on a circular track for food reward at two fixed locations; Fig. S2; Kruskal–Wallis one-way ANOVA on ranks, H(6) = 10.45, P = 0.107].
Fig. 1.
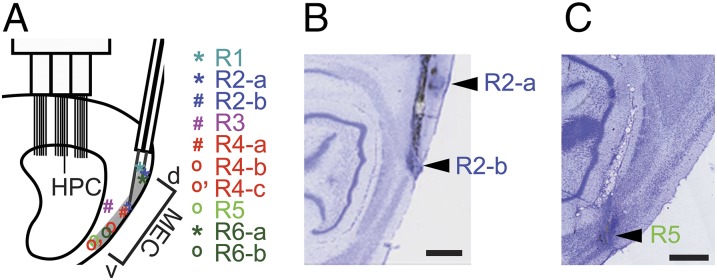
Implant configuration and infusion sites. (A) Schematic showing positions of infusions along the dorsoventral axis of the MEC. An example cannulae configuration is shown, as well as the locations of the recording electrodes in CA1 and the local field potential electrode in the fissure. The single asterisk (*) indicates dorsal MEC infusion sites, the number sign (#) indicates intermediate MEC infusion sites, and “o” indicates ventral MEC infusion sites. Rat ID is listed at Top Right (R1–R6) and is also color-coded to allow rat and infusion site to be matched. (B and C) Cresyl-stained sections from rats 2 and 5 showing dorsal and intermediate infusion sites, and ventral infusion site, respectively. (Scale bar: 1 mm.)
Reduction of Theta Power After Inactivations.
All infusions except for vehicle and low-concentration ventral infusions resulted in significant decreases in theta power recorded from the hippocampal fissure relative to vehicle [Fig. 2 A–C; one-way ANOVA, F(6,36) = 8.12, P < 0.0001]. Dorsal and high-concentration ventral inactivations also caused significant decreases in power of the second harmonic of theta [which typically occurred between 15.5 and 16.5 Hz; Fig. 2D; Kruskal–Wallis one-way ANOVA on ranks, H(6) = 19.29, P = 0.004]. No significant changes in theta frequency were observed [Fig. S3A; Kruskal–Wallis one-way ANOVA on ranks, H(6) = 10.932, P = 0.090]. Linear regression analysis of theta power vs. running speed showed that the decrease in theta power after focal MEC inactivation was not due to nonsignificant decreases in running velocity (Fig. S3 B and C; paired t tests; see Fig. S3 for significance levels).
Fig. 2.

The effect of focal MEC inactivations on the theta rhythm recorded from the hippocampal fissure. (A) A representative example of power spectra generated from three trials of a single recording session. The infusion site was ventral and the muscimol concentration was high. Power was normalized to peak baseline theta power. (B) Raw sample traces randomly selected from the same session. (C) Reductions in peak theta power relative to vehicle control were significant for most treatments. (D) Two treatments also showed a significant decline in the peak power of the second harmonic. Data in C and D are presented as mean ± SEM. L/H indicates low/high muscimol concentration. Vehicle or site of inactivation is listed along the Bottom (the intermediate treatment is abbreviated as “interm”). The single asterisk (*) indicates significant difference from vehicle control calculated with post hoc test (P < 0.05).
Expansion of Hippocampal Place Fields.
Next, we investigated changes to the scale of the hippocampal representation of space resulting from the MEC inactivations. We calculated the correlations between pairs of population vectors of unit firing constructed from binned rate maps (Fig. 3 A and B). The distance in track bins at which the spatial population vector correlation function drops to 0.5 provides a measure of the scale of the spatial representation that is independent of any definition of place field (17–19) (Fig. 3B and Fig. S4A). All groups except for vehicle and ventral low-concentration muscimol showed a significant expansion of the spatial representation [Kruskal–Wallis one-way ANOVA on ranks, H(6) = 49.95, P < 0.001], and the effect of high-concentration muscimol infused dorsally was significantly greater than when infused ventrally [Fig. 3C; two-way ANOVA, F(2,52) = 4.42 P = 0.017; post hoc Tukey test, P = 0.045; see Fig. S5 for additional representative rate maps and position vs. time spike plots].
Fig. 3.

Expansion of the spatial representation after focal MEC inactivations. (A) Example rate maps from four place cells recorded before (top row) and after (bottom row) intermediate-site high-concentration muscimol infusion. (B) Population vector cross-correlation matrices from the same session from baseline, vehicle, and high-concentration muscimol trials. The cells recorded in this session were from CA1. At Lower Right, the decorrelation curves for each trial are overlaid. The displayed data are the mean correlation ± SEM for each possible population vector pair interval between 0 and 180 cm. To quantify the scale of the spatial representation, the interval at which the correlation dropped to 0.5 was calculated (dotted line). (C) The mean change ± SEM in the interval value at which the correlation drops to 0.5 for all sessions. L/H indicates low/high muscimol concentration. Vehicle or site of inactivation is listed along the Bottom. The single asterisk (*) indicates significant difference from vehicle control calculated with post hoc test (P < 0.05).
Spatial Information.
Spatial information provides a measure of how sharply tuned a unit’s firing is to the animal’s physical location in space (20); thus, units with large place fields have lower spatial information scores than units with small place fields. All treatments except vehicle and ventral low-concentration infusions reduced spatial information scores [Fig. S6; Kruskal–Wallis one-way ANOVA on ranks, H(6) = 168.72, P < 0.001], consistent with place field expansion. The reductions after both low-concentration dorsal and intermediate infusions and high-concentration dorsal infusions were greater than after the corresponding ventral infusions [two-way ANOVA, F(2,982) = 13.99, P < 0.001].
Individual Place Field Analysis.
One shortcoming of the foregoing analyses is that they use all spikes fired by each unit, rather than only spikes fired within individual place fields. To address this, we developed an analysis based on manual selection of phase-precessing place fields (Fig. 4A; the analyst was blind to the identity of the unit and whether spikes were from baseline or treatment trials). Place field width was calculated from the manually selected start and end positions of each field in the phase precession plots (Fig. 4B) (21). Plotting phase and position for all spikes from a given treatment verified that field boundaries were selected appropriately (Fig. 4C). As no differences in the effect of infusion on place field width were seen across the three hyperdrive tetrode bundles, data were combined across the bundles. Significant expansion was observed in all treatment subgroups except for the vehicle, and intermediate and ventral low-concentration CA3 groups (Fig. 4D; Mann–Whitney rank sum tests).
Fig. 4.

Analysis of individual place field widths. (A) Example rate maps and phase precession plots before and after high-concentration muscimol infusion to dorsal MEC. (B) A color-coded example of the phase-by-position plot from which the experimenter manually selected place field boundaries. The gray boxes indicate track bins around the reward wells excluded due to low occupancy after velocity thresholding. The experimenter selected boundaries around the red and blue fields. The blue field was excluded from the analysis due to overlap with the middle gray box. The small phase-precessing field on the far left was not selected by the observer because it overlapped with another small field (to its left), which did not appear to be showing phase precession (both fields overlap the reward area, so they would have been automatically excluded on those grounds had boundaries been selected). The y axis is duplicated and spikes plotted twice to produce a contiguous cycle of phase procession for display purposes in both A and B. (C) Representative example of heat maps generated from spikes fired within the manually selected fields. The example uses all spikes fired by all CA1 neurons recorded through hyperdrive bundle 1 from all high-concentration dorsal site inactivation sessions. This plot shows that field boundaries were selected consistently and that fields were not artificially expanded (i.e., no large blank areas at either end of the population field) or shrunk (i.e., the population field is not truncated at either end). (D) Place field width data for all treatment subgroups recorded in CA3 (Top) or CA1 (Bottom) presented as mean ± SEM. L/H indicates low/high muscimol concentration. Vehicle or site of inactivation listed along the Bottom. The single asterisk (*) indicates significant difference between baseline and postinfusion within a treatment or treatment subgroup with a P < 0.05; the double asterisk (**) indicates P < 0.001.
Although we only observed a small decrease in mean firing rates for the intermediate low-concentration group, all groups except for vehicle and ventral low concentration had decreased in-field and increased out-of-field firing rates (Fig. S7 A–C; Mann–Whitney rank sum tests). We suspected that these firing-rate changes contributed to the magnitude of the expansion effect in the population vector analysis (Fig. 3), so we adjusted infusion trial rate maps for all place cells so that their mean in-field and out-of-field rates were equal to those from baseline trials, and then reran our population vector analysis (Fig. S4 B–D). The magnitude of the expansion effect was decreased, confirming the influence of decreased in-field and increased out-of-field rates, but was still significant in most groups [Kruskal–Wallis one-way ANOVA on ranks, H(6) = 36.05, P < 0.001].
There was also a trend toward decreasing numbers of place fields in those groups showing the greatest expansion, although only the decrease in CA1 after dorsal high-concentration infusions was significant [Fig. S7D; one-way ANOVA: CA3: F(6,37) = 0.92, P = 0.49; CA1: F(6,34) = 3.97, P = 0.004]. The decrease in the number of fields was not due to the exclusion of fields that had expanded into reward zones; when all place fields were included, the decrease in number of fields after dorsal high-concentration infusions remained significant [Fig. S7E; one-way ANOVA, F(6,80) = 6.26, P < 0.001] and was significantly greater than after high-concentration ventral and intermediate infusions [two-way ANOVA, F(2,56) = 5.18, P = 0.009].
Paired Place Fields Analysis.
The individual place field analysis did not control for the possibility that remapping might contribute to the observed expansion; for example, if the smallest fields were preferentially knocked out as a result of the inactivations, this would increase the mean field width (Figs. 3 and 4). To determine whether individual fields were truly expanding, we restricted our analysis to individual place fields that were expressed during both baseline and treatment trials, termed “paired” place fields (Fig. 5). There were significant place field width increases for all high-concentration treatments and the low-concentration intermediate treatment compared with control [Fig. 5E; Kruskal–Wallis one-way ANOVA on ranks, H(6) = 46.85, P < 0.001]. Two-way ANOVA between treatments did not reach significance for the effect of infusion site [F(2,284) = 2.07, P = 0.13], although the difference between the amount of expansion after high-concentration dorsal infusions compared with the corresponding ventral infusions approached significance (post hoc Tukey test, P = 0.056). Place field intrinsic oscillation frequency was significantly decreased after muscimol compared with control, consistent with place field expansion [Fig. 5F; Kruskal–Wallis one-way ANOVA on ranks, H(6) = 122.85, P < 0.001]. The decreases after dorsal and intermediate infusions at both drug concentrations were significantly larger than after the corresponding ventral inactivations [two-way ANOVA, effect of infusion site: F(2,284) = 13.287, P < 0.001]. The slope of phase precession was also significantly decreased for all groups relative to vehicle control except ventral low concentration, again consistent with place field expansion [Fig. 5G; Kruskal–Wallis one-way ANOVA on ranks, H(6) = 102.20, P < 0.001]; the effect was significantly greater after dorsal and intermediate low-concentration infusions and dorsal high-concentration infusions relative to the corresponding ventral infusions [two-way ANOVA, F(2,261) = 7.74, P < 0.001]. Furthermore, both mean [Fig. 5H; Kruskal–Wallis one-way ANOVA on ranks, H(6) = 48.52, P < 0.001] and peak [Fig. 5I; Kruskal–Wallis one-way ANOVA on ranks, H(6) = 34.601, P < 0.001] measures of in-field firing rates decreased significantly in the majority of treatments, with the dorsal inactivations causing the greatest effect, although two-way ANOVAs failed to detect any effect of infusion site [mean rate: F(2,284) = 1.549, P = 0.214; peak rate: F(2,284) = 0.938, P = 0.393].
Fig. 5.

Analysis of “paired” place field properties. (A) A representative example of a pair of phase precessing place fields (in blue) selected automatically from baseline (Top) and treatment (Bottom) trials on the basis of center of mass. The infusion site was ventral, and the muscimol concentration was high. The y axis is duplicated and spikes plotted twice to produce a contiguous cycle of phase procession. (B) Autocorrelations (blue) and filtered autocorrelations (magenta) for the same place field as A. Dashed lines are shown through the first three peaks of the baseline (Top) autocorrelation to highlight the change in oscillation frequency after inactivation (Bottom). (C) Intrinsic oscillation frequencies calculated from the power spectra peaks between 6 and 12 Hz of the unfiltered autocorrelations for the place field pair in A. Black is baseline, and red is postmuscimol infusion. Peaks of the two power spectra were equalized for display. (D) Slope of phase precession for same place field as B calculated using linear regression for display only. All grouped data were analyzed using circular regression (45). (E–I) Mean change ± SEM in place field width (E), intrinsic oscillation frequency (F), slope of phase precession (G), mean in-field firing rate (H), and peak in-field firing rate (I) for each treatment. L/H indicates low/high muscimol concentration. Vehicle or site of inactivation listed along the Bottom. The single asterisk (*) directly above or below error bars indicates significant difference between vehicle and corresponding treatment with a P < 0.05. Brackets connecting individual bars indicate significant differences between effects of infusions at different infusion sites; the single asterisk (*) indicates P < 0.05, and the double asterisk (**) indicates P < 0.001.
Correlations calculated between both population vectors and rate maps before and after infusions indicated that there were significant increases in remapping after muscimol compared with vehicle control (Fig. S8 A and B). To determine whether place fields truly remapped (i.e., changed location) or were simply wiped out (which can also lead to reduced correlations), we quantified the proportion of fields from treatment trials that were new fields (i.e., fields that did not have matching baseline trial fields; Fig. S8C). Under vehicle control conditions, 18% of place fields identified after vehicle infusions did not have matching baseline fields. Both dorsal low- and high-concentration treatments saw relatively large increases in the percentages of new place fields, indicating that substantial remapping had in fact occurred in these two groups (dorsal low, 38%; dorsal high, 42%; intermediate low, 27%; intermediate high, 16%; ventral low, 13%; ventral high, 30%).
Paired Fields by Lap.
An alternative explanation for our results showing place field expansion is that place fields simply became unstable; if field location was changing slightly from one lap to the next, averaging firing-rate maps across laps would have caused the appearance of place field expansion even if fields had not actually expanded. We conducted a lap-by-lap analysis of place field width using our paired place field data to address this possibility (Fig. 6). Field width was calculated as the distance from the position of the first spike on that lap to the position of the last spike on that lap for each paired place field. Mean field width was indeed increased after all high-concentration muscimol infusions relative to vehicle control [Fig. 6D; one-way ANOVA, F(6,457) = 6.66, P < 0.001]. There was no significant difference between the infusion sites [two-way ANOVA between treatments; effect of infusion site: F(2,284) = 2.38, P = 0.094], but a post hoc Tukey test suggested a difference between the effect of high-concentration dorsal infusions and the corresponding ventral infusions (P = 0.05). For each field, we also computed the maximum field width and found that all groups were increased relative to control [Fig. 6E; one-way ANOVA, F(6,457) = 10.63, P < 0.001]; there was no significant effect of infusion site [two-way ANOVA, F(2,284) = 2.36, P = 0.096], but the difference between the effect after dorsal high-concentration infusions compared with the corresponding ventral infusions approached significance (post hoc Tukey test, P = 0.055). We confirmed these results with an analysis that used binned firing rates and a firing-rate threshold. Mean field width remained increased for all high-concentration infusions at all three sites relative to vehicle [Fig. 6F; one-way ANOVA, F(6,457) = 6.66, P < 0.001], although there was no effect of infusion site [two-way ANOVA, F(2,284) = 1.26, P = 0.285]. Maximum field width was significantly increased for all treatments relative to vehicle using binned firing rates [Fig. 6G; one-way ANOVA, F(6,457) = 9.62, P < 0.001], and the expansion after dorsal high-concentration infusions was significantly greater than after the corresponding intermediate and ventral groups [two-way ANOVA, F(2,284) = 3.27, P = 0.039].
Fig. 6.

Paired place fields analyzed lap by lap. (A) A representative example of a pair of phase-precessing place fields (plotted twice along y axis in red and blue) selected automatically from baseline (Top) and dorsal high-concentration (Bottom) trials on the basis of center of mass. Note that the place fields at Left are excluded from the analysis due to overlap with the reward zone and with each other. (B) Lap-by-lap binned firing-rate maps for the place fields in A. (C) Plots of spike phases and positions for representative single laps from the infusion and treatment trials for the field in A (the sixth laps from both trials). (D and E) Mean change ± SEM in mean (D) and maximum (E) place field width calculated using phase precession data from Fig. 5. (F and G) Mean change ± SEM in mean (F) and maximum (G) place field width calculated using lap-by-lap rate maps and a firing-rate threshold. L/H indicates low/high muscimol concentration. Vehicle or site of inactivation listed along the Bottom. The single asterisk (*) directly above error bars indicates significant difference between vehicle and corresponding treatment with a P < 0.05. Brackets connecting individual bars indicate significant differences between the effects of infusions at the different infusion sites; the single asterisk (*) indicates P < 0.05.
Interneuron Firing Rates.
Last, we examined the firing rates of interneurons recorded in the cell body layers (Fig. S9A). There were relatively small but significant decreases in interneuron firing rates after low- and high-concentration dorsal and ventral inactivations (Wilcoxon signed-rank tests; see Fig. S9 for P values).
Discussion
Focal inactivations of MEC, regardless of location along the dorsoventral axis, caused expansion of place fields in CA1 and CA3, the magnitude of which diminished as infusions were made at more ventral sites along the dorsoventral axis of the MEC. They also decreased theta power, the number of place fields, firing rates, intrinsic oscillation frequencies, and phase precession slopes [the decreased intrinsic oscillation frequencies and phase precession slopes are consistent with most current models of hippocampal phase precession, including the oscillatory interference model (22, 23), the “smooth ramp” model (24, 25), and inheritance from MEC (20, 26, 27)]; these same effects have previously been observed after reduction of the strength of the self-motion signal by deletion of ambulation and vestibular signals (19), and also as recording sites are moved ventrally along the dorsoventral axis of the hippocampus (11–13, 18). The large decrease in theta power observed after high-concentration ventral inactivations provides strong evidence that the ventral portion of MEC we inactivated exerts influence over the portion of dorsal hippocampus we recorded from. Although the contraction predicted by the Fourier theory was not observed after ventral inactivations, we did see an increase in out-of-field firing rates, expected after loss of Fourier components due to decreased excitatory drive at areas of maximal grid field overlap relative to surrounding areas. The most parsimonious explanation for our results is that the inactivations induced a combination of loss of Fourier components and a decrease in the gain of the self-motion signal. This decreased gain would have caused an increase in the scale of grid fields spared by the focal inactivations, enhancing the expansion of place fields after dorsal inactivations and counteracting the contraction of fields after ventral inactivations (Fig. S10; Table S1 provides a summary of the predictions of the two hypotheses and which predictions appear to be fulfilled in our experiment). How the spared grids might expand is unclear. One possibility is that grid fields are generated through an inhibitory attractor mechanism, and that weakening of disynaptic inhibition due to partial inactivation of individual grid modules (28) could cause expansion (refs. 29–31; but see ref. 32). Interestingly, there is one report of place field contraction in the open field after lesions of entorhinal cortex that may have spared a small portion of dorsal MEC (33), but interpretation of this result in the context of the Fourier hypothesis is complicated by the extensive nature of the lesions, which covered most of MEC and spread into lateral entorhinal cortex; the resulting dramatic decrease in firing rates suggests a large reduction in excitatory drive, which may have limited the area within overlapping grid fields where place cells were sufficiently depolarized to fire (in a manner analogous to increasing the firing threshold, the effect of which is illustrated in Fig. S9 C and D).
Although a parallel weakening of inhibitory inputs from or driven by MEC (34–38) could also explain the greater than expected place field expansion (Fig. S9), for this to occur, the decrease in inhibition would likely need to be greater than any parallel decrease in excitation. We did not observe a particularly large reduction in interneuron firing rates in the cell body layers (Fig. S9A), but we cannot rule out a larger reduction in stratum lacunosum-moleculare interneurons (35) or projecting GABAergic neurons in MEC (34). Another possibility is that MEC-driven excitation dominates in the place field, whereas MEC-driven inhibition dominates outside the field, which would be consistent with our observations of decreased in-field firing rates and increased out-of-field firing rates after inactivations.
Our results are seemingly at odds with recent experiments showing that inactivation of the medial septum, which disrupts the grid structure in MEC, leaves place field expression in CA1 largely unchanged in both familiar and novel environments [apart from a loss of theta rhythmicity (39–41)]. However, new results showing that, in novel environments, medial septum inactivation can prevent the formation of place fields if insufficient sensory cues are available (42), help to reconcile these contradictory findings. That the effect of medial septum inactivation is greatest in novel environments suggests the possibility that recall of previously formed place cell maps (termed “charts”; 7) in the recurrent CA3 network can lead to CA1 place field formation when the grid network signal is not present. The fact that medial septum inactivation does not prevent the formation of place fields in novel environments if sensory cues are sufficiently available can be explained by retrieval, using attractor dynamics (43), of the most closely matching CA3 chart from the pool of those available. The remapping of these novel environment fields when the medial septum and grid cells come back online (42) is notable for two reasons: first, it supports the notion that the initial place field formation is due to spurious recall of a prior CA3 chart, because an appropriate chart could not possibly have been recalled in an unfamiliar environment; and second, it indicates that formation of place fields solely from sensory cues is an artifact of the experimental manipulation, because control of place field properties returns to the grid cell network once it becomes available, thereby “correcting” the place cell map if an inappropriate chart had been selected. Data from smaller novel open-field environments showing that fields formed during medial septum inactivation do not always remap when the grid network is reestablished (ref. 41, but not ref. 42) suggest that, when many local cues are present, a previously formed chart that is spuriously recalled through attractor dynamics may become bound to the new set of cues, thus enabling subsequent recall. Nevertheless, we interpret these findings as showing that, under normal conditions, the grid network plays an important role in setting place field properties. Furthermore, because our animals were highly familiar with the recording room and the track, the fact that the grid cell network retained control over place field properties after partial inactivations suggests that place fields only become solely dependent on previously stored charts when grid cell inputs are completely removed. Although there is a report showing that medial septum inactivation reduces in-field firing rates of place fields in CA3 but not CA1 (44), given the familiarity of the animals in that study with the behavioral apparatus, it is plausible that sufficient CA3–CA1 long-term potentiation had occurred that a partial/perturbed CA3 chart was still sufficient to drive the appropriate population of CA1 place cells. In addition, as noted by the authors of that study, the use of tetracaine raised the possibility that the CA3 effect was due to inactivation of fibers of passage rather than medial septum (44), and thus CA3 may not have been disrupted in the more recent studies using muscimol (41, 42). In the absence of more compelling CA3 data, it remains doubtful that CA1 can express novel place field configurations in the absence of grid cell input.
Although the results presented here do not perfectly match the predictions of the Fourier model, degraded self-motion signals can only produce the observed results if place fields are indeed being generated by Fourier mechanisms (i.e., place field scale is inherited from grid field scale), and so provide further support to the model. The exact nature and mechanism of the degraded self-motion signal is unclear, however. An investigation of how individual grid modules respond to partial inactivation will help to clarify the plausibility of the mechanisms proposed.
Experimental Procedures
All experiments were approved by the University of Lethbridge Animal Welfare Committee. Six male Fisher–Brown Norway hybrid rats were implanted with cannulae targeting between one to three sites along the dorsoventral axis of the MEC (see Fig. 1 for location of sites). Animals were also implanted with a recording array containing 18 drivable tetrodes and 3 drivable single-channel electrodes. Electrodes were usually turned to CA1 first, and after sufficient data had been collected there, they were turned down to CA3 over the course of another week.
Animals ran clockwise and counterclockwise on a circular track for food reward. They first ran a baseline period, and then vehicle or muscimol was infused, after which a subsequent trial was run. In some sessions, multiple trials were run (SI Experimental Procedures).
Spikes from each tetrode file were automatically clustered using KlustaKwik (K. D. Harris, University College of London, London; http://klustakwik.sourceforge.net/), and then clusters were manually refined in custom-written software (Drifter; K. Godfrey, Allen Institute for Brain Science, Seattle). Units whose spatial information score did not reach 0.4 or whose maximum firing rate did not reach 1 Hz in either the baseline or treatment trials were discarded from analysis. This left a total of 518 place cells in CA1 and 351 place cells in CA3.
We defined place fields as being composed of spikes fired at a specific location in the environment and displaying phase precession relative to the theta rhythm recorded in the hippocampal fissure. The experimenter manually selected boundaries around place fields without knowledge of the tetrode or trial from which the data originated. For the paired field analysis (Fig. 5), the place fields were further restricted to fields that could be identified as being present during both baseline and treatment trials on the basis of center of mass of the fields.
Full methods can be found in SI Experimental Procedures.
Supplementary Material
Acknowledgments
We thank Dr. Keith Godrey for the spike-sorting program Drifter, Hiroe Yamazaki for surgical assistance, and Dr. Aaron Wilber for helpful comments on an early version of the manuscript. This work was supported by the Natural Sciences and Engineering Research Council of Canada (B.L.M.) and Alberta Innovates Health Solutions [Polaris award (to B.L.M.) and postdoctoral fellowship (to J.O.)].
Footnotes
The authors declare no conflict of interest.
This article is a PNAS Direct Submission.
See Commentary on page 3860.
This article contains supporting information online at www.pnas.org/lookup/suppl/doi:10.1073/pnas.1421963112/-/DCSupplemental.
References
- 1.O’Keefe J, Dostrovsky J. The hippocampus as a spatial map. Preliminary evidence from unit activity in the freely-moving rat. Brain Res. 1971;34(1):171–175. doi: 10.1016/0006-8993(71)90358-1. [DOI] [PubMed] [Google Scholar]
- 2.O’Keefe J. Place units in the hippocampus of the freely moving rat. Exp Neurol. 1976;51(1):78–109. doi: 10.1016/0014-4886(76)90055-8. [DOI] [PubMed] [Google Scholar]
- 3.Mittelstaedt ML, Mittelstaedt H. Homing by path integration in a mammal. Naturwissenschaften. 1980;67(11):566–567. [Google Scholar]
- 4.Hafting T, Fyhn M, Molden S, Moser MB, Moser EI. Microstructure of a spatial map in the entorhinal cortex. Nature. 2005;436(7052):801–806. doi: 10.1038/nature03721. [DOI] [PubMed] [Google Scholar]
- 5.Fyhn M, Molden S, Witter MP, Moser EI, Moser MB. Spatial representation in the entorhinal cortex. Science. 2004;305(5688):1258–1264. doi: 10.1126/science.1099901. [DOI] [PubMed] [Google Scholar]
- 6.Sargolini F, et al. Conjunctive representation of position, direction, and velocity in entorhinal cortex. Science. 2006;312(5774):758–762. doi: 10.1126/science.1125572. [DOI] [PubMed] [Google Scholar]
- 7.Samsonovich A, McNaughton BL. Path integration and cognitive mapping in a continuous attractor neural network model. J Neurosci. 1997;17(15):5900–5920. doi: 10.1523/JNEUROSCI.17-15-05900.1997. [DOI] [PMC free article] [PubMed] [Google Scholar]
- 8.McNaughton BL, Battaglia FP, Jensen O, Moser EI, Moser MB. Path integration and the neural basis of the “cognitive map.”. Nat Rev Neurosci. 2006;7(8):663–678. doi: 10.1038/nrn1932. [DOI] [PubMed] [Google Scholar]
- 9.Dolorfo CL, Amaral DG. Entorhinal cortex of the rat: Topographic organization of the cells of origin of the perforant path projection to the dentate gyrus. J Comp Neurol. 1998;398(1):25–48. [PubMed] [Google Scholar]
- 10.Brun VH, et al. Progressive increase in grid scale from dorsal to ventral medial entorhinal cortex. Hippocampus. 2008;18(12):1200–1212. doi: 10.1002/hipo.20504. [DOI] [PubMed] [Google Scholar]
- 11.Jung MW, Wiener SI, McNaughton BL. Comparison of spatial firing characteristics of units in dorsal and ventral hippocampus of the rat. J Neurosci. 1994;14(12):7347–7356. doi: 10.1523/JNEUROSCI.14-12-07347.1994. [DOI] [PMC free article] [PubMed] [Google Scholar]
- 12.Kjelstrup KB, et al. Finite scale of spatial representation in the hippocampus. Science. 2008;321(5885):140–143. doi: 10.1126/science.1157086. [DOI] [PubMed] [Google Scholar]
- 13.Royer S, Sirota A, Patel J, Buzsáki G. Distinct representations and theta dynamics in dorsal and ventral hippocampus. J Neurosci. 2010;30(5):1777–1787. doi: 10.1523/JNEUROSCI.4681-09.2010. [DOI] [PMC free article] [PubMed] [Google Scholar]
- 14.Solstad T, Moser EI, Einevoll GT. From grid cells to place cells: A mathematical model. Hippocampus. 2006;16(12):1026–1031. doi: 10.1002/hipo.20244. [DOI] [PubMed] [Google Scholar]
- 15.Gothard KM, Skaggs WE, McNaughton BL. Dynamics of mismatch correction in the hippocampal ensemble code for space: Interaction between path integration and environmental cues. J Neurosci. 1996;16(24):8027–8040. doi: 10.1523/JNEUROSCI.16-24-08027.1996. [DOI] [PMC free article] [PubMed] [Google Scholar]
- 16.Gothard KM, Hoffman KL, Battaglia FP, McNaughton BL. Dentate gyrus and CA1 ensemble activity during spatial reference frame shifts in the presence and absence of visual input. J Neurosci. 2001;21(18):7284–7292. doi: 10.1523/JNEUROSCI.21-18-07284.2001. [DOI] [PMC free article] [PubMed] [Google Scholar]
- 17.Battaglia FP, Sutherland GR, McNaughton BL. Local sensory cues and place cell directionality: Additional evidence of prospective coding in the hippocampus. J Neurosci. 2004;24(19):4541–4550. doi: 10.1523/JNEUROSCI.4896-03.2004. [DOI] [PMC free article] [PubMed] [Google Scholar]
- 18.Maurer AP, Vanrhoads SR, Sutherland GR, Lipa P, McNaughton BL. Self-motion and the origin of differential spatial scaling along the septo-temporal axis of the hippocampus. Hippocampus. 2005;15(7):841–852. doi: 10.1002/hipo.20114. [DOI] [PubMed] [Google Scholar]
- 19.Terrazas A, et al. Self-motion and the hippocampal spatial metric. J Neurosci. 2005;25(35):8085–8096. doi: 10.1523/JNEUROSCI.0693-05.2005. [DOI] [PMC free article] [PubMed] [Google Scholar]
- 20.Skaggs WE, McNaughton BL, Wilson MA, Barnes CA. Theta phase precession in hippocampal neuronal populations and the compression of temporal sequences. Hippocampus. 1996;6(2):149–172. doi: 10.1002/(SICI)1098-1063(1996)6:2<149::AID-HIPO6>3.0.CO;2-K. [DOI] [PubMed] [Google Scholar]
- 21.Maurer AP, Cowen SL, Burke SN, Barnes CA, McNaughton BL. Phase precession in hippocampal interneurons showing strong functional coupling to individual pyramidal cells. J Neurosci. 2006;26(52):13485–13492. doi: 10.1523/JNEUROSCI.2882-06.2006. [DOI] [PMC free article] [PubMed] [Google Scholar]
- 22.Lengyel M, Szatmáry Z, Erdi P. Dynamically detuned oscillations account for the coupled rate and temporal code of place cell firing. Hippocampus. 2003;13(6):700–714. doi: 10.1002/hipo.10116. [DOI] [PubMed] [Google Scholar]
- 23.O’Keefe J, Burgess N. Dual phase and rate coding in hippocampal place cells: Theoretical significance and relationship to entorhinal grid cells. Hippocampus. 2005;15(7):853–866. doi: 10.1002/hipo.20115. [DOI] [PMC free article] [PubMed] [Google Scholar]
- 24.Mehta MR, Lee AK, Wilson MA. Role of experience and oscillations in transforming a rate code into a temporal code. Nature. 2002;417(6890):741–746. doi: 10.1038/nature00807. [DOI] [PubMed] [Google Scholar]
- 25.Harris KD, et al. Spike train dynamics predicts theta-related phase precession in hippocampal pyramidal cells. Nature. 2002;417(6890):738–741. doi: 10.1038/nature00808. [DOI] [PubMed] [Google Scholar]
- 26.Jaramillo J, Schmidt R, Kempter R. Modeling inheritance of phase precession in the hippocampal formation. J Neurosci. 2014;34(22):7715–7731. doi: 10.1523/JNEUROSCI.5136-13.2014. [DOI] [PMC free article] [PubMed] [Google Scholar]
- 27.Navratilova Z, Giocomo LM, Fellous JM, Hasselmo ME, McNaughton BL. Phase precession and variable spatial scaling in a periodic attractor map model of medial entorhinal grid cells with realistic after-spike dynamics. Hippocampus. 2012;22(4):772–789. doi: 10.1002/hipo.20939. [DOI] [PubMed] [Google Scholar]
- 28.Stensola H, et al. The entorhinal grid map is discretized. Nature. 2012;492(7427):72–78. doi: 10.1038/nature11649. [DOI] [PubMed] [Google Scholar]
- 29.Pastoll H, Solanka L, van Rossum MC, Nolan MF. Feedback inhibition enables θ-nested γ oscillations and grid firing fields. Neuron. 2013;77(1):141–154. doi: 10.1016/j.neuron.2012.11.032. [DOI] [PubMed] [Google Scholar]
- 30.Couey JJ, et al. Recurrent inhibitory circuitry as a mechanism for grid formation. Nat Neurosci. 2013;16(3):318–324. doi: 10.1038/nn.3310. [DOI] [PubMed] [Google Scholar]
- 31.Bonnevie T, et al. Grid cells require excitatory drive from the hippocampus. Nat Neurosci. 2013;16(3):309–317. doi: 10.1038/nn.3311. [DOI] [PubMed] [Google Scholar]
- 32.Buetfering C, Allen K, Monyer H. Parvalbumin interneurons provide grid cell-driven recurrent inhibition in the medial entorhinal cortex. Nat Neurosci. 2014;17(5):710–718. doi: 10.1038/nn.3696. [DOI] [PubMed] [Google Scholar]
- 33.Van Cauter T, Poucet B, Save E. Unstable CA1 place cell representation in rats with entorhinal cortex lesions. Eur J Neurosci. 2008;27(8):1933–1946. doi: 10.1111/j.1460-9568.2008.06158.x. [DOI] [PubMed] [Google Scholar]
- 34.Zhang SJ, et al. Optogenetic dissection of entorhinal-hippocampal functional connectivity. Science. 2013;340(6128):1232627. doi: 10.1126/science.1232627. [DOI] [PubMed] [Google Scholar]
- 35.Kitamura T, et al. Island cells control temporal association memory. Science. 2014;343(6173):896–901. doi: 10.1126/science.1244634. [DOI] [PMC free article] [PubMed] [Google Scholar]
- 36.Kiss J, Buzsaki G, Morrow JS, Glantz SB, Leranth C. Entorhinal cortical innervation of parvalbumin-containing neurons (Basket and Chandelier cells) in the rat Ammon’s horn. Hippocampus. 1996;6(3):239–246. doi: 10.1002/(SICI)1098-1063(1996)6:3<239::AID-HIPO3>3.0.CO;2-I. [DOI] [PubMed] [Google Scholar]
- 37.Zipp F, Nitsch R, Soriano E, Frotscher M. Entorhinal fibers form synaptic contacts on parvalbumin-immunoreactive neurons in the rat fascia dentata. Brain Res. 1989;495(1):161–166. doi: 10.1016/0006-8993(89)91231-6. [DOI] [PubMed] [Google Scholar]
- 38.Armstrong C, Szabadics J, Tamás G, Soltesz I. Neurogliaform cells in the molecular layer of the dentate gyrus as feed-forward γ-aminobutyric acidergic modulators of entorhinal-hippocampal interplay. J Comp Neurol. 2011;519(8):1476–1491. doi: 10.1002/cne.22577. [DOI] [PMC free article] [PubMed] [Google Scholar]
- 39.Koenig J, Linder AN, Leutgeb JK, Leutgeb S. The spatial periodicity of grid cells is not sustained during reduced theta oscillations. Science. 2011;332(6029):592–595. doi: 10.1126/science.1201685. [DOI] [PubMed] [Google Scholar]
- 40.Brandon MP, et al. Reduction of theta rhythm dissociates grid cell spatial periodicity from directional tuning. Science. 2011;332(6029):595–599. doi: 10.1126/science.1201652. [DOI] [PMC free article] [PubMed] [Google Scholar]
- 41.Brandon MP, Koenig J, Leutgeb JK, Leutgeb S. New and distinct hippocampal place codes are generated in a new environment during septal inactivation. Neuron. 2014;82(4):789–796. doi: 10.1016/j.neuron.2014.04.013. [DOI] [PMC free article] [PubMed] [Google Scholar]
- 42.Wang Y, Romani S, Lustig B, Leonardo A, Pastalkova E. Theta sequences are essential for internally generated hippocampal firing fields. Nat Neurosci. 2015;18(2):282–288. doi: 10.1038/nn.3904. [DOI] [PubMed] [Google Scholar]
- 43.Colgin LL, et al. Attractor-map versus autoassociation based attractor dynamics in the hippocampal network. J Neurophysiol. 2010;104(1):35–50. doi: 10.1152/jn.00202.2010. [DOI] [PMC free article] [PubMed] [Google Scholar]
- 44.Mizumori SJ, McNaughton BL, Barnes CA, Fox KB. Preserved spatial coding in hippocampal CA1 pyramidal cells during reversible suppression of CA3c output: Evidence for pattern completion in hippocampus. J Neurosci. 1989;9(11):3915–3928. doi: 10.1523/JNEUROSCI.09-11-03915.1989. [DOI] [PMC free article] [PubMed] [Google Scholar]
- 45.Kempter R, Leibold C, Buzsáki G, Diba K, Schmidt R. Quantifying circular-linear associations: Hippocampal phase precession. J Neurosci Methods. 2012;207(1):113–124. doi: 10.1016/j.jneumeth.2012.03.007. [DOI] [PubMed] [Google Scholar]
Associated Data
This section collects any data citations, data availability statements, or supplementary materials included in this article.