

Abstract
We conducted a systematic review and meta-analysis evaluating the relationship between menu calorie labeling and calories ordered or purchased in the PubMed, Web of Science, PolicyFile, and PAIS International databases through October 2013.
Among 19 studies, menu calorie labeling was associated with a −18.13 kilocalorie reduction ordered per meal with significant heterogeneity across studies (95% confidence interval = −33.56, −2.70; P = .021; I2 = 61.0%). However, among 6 controlled studies in restaurant settings, labeling was associated with a nonsignificant −7.63 kilocalorie reduction (95% confidence interval = −21.02, 5.76; P = .264; I2 = 9.8%).
Although current evidence does not support a significant impact on calories ordered, menu calorie labeling is a relatively low-cost education strategy that may lead consumers to purchase slightly fewer calories. These findings are limited by significant heterogeneity among nonrestaurant studies and few studies conducted in restaurant settings.
Consumption of fast food and food away from home has increased in the United States in recent decades.1,2 In 2007–2008, fast-food and full-service restaurants accounted for an estimated 275 kilocalories (kcal) per day among children aged 2 to 11 years, 564 kcal per day among adolescents aged 12 to 19 years, and 599 kcal per day among adults aged 20 to 64 years, or 14% of total energy intake for children and 24% for adolescents and adults.2 Furthermore, the consumption of fast food and food away from home has been associated with lower diet quality, greater energy intake, and higher body weight, making foods consumed away from home a possible target to counter the current obesity crisis.3–5
Beginning in 2005, the Institute of Medicine recommended posting calorie content on menus and menu boards in restaurants (hereafter “menu calorie labeling”) as a strategy to address the US obesity epidemic.6,7 Menu labeling proposals have been supported by the argument that consumers have a right to calorie information to allow them to make healthier choices in the context of the ongoing obesity epidemic.8 Without labeling, consumers regularly underestimate the caloric content of restaurant meals.8 Parallel evidence from nutrition labeling on packaged foods suggests that at least some consumers make healthier food choices when nutrition information is available at the point of purchase.9
By 2009, 4 states and a number of counties and cities around the country, including New York City, had passed menu calorie labeling legislation.9 Concerned with the difficulty of compliance with a range of local regulations, the National Restaurant Association supported a national menu calorie labeling law that would preempt local regulations. In 2010, the Patient Protection and Affordable Care Act of 2010 required menu calorie labeling by chain restaurants. To implement the menu calorie labeling law, in December 2014, the US Food and Drug Administration released final regulations requiring calorie labels and a suggested daily total calorie intake (hereafter “daily anchor statement”) on all menus and menu boards for restaurants and similar establishments with 20 or more locations.10
The impact of menu labeling on food choices in cafeterias and restaurants was evaluated in 3 previous systematic reviews.11–13 The previous narrative reviews did not provide a quantitative estimate of the potential population-level impact that this relatively low-cost and broad-reaching policy intervention may have. Pooling data across studies with small sample sizes would increase the statistical power to detect a small, but meaningful, association between menu labeling and population-level purchasing behaviors. Sinclair et al. recently reported the results of a systematic review and meta-analysis of calorie and other types of restaurant menu labeling, but included a broader definition of menu labeling not relevant to current regulations in the United States and did not quantitatively summarize the impact of menu calorie labeling in restaurant settings, which is the primary focus of the current review.14
We conducted the current systematic review and meta-analysis as part of the Childhood Obesity Intervention Cost Effectiveness Study project, which is evaluating a range of policy and programmatic interventions to reduce obesity in the United States. The objective of this review is to provide the evidence needed to quantitatively evaluate the potential impact of the national menu calorie labeling regulations proposed in the Affordable Care Act. The regulations promulgated by the Food and Drug Administration will require menu calorie labeling and a suggested daily anchor statement for restaurants with 20 or more locations. In this review, we evaluated the impact of menu calorie labeling with or without a daily anchor statement compared with menus without calorie labeling on calories ordered, purchased, or consumed during the meal as well as impact on total daily energy intake or weight or body mass index (BMI; defined as weight in kilograms divided by the square of height in meters) or BMI z score among adults and children of any age from experimental and quasi-experimental studies.
METHODS
We conducted this meta-analysis according to the Preferred Reporting Items for Systematic Reviews and Meta-Analyses (PRISMA) Statement guidelines and conducted it with a systematic review protocol developed for the Childhood Obesity Intervention Cost Effectiveness Study project.15 The review is not registered with PROSPERO or other systematic review databases.
Eligibility Criteria
The search strategy for the systematic review included all studies conducted among any population with no age or other population restrictions that assessed the impact of menu calorie labeling (with or without a daily anchor statement) compared with control conditions without calorie labeling or other nutrition information on change in weight or BMI or BMI z score, as well as the association with potential intermediates, including change in calories ordered or purchased during a single meal, calories consumed during a single meal, or total daily energy intake. However, because of a lack of any identified studies that assessed the impact of menu calorie labeling on BMI or BMI z score, weight, or total energy intake, and only 2 studies that assessed energy consumption during a meal,16,17 the current meta-analysis focused on calories ordered or purchased during a single meal.
We excluded studies or comparisons that evaluated the impact of menu labeling formats not included in the federal menu calorie labeling laws, such as nutrition facts labels (e.g., fat content or sodium in addition to total calories), “traffic light” labels, physical activity labels, menu items ranked by calorie content, and percentage daily energy intake labels. We excluded studies not published in English. We excluded dissertations and other non–peer-reviewed gray literature. We included all experimental and quasi-experimental studies but excluded cross-sectional studies at a single time point, because they are prone to confounding.
Information Sources and Search
We searched PubMed, Web of Science, PolicyFile, and PAIS International.18–21 All database searches were last conducted on October 3, 2013. We applied no start date restrictions in any of the database searches. We broadly constructed searches to include a combination of terms to capture restaurants (e.g., “restaurant” or “fast food” or “menu” or “cafeteria”) and calorie labeling (e.g., “label” or “display” or “calorie” or “energy”). Search terms and results for the last date searched for each database are included in the appendix (available as a supplement to this article at http://www.ajph.org). In addition, we reviewed references for inclusion from 3 previous systematic reviews.11–13 We reviewed citations from included studies for additional relevant titles not included in the initial search or previous reviews.
Following removal of duplicate articles identified through a systematic review software program and reviewed by 1 reviewer (H. B.), 2 reviewers (M. W. L. and H. B.) independently screened titles, abstracts, and full articles for relevance and eligibility. We resolved disagreement by consensus.
Data Collection Process and Data Items
For each article identified, 2 authors extracted the following information by using a standardized abstraction form developed for this study: authors, publication year, study design (randomized controlled trial, natural experiment with control, natural experiment without control), labeling type (calories, calories plus anchor statement), study duration, setting (fast food, coffee shop, sit-down restaurant, laboratory, Internet, or other nonrestaurant setting), sample size and population characteristics, outcome (calories ordered or purchased, calories consumed during the meal, total daily energy intake, weight, BMI, or BMI z score), outcome assessment methods (e.g., in-person order, transaction records, online order), effect estimate(s), and variance. We extracted results for children and adults and for men and women if these outcomes were reported in the same study separately and did not include a single summary estimate across groups. For all other demographic variables, we combined estimates when results were only reported by subgroups, based on methods in the Cochrane Handbook for Systematic Reviews of Interventions.22
For studies that reported results from different settings (e.g., fast-food restaurants and coffee shops) separately, we extracted results from each setting separately. For studies with multiple intervention factorial designs, we combined outcomes for all arms that included menu calorie labeling with or without a daily anchor statement compared with all arms without menu calorie labeling. For natural experiment studies, where available, we extracted multivariable-adjusted parameter estimates and corresponding variance measures. For studies that reported findings from more than 1 multivariable model, we extracted results from the fully adjusted models, but without inclusion of potential intermediates on the causal pathway between exposure and outcome (e.g., number of items ordered, total spending per meal). If multivariable-adjusted results were not available in natural experiment studies, we extracted the mean change and standard deviation from baseline to follow-up. For randomized controlled trials, we extracted the mean and standard deviation of calories ordered or purchased across intervention and control groups for studies with 1 measurement period and the mean change and standard deviation of change for studies with more than 1 measurement period.
Summary Measures and Synthesis of Results
Because there were no studies that evaluated impact on change in BMI, weight, or total daily caloric intake, our primary outcome of interest was the change in the number of calories in a single meal ordered or purchased with and without menu calorie labeling. One study was converted from kilojoules to kilocalories based on 4.2 kilojoules per kilocalorie.23 We contacted authors of 5 studies23–27 and received additional information on means and standard deviations from 3 randomized controlled trial studies.23–25 For 2 studies for which additional detail on means and standard deviations by labeling condition was not available, we extracted the main effect of menu calorie labeling and daily anchor statements from regression models.26,27 For one study28 that did not report the standard deviation for the measurement of change before and after menu calorie labeling in intervention restaurants and unexposed control restaurants, we imputed this value by using the correlation coefficient method referenced in the Cochrane Handbook for Systematic Reviews of Interventions.22 We used a correlation coefficient of zero because the change scores were based on independent samples in both the intervention and control community. For 2 natural experiment studies that reported change coefficients for more than 1 time period, we estimated the effect estimate for the longest follow-up period compared with baseline.29,30
We calculated the summary effect estimate of the association between menu calorie labeling and changes in calories ordered or purchased per meal based on a random-effects meta-analysis, which is considered more conservative than fixed-effects models in the presence of between-study heterogeneity.22 We also conducted stratified analyses for children and adults and across study setting and design. We calculated the I2 statistic to assess between-study heterogeneity, with I2 greater than 50% indicating significant heterogeneity, warranting investigation into potential sources of heterogeneity.31
To assess the risk of bias in individual studies, we conducted sensitivity analyses stratifying by study setting (i.e., restaurant vs nonrestaurant settings) and by study design within restaurant setting studies (i.e., controlled vs uncontrolled designs). Estimates from the studies conducted in restaurant settings with control were deemed to be at the lowest risk of bias in terms of both internal validity and external and construct validity.32 We assessed publication bias through visual inspection of the funnel plot and the Begg’s test, which tests for a rank correlation between standardized intervention effects and standard errors.33 We performed all analyses with Stata version 13.1 (StataCorp LP, College Station, TX).
RESULTS
The literature search and references from 3 previous systematic reviews yielded 3598 unique citations (Figure 1). We identified no additional relevant titles from citations in included studies. Following exclusion of irrelevant articles based on review of titles (n = 3415) and abstracts (n = 148), we selected 35 articles for full-text review. After review of the full text, we identified 19 articles with estimates of the impact of menu calorie labeling on calories ordered or purchased during a single meal for inclusion in the meta-analysis. We identified 2 studies that measured the impact of menu calorie labeling on calories consumed during the meal,16,17 and 1 that evaluated the impact on calories later in the evening based on a dietary recall interview the following morning.17 We did not find any studies that evaluated a change in weight, BMI, or BMI z scores.
FIGURE 1—

Summary of evidence search and selection of studies evaluating the relationship between menu calorie labeling and total calories ordered or purchased in PubMed, Web of Science, PolicyFile, and PAIS International through October 2013.
We excluded 3 studies that did not measure the change in calories ordered or purchased.34–36 We excluded 8 studies that labeled nutritional content of meals in addition to calorie content, which is beyond the scope of the current proposed legislation.37–44 We excluded 2 studies that did not label all food items on the menu or labeled only a limited selection of snack items.45,46 We excluded 1 study published in 1976 because of lack of a measure of variance and inability to contact authors.47 We excluded 1 study because of the publication of an interaction model from which the main effect of menu calorie labeling and related variance could not be extracted.48 We excluded 1 cross-sectional comparison of calories ordered in restaurants with and without menu calorie labeling at a single time point only.49
Study Characteristics
Characteristics of the 9 studies conducted in restaurant settings are presented in Table 1. One study was a randomized controlled trial,24 and 8 were natural experiment studies.26,28–30,50–53 Five of the natural experiment studies analyzed the impact of menu calorie labeling implemented in New York City,26,28,50–52 and 3 studies evaluated the impact of menu calorie labeling in King County, Washington.29,30,53 Five of the natural experiment studies compared change in calories purchased per transaction or per meal before and after implementation of menu calorie labeling to change in calories ordered during the same period in control communities.28,29,50,52,53 Three of the studies evaluated change in calories purchased before and after implementation without a control community.26,30,51 One study presented results stratified by fast-food and coffee settings,30 and 1 study evaluated changes only in coffee shops.50 Sample sizes in restaurant setting studies ranged from 133 participants53 to an analysis of approximately 100 million transactions.50 Five studies in restaurant settings included only adults or older adolescents,24,26,30,51,52 2 studies analyzed transaction data with no information on customer age,29,50 1 study evaluated parents’ orders for themselves and their children,53 and 1 study evaluated a combination of adolescent orders (13–17 years of age) and parental orders on behalf of children (1–12 years of age).28 Study duration ranged from a single exposure in a randomized controlled trial to follow-up 18 months after implementation of menu calorie labeling regulations.24,30
TABLE 1—
Characteristics of Studies that Assessed the Impact of Menu Calorie Labeling on Energy Purchased in Restaurant Settings in a Systematic Review and Meta-Analysis of Studies Through October 2013
| Study (Year) | Design | Intervention | Setting | Population | Duration | Assessment | Outcome | Results |
| Bollinger et al. (2011)50 | Natural experiment with control | Data collected before and after introduction of menu calorie labeling in New York City with no calorie labeling in comparison cities | Chain coffee shop | All Starbucks chain locations in New York City, Boston, and Philadelphia (∼100 million transactions) | Complete transaction records for 3 mo prelabeling and 11 mo postlabeling | Transaction records | kcal purchased per transaction | Difference-in-difference: log(kcal)b = −0.060 (SE = 0.001) |
| −14.4 kcal (SE = 0.247) | ||||||||
| Downs et al. (2013)26 | Natural experiment without control | Data collected before and after introduction of menu calorie labeling in New York City; subjects randomized to receive per meal anchor, daily anchor, or no calorie anchor | Fast-food restaurants | 1094 adults | 2 mo prelabeling and 2 mo postlabeling | Intercept receipts | kcal purchased per meal | Model with adjustment for neighborhood, gender, age, race/ethnicity, calorie recommendation: |
| Labeling b = 17.74 (SE = 28.20) | ||||||||
| Daily anchor b = 61.44 (SE = 34.22) | ||||||||
| Combined effect = 79.18 (SE = 62.42) | ||||||||
| Dumanovsky et al. (2011)51 | Natural experiment without control | Data collected before and after introduction of menu calorie labeling in New York City | Fast-food restaurants | 15 798 adults | 1 y prelabeling and 9 mo postlabeling | Intercept receipts | kcal purchased per meal | Model with adjustment for chain, gender, neighborhood poverty: b = 15.3 kcal (95% CI = 34.5, −3.8) |
| Elbel et al. (2011)28 | Natural experiment with control | Data collected before and after introduction of menu calorie labeling in New York City with no calorie labeling in comparison city | Fast-food restaurants | 349 children and adolescents aged 1–17 y | 2 wk prelabeling, 1 mo postlabeling | Intercept receipts | kcal purchased per meal | Calorie labeling |
| Prelabeling mean: 643 kcal (SD = 334) | ||||||||
| Postlabeling mean: 652 kcal (SD = 330) | ||||||||
| Control | ||||||||
| Prelabeling mean: 611 kcal (SD = 366) | ||||||||
| Postlabeling mean: 673 kcal (SD = 265) | ||||||||
| Elbel et al. (2009)52 | Natural experiment with control | Data collected before and after introduction of menu calorie labeling in New York City with no calorie labeling in comparison city | Fast-food restaurants | 1125 adults | 2 wk prelabeling, 1 mo postlabeling | Intercept receipts | kcal purchased per meal | Difference-in-difference: |
| b = 19 kcal (SE = 58) | ||||||||
| Ellison et al. (2013)24 | Randomized controlled trial | Participants randomized to order from college restaurant menu with calorie labeling, labeling plus traffic light, or no labeling | Sit-down college restaurant | 138 adults | Single exposure | In-person order | kcal purchased per meal | Calorie labeling mean: 817 kcal (SD = 328) |
| Control mean: 765 kcal (SD = 368) | ||||||||
| Finkelstein et al. (2011)29 | Natural experiment with control | Data collected before and after introduction of menu calorie labeling in King County, WA, with no calorie labeling in comparison counties | Fast-food restaurants | Monthly transaction data (∼10 000 per store per month) from 7 intervention and 7 control restaurants | Complete transaction records for 12 mo prelabeling and 13 mo postlabeling | Transaction records | kcal purchased per transaction | Difference-in-difference adjusting for season: |
| b = 18.5 kcal (SE = 15.11) | ||||||||
| Krieger et al. (2013)30 | Natural experiment without control | Data collected before and after introduction of menu calorie labeling in King County, WA | Fast-food restaurants and coffee chain | 7325 participants aged ≥ 14 y | Data collected 1–3 mo prelabeling, 4–6 mo and 16–18 mo postlabeling | Intercept receipts | kcal purchased per meal | Post period 2 change controlling for chain type, gender, race/ethnicity, age, and location: |
| Food chains: | ||||||||
| b = −35.5 kcal (95% CI = −75.5, 4.4) | ||||||||
| Coffee chains: | ||||||||
| b = −26.3 kcal (95% CI = −40.0, −12.7) | ||||||||
| Tandon et al. (2011)53 | Natural experiment with control | Data collected before and after introduction of menu calorie labeling in King County, WA, with no calorie labeling in comparison county | Fast-food restaurants | 133 parent–child pairs with children aged 6–11 y | One meal prelabeling and 1 meal 3–6 mo postlabeling | Mailed receipt with telephone survey | kcal purchased per meal | Difference-in-difference; Model: |
| Children: b = 34 kcal (95% CI = −90, 159) | ||||||||
| Adults: b = 5 kcal (95% CI = −119, 129) |
Notes. CI = confidence interval.
The characteristics of the 10 studies conducted in nonrestaurant settings are presented in Table 2. All of these studies were randomized controlled trials, 4 were conducted on the Internet,23,54–56 3 were conducted in laboratories,16,17,57 2 were conducted on sidewalks,25,27 and 1 in a hospital waiting room.58 Three of these studies randomized the participants to order food that they would be eating from an actual menu.16,17,27 Seven studies evaluated the impact of menu calorie labeling based on orders from a hypothetical menu from which participants did not expect to eat a meal. All of the nonrestaurant setting studies evaluated the impact of menu calorie labeling on calories ordered based on a single intervention time point. Sample sizes in the nonrestaurant studies ranged from 9958 to 129423 participants in the intervention and control conditions. Eight nonrestaurant studies included only adult participants, 1 study evaluated parents’ orders for themselves and their children,58 and 1 study included both adolescents and adults.16
TABLE 2—
Characteristics of Studies That Assessed the Impact of Menu Calorie Labeling on Energy Ordered in Nonrestaurant Settings in a Systematic Review and Meta-Analysis of Studies Through October 2013
| Study (Year) | Design | Intervention | Setting | Population | Duration | Assessment | Outcome | Results |
| Dowray et al. (2013)54 | Individual randomized controlled trial | Individuals randomized to order from hypothetical fast-food menus with no labeling, calorie labeling, and labeling plus physical activity anchors | Internet | 802 adults | Single Exposure | Internet order | kcal ordered per meal | Calorie labeling mean: |
| 927.05 kcal (SD = 681.74) | ||||||||
| Control mean: | ||||||||
| 1020.15 kcal (SD = 579.45) | ||||||||
| Harnack et al. (2008)16 | Individual randomized controlled trial | Individuals randomized to order from fast-food menus with calorie labeling and daily anchor, with calorie labeling and anchor without value pricing, with no calorie label and without value pricing, or standard menus including value pricing | Laboratory | 594 adults and adolescents aged ≥ 16 y | Single exposure | In-person order and weighed plate waste | kcal ordered and consumed per meal | Calorie labeling with daily anchor mean: |
| 873.6 kcal (SD = 439.1) | ||||||||
| Calorie labeling with daily anchor plus price mean: | ||||||||
| 842.3 kcal (SD = 425.3) | ||||||||
| Price mean: | ||||||||
| 881.7 kcal (SD = 353.6) | ||||||||
| Control mean: 827.5 kcal | ||||||||
| (SD = 400.6) | ||||||||
| Liu et al. (2012)55 | Individual randomized controlled trial | Individuals randomized to order from hypothetical sit-down restaurant menu with no labeling, calorie labeling with a daily anchor, rank-ordered calories with a daily anchor, rank-ordered color coded calories with daily anchor | Internet | 419 adults | Single exposure | Internet order | kcal ordered per meal | Calorie labeling with daily anchor mean: 1675.52 kcal (SD = 1367.13) |
| Control mean: 1759.61 kcal (SD = 1965.71) | ||||||||
| Morley et al. (2013)23 | Individual randomized controlled trial | Individuals randomized to order from hypothetical menus with no labels, kj labels with a daily anchor, kj and % daily intake labels, kj and traffic light, or kj and traffic light and % daily intake | Internet | 1294 adults | Single exposure | Internet order | kcal ordered per meal (converted from kj, 4.2 kj = 1 kcal) | Calorie labeling with daily anchor mean: |
| 985.02 kcal (SD = 391.17) | ||||||||
| Control mean: | ||||||||
| 1101.63 kcal (SD = 432.52) | ||||||||
| Roberto et al. (2010)17 | Individual randomized controlled trial | Individuals randomized to order from menus with calorie labeling, with calorie labeling and daily anchor, or no labeling | Laboratory | 295 adults | Single exposure | In-person order, weighed plate waste, and food recall for period after dinner | kcal ordered and consumed per meal and kcal consumed for the rest of the day | kcal ordered |
| Calorie labeling: mean: 1862.23 kcal (95% CI = 1655, 2069) | ||||||||
| Calorie labeling with daily anchor mean: 1859.7 (95% CI = 1661, 2058) | ||||||||
| Control mean: | ||||||||
| 2189.37 (95% CI = 1981, 2397) | ||||||||
| Roseman et al. (2013)25 | Individual randomized controlled trial | Individuals randomized to order from hypothetical menus with and without calorie labels | Street corner intercept | 302 adults | Single exposure | In-person order | kcal ordered per meal | Calorie labeling mean: |
| 718 kcal (SD = 187) | ||||||||
| Control mean: | ||||||||
| 719 kcal (SD = 195) | ||||||||
| Wei and Miao (2013)56 | Individual randomized controlled trial | Individuals randomized to order from hypothetical menus with and without calorie labeling from “healthy” and “unhealthy” fast-food categories | Internet | 178 adults | Single exposure | Internet order | kcal ordered per meal | Calorie labeling mean: 643.44 kcal (SD = 264.6) Control mean: 663.65 kcal (SD = 279.53) |
| Gerend (2009)57 | Individual randomized controlled trial | Individuals randomized to order from hypothetical fast-food menus with and without calorie labeling | Laboratory | 288 college students | Single exposure | In-person order | kcal ordered per meal | Women: Calorie labeling mean: 788 kcal (SD = 274) Control mean: 934 kcal (SD = 371) Men: Calorie labeling mean: 1144 kcal (SD = 362) Control mean: 1052 kcal (SD = 313) |
| Tandon et al. (2010)58 | Individual randomized controlled trial | Individuals randomized to order for themselves and their child from a hypothetical fast-food menu with and without calorie labeling | Health care waiting room | 99 parents with children aged 3–6 y visiting a pediatric clinic | Single exposure | In-person order | kcal ordered per meal | Children: |
| Calorie labeling mean: 569.1 kcal (SD = 208.1) | ||||||||
| Control mean: 671.5 kcal (SD = 263.5) | ||||||||
| Adults: | ||||||||
| Calorie labeling mean: 765.9 kcal (SD = 385.9) | ||||||||
| Control mean: 759.3 kcal (SD = 523.5) | ||||||||
| Wisdom et al. (2010)27 | Individual randomized controlled trial | Individuals intercepted before fast-food entry and randomized to order from a menu with calorie labeling, calorie labeling and daily anchor, or no label and with and without menu order modifications | Street corner intercept | 632 adults | Single exposure | In-person order | kcal ordered per meal | Model with adjustment for daily anchor, healthy feature menu manipulation, gender, age, race/ethnicity, study: |
| Labeling: b = −60.69 (SE = 18.95) | ||||||||
| Daily anchor: b = −37.81 (SE = 18.83) | ||||||||
| Combined effect: b = −98.5 (SE = 37.78) |
Notes. CI = confidence interval.
Impact of Menu Calorie Labeling on Calories Ordered or Purchased
On the basis of data from 23 comparisons from 19 studies, we found a small but statistically significant inverse association between menu calorie labeling and calories ordered or purchased per meal or transaction (–18.13 kcal; 95% confidence interval [CI] = −33.56, −2.70; P = .021; Figure 2). There was significant between-study heterogeneity across the 23 comparisons (I2 = 61.0%, P for heterogeneity < .001). When we stratified studies by setting, the estimated reduction in calories ordered or purchased per meal from studies conducted in nonrestaurant (i.e., laboratory, Internet, health care, and street corner interview) remained statistically significant but still exhibited substantial heterogeneity, with approximately 60 fewer calories ordered in the presence of menu calorie labeling compared with control conditions (–58.16 kcal; 95% CI = −102.44, −13.87; P = .01; I2 = 61.0%, P for heterogeneity = .003). By contrast, studies conducted in restaurant settings did not show an association between menu calorie labeling and calories purchased per meal (–6.70 kcal; 95% CI = –20.21, 6.81; P = .331; I2 = 54.8%, P for heterogeneity = .014). Exclusion of the 4 estimates from studies conducted in restaurant settings without a control, which was done to evaluate the risk of bias in individual studies, also resulted in a nonsignificant negative association (–7.63 kcal; 95% CI = –21.02, 5.76; P = .264; I2 = 9.8%; P for heterogeneity = .354; Figure 3). We consider this final estimate to have the lowest risk of within-study bias by combining a study setting and implementation, which provides the strongest construct and external validity generalizable to real-world implementation of restaurant menu calorie labeling with controlled experimental and quasi-experimental designs that maximize internal validity compared with uncontrolled studies.32
FIGURE 2—

Change in calories ordered or purchased per meal or transaction associated with menu calorie labeling compared with standard menus stratified by restaurant and nonrestaurant setting: systematic review and meta-analysis of studies through October 2013.
Note. CI = confidence interval. Weights are from random effects analysis. Horizontal lines represent the study 95% confidence intervals. Solid diamonds represent the point estimate (change in kcal ordered or purchased per meal) from each study. The open diamond represents the pooled estimate of the effect of menu labeling and the 95% confidence intervals around the estimate. The dashed line represents the point estimate of the pooled estimate. Results were stratified by study setting (restaurant vs nonrestaurant settings).
FIGURE 3—
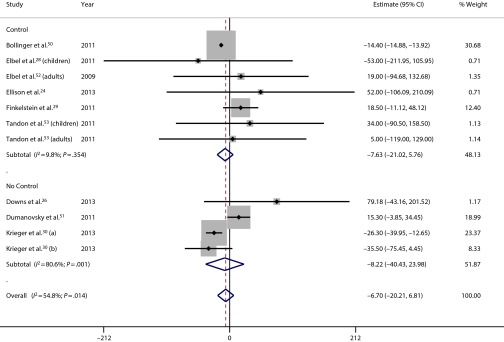
Change in calories ordered associated with menu calorie labeling compared with standard menus in restaurant settings stratified by study design: systematic review and meta-analysis of studies through October 2013.
Note. CI = confidence interval. Horizontal lines represent the study 95% confidence intervals. Solid diamonds represent the point estimate study (change in kcal ordered or purchased per meal) from each study. The open diamond represents the pooled estimate of the effect of menu labeling and the 95% confidence interval around the estimate. The dashed line represents the point estimate of the pooled estimate.
In an a priori subgroup analysis by age group among the 3 studies that included separate estimates for children and adolescents,28,53,58 menu calorie labeling was associated with a nonsignificant decrease in calories ordered or purchased (–47.59 kcal; 95% CI = –132.75, 37.57; P = .273; I2 = 32.0%; P for heterogeneity = .23; Figure A, available as a supplement to this article at http://www.ajph.org) compared with 20 estimates from studies conducted among adults or based on transaction data without information on customers’ age (–16.47 kcal; 95% CI = –32.19, −0.75; P = .04; I2 = 63.6%; P for heterogeneity < .001).
Although we have the most confidence in the controlled studies conducted in restaurant settings, these studies have a number of limitations. The findings from Bollinger et al., the largest and one of the best-designed studies, which included more than 100-million chain coffee shop transactions, may not be generalizable to other types of fast-food outlets nor to chain customers who no longer purchased food at the chain after labeling began.50 Bollinger et al. found that the −14 kcal reduction per transaction was largely explained by customers’ decisions to order only coffee and to skip food items altogether, rather than by a reduction in calories per food item. However, a major strength of this analysis was its ability to evaluate individual-level changes in calories purchased via store loyalty cards by using a fixed-effects analysis, which controls for confounding by stable individual and community characteristics in the control and treatment communities by restricting the effect estimate to within-person changes.59 From this analysis, Bollinger et al. were able to show that the overall reduction in calories ordered was not attributable to a shift in the type of customers at the coffee chain, but rather was because of the reduction of total calories ordered per visit among frequent customers. By contrast, the only other large, controlled study based on purchases in restaurant settings, by Finkelstein et al., found a nonsignificant increase in calories purchased per transaction (19 kcal).29 However, the study was based on transactions from a single regional chain quick-service restaurant in King County and did not have access to individual-level data needed to control for selection bias.
Two large studies that evaluated the effect of menu calorie labeling in New York City and King County in a broader range of restaurants, but that did not measure changes in a control community to account for concurrent secular trends, had inconsistent findings.30,51 Although the study by Dumanovsky et al. was well-powered and included follow-up measurement 9 months after implementation of menu labeling, the lack of a control group made the findings subject to confounding. For example, Subway restaurants launched a national value-pricing promotion during the study period, which may have led to the substantial increase in calories per transaction in this chain restaurant compared with the reductions observed in many of the other restaurant chains included in the sample.51 By contrast, Krieger et al. found a significant reduction in calories per order in coffee chains and a marginally significant reduction in calories per order at fast-food restaurants after 16 to 18 months of menu labeling implementation in King County, WA.30 The reductions were not observed in the short-term 4 to 6 months of follow-up. The observed longer-term reductions may be caused in part by a significant voluntary reduction in entrée calories served by restaurant chains in King County from 6 to 18 months following implementation of local menu calorie labeling regulations.60
A review of the funnel plot (Figure B, available as a supplement to the online version of this article at http://www.ajph.org) of study effect estimates against their standard errors shows that studies are generally symmetrical across the range of study precision, with the exception of 4 outlier estimates that are below the expected confidence limit given their standard errors.17,23,27,57 These studies were conducted in a laboratory,17,57 online,23 and on a street corner outside fast-food restaurants.27 These outlier studies reported a relatively large reduction in calories associated with menu calorie labeling (–328 kcal, –146 kcal, −117 kcal, and −99 kcal, respectively). Excluding these studies from the overall analysis resulted in a nonsignificant association between menu calorie labeling and calories ordered or purchased (–7.88 kcal; 95% CI = –20.03, 4.27; P = .204; I2 = 41.3%; P for heterogeneity = .032; Figure C, available as a supplement to this article at http://www.ajph.org). When we used the Begg test for small-study effects, which tests for a rank correlation between the standardized intervention effect and its standard error, there was no indication for significant publication bias (z = 0.16; P = .87).
DISCUSSION
This meta-analysis of 19 intervention studies found evidence of an overall small (–18 kcal per meal) but significant reduction in calories ordered or purchased per meal associated with menu calorie labeling. However, significant heterogeneity across all 19 studies and questions regarding the generalizability of studies conducted in nonrestaurant settings raises concern that the overall finding may not reflect actual consumer responses to menu labeling. As such, the summary of 6 studies conducted in restaurants with control conditions represents the best estimate of the expected impact of upcoming national menu calorie labeling regulations. In contrast to the significant (–58 kcal) reduction among studies conducted online or in laboratory or other nonrestaurant settings, studies in restaurants with control were associated with a nonsignificant decrease in calories purchased per meal (–8 kcal). These findings suggest that nonrestaurant studies may have overestimated the effect of implementing menu calorie labeling regulations in real-world settings.
Despite broad interest among the public health research community and the passage of national menu calorie labeling legislation, there is minimal evidence to support menu calorie labeling as a strategy to directly influence consumer behavior to substantially reduce calories purchased at restaurants. The studies by Dumanovsky et al. and Krieger et al. highlight the potential pitfalls and benefits of national menu calorie labeling regulations.30,51 If restaurant chains engage in value pricing promotions to offset consumer responses to menu calorie labeling, changes in pricing that encourage higher calorie purchases could counteract potential decreases in calories ordered because of menu calorie labeling. If, however, restaurants reduce the calories served in their meals in response to increased awareness about highly caloric meals, menu calorie labeling may lead to a substantial reduction in calories purchased even without consumer awareness. Smaller portion sizes are one way for restaurants to make their menu items have lower calories; however, unhealthful reformulations, such as making items lower in fat while increasing sodium, sugar, or refined carbohydrate content, may lead to unintended harmful health consequences. Ongoing monitoring of pricing, calorie content, and nutritional quality of restaurant items across a wide variety of chains is necessary for researchers to disentangle the complex changes in response to implementation of national menu calorie labeling regulations.
Although this meta-analysis found only a small change in calories ordered or purchased with menu calorie labeling on average, it is possible that heterogeneity across demographic subgroups is masking both decreases and increases in purchases for some consumers. For example, our stratified analysis by age group trended toward greater reductions among children and adolescents, although this estimate was based on only 3 studies and was also not significant (48 kcal).28,53,58 Some studies, including 2 of the largest studies,30,50 found evidence that women may reduce calories purchased more than men in response to menu calorie labeling, although this relationship was not seen consistently across all of the studies that presented results by gender.
In addition, differences by race/ethnicity, BMI category, and neighborhood socioeconomic status were inconsistent. It is also possible that, independent of these demographic subgroups, some consumers may differentially pay attention to calorie labels, and that this attention will lead to greater impact among this group. Dumanovsky et al. found that, following implementation of menu calorie labeling in New York City, after control for neighborhood poverty, age, and gender, customers who reported using calorie information purchased 96 fewer calories compared with customers who did not notice or use the calorie information.51 By contrast, in their study on the impact of labeling in a low-income community in New York City, Elbel et al. did not find that attention and reported use of menu calorie labeling was associated with lower calories purchased.52
Although menu calorie labeling studies conducted in laboratories or other nonrestaurant settings may overestimate consumer responses in restaurant settings, conducting experiments in the absence of implemented policy change offers important guidance to decision-makers seeking to improve menu labeling and other food labeling strategies. Federal menu calorie labeling regulations require restaurants to post a statement on the menu board that provides customers with a recommended total daily energy intake. Six studies evaluated the effect of combining a daily anchor statement with calorie labeling,16,17,23,26,27,55 although only 3 studies evaluated calorie labeling with and without an anchor statement.17,26,27 In a 2-by-2 factorial design, Wisdom et al. found that providing a daily anchor statement had a significant effect of reducing calories ordered by an additional 38 kcal per meal.27 By contrast, Downs et al. found that providing a daily or per meal anchor statement before patrons entered restaurants was not significantly associated with calories purchased and did not significantly modify the effect of menu calorie labeling.26 Although Roberto et al. similarly found that a daily anchor statement did not have an impact on calories ordered or consumed during the meal, they found that the daily anchor statement led to a relative reduction in calories eaten later in the evening when compared with menu calorie labeling alone.17 Therefore, it is possible that federal menu calorie labeling regulations may lead to reductions in total daily energy intake even if they result in no measureable change in calories purchased at the restaurant meal with menu calorie labeling and a daily anchor statement. This point warrants additional research.
Although not included in the federal regulations and not evaluated in this meta-analysis, a few studies tested whether novel labeling presentations were more effective than calorie labeling. These studies may be useful in guiding future revisions to menu labeling regulations in the United States, new legislation in other countries, or labeling interventions in nonrestaurant settings, such as workplace cafeterias. Dowray et al. did not find a significant difference in calories ordered between menus with calorie labels and menus with calorie labels plus physical activity equivalents in minutes or distance of walking.54 Liu et al. found that, although calorie labeling with a daily anchor statement was not associated with a significant reduction in calories ordered, combining these labels with rank ordering of items by calorie content from low to high was associated with a significant reduction compared with no calorie labeling or rank ordering.55 Morley et al. tested a range of labeling formats including calorie labeling and daily anchor statements with or without percentage daily intake labeling and traffic light symbols. Although the calorie labeling and daily anchor statement condition along with the calorie labeling, anchor statement, and traffic light conditions resulted in significant reductions compared with no labeling, the labeling conditions that also included percentage daily intake values were not significantly different than the no labeling condition.23 Although there are some promising innovations in menu labeling, no clear alternative or modification to the regulated menu calorie labeling format has been established.
Limitations
There are a number of important limitations for many of the studies included in this meta-analysis. The majority of studies, and particularly the randomized trials, were underpowered to detect potentially small effects of menu calorie labeling on consumer behavior. Although all studies in nonrestaurant settings used randomized controlled designs, these designs do not control for potentially biased estimates of how menu calorie labeling would have an impact on consumer behavior in realistic restaurant settings.
In addition to potential lack of external validity because of evaluation in artificial settings, these studies were not designed to evaluate the relevant construct of how menu calorie labeling would have an impact on a purchased meal intended for consumption. Only 3 of the 10 studies conducted in nonrestaurant studies evaluated meals ordered for actual consumption, and 1 asked participants to purchase the meal with their own money.16,17,27 With the focus of generalizing these results to real consumer behavior to evaluate the potential impact of national menu calorie labeling in the United States, we believe that these studies conducted in nonrestaurant settings are at high risk of bias. Although the quasi-experimental studies with control conducted in restaurant settings eliminate these concerns, the lack of randomization for all but one of the studies in a restaurant setting increased risk of confounding. However, the difference-in-difference designs, including within-person change-in-change analyses for 2 studies, reduce this threat substantially.
In addition to limitations of the individual studies, there are also important limitations to the meta-analysis. Although we attempted to identify sources of heterogeneity between studies by stratifying studies on the basis of design and setting, there were not enough studies to fully explain the observed variation among studies. Specifically, significant unexplained variation remained across the 10 nonrestaurant setting studies, limiting our ability to provide a single summary estimate of the effect of menu calorie labeling in these settings. It is possible that, with a larger number of studies, we could explain the source of this variation. In addition, although the statistical test for potential publication bias was not significant, these tests are generally underpowered and may not have detected publication bias in our sample of studies. On the basis of our funnel plot analysis, excluding outlier studies with large effects relative to their standard errors reduced the summary effect across all studies and reduced heterogeneity. It is possible that smaller studies with null results or results that went in the opposite of the hypothesized direction may not have been published.
Despite our focus on evaluating studies that closely aligned with the forthcoming implementation of menu-labeling regulations in the United States, none of the controlled studies conducted in restaurant settings evaluated the impact of menu calorie labeling with a daily anchor. Although the effect of the daily anchor statement was mixed in nonrestaurant studies, it is possible that the summary measure in restaurants with controls underestimates the effect of the regulations when implemented with a daily anchor statement. This review is also limited by its focus on studies directly relevant to the menu labeling regulations in the United States. In a recent review, Krieger and Saelens identified limited research on restaurant menu labeling outside the United States, but noted increasing interest internationally that should be addressed in future reviews.12
Conclusions
In contrast to studies conducted in nonrestaurant settings, we found that menu calorie labeling in fast-food, coffee shop, and other restaurant settings, similar to that included in national menu labeling regulations to be implemented in the United States, did not result in a significant reduction in calories purchased per meal. However, as adults consume one quarter of their daily energy intake from fast-food and full-service restaurants2 and this consumption is associated with reduced diet quality and excess weight gain, even small reductions in calories purchased within the confidence interval in this study could have a substantial benefit on the health of the overall population. Further evidence is needed to determine the role of a daily calorie anchor statement, the effects across different types of food establishments, and whether menu labeling in restaurant settings has an impact on compensation and total calories consumed across the day. Additional research on alternative menu labeling formats is particularly important to inform potential regulation in other countries that have yet to pass national menu labeling legislation. Surveillance of restaurant product reformulation, pricing, and promotions should continue as federal menu calorie labeling regulations are implemented.
Acknowledgments
This study was funded by the JPB Foundation as part of the Childhood Obesity Intervention Cost Effectiveness Study (CHOICES).
The authors would like to thank Andrea Pipito for her work managing the CHOICES evidence review process and the CHOICES stakeholder group for its feedback. The authors would also like to thank Carol Mita at the Harvard Countway Library for her assistance with the database search development.
Human Participant Protection
No protocol approval was needed for this study because it is a review of previously published research.
References
- 1.Poti JM, Popkin BM. Trends in energy intake among US children by eating location and food source, 1977–2006. J Am Diet Assoc. 2011;111(8):1156–1164. doi: 10.1016/j.jada.2011.05.007. [DOI] [PMC free article] [PubMed] [Google Scholar]
- 2.Powell LM, Nguyen BT, Han E. Energy intake from restaurants: demographics and socioeconomics, 2003–2008. Am J Prev Med. 2012;43(5):498–504. doi: 10.1016/j.amepre.2012.07.041. [DOI] [PMC free article] [PubMed] [Google Scholar]
- 3.Bowman SA, Gortmaker SL, Ebbeling CB, Pereira MA, Ludwig DS. Effects of fast-food consumption on energy intake and diet quality among children in a national household survey. Pediatrics. 2004;113(1 pt 1):112–118. doi: 10.1542/peds.113.1.112. [DOI] [PubMed] [Google Scholar]
- 4.Bowman SA, Vinyard BT. Fast food consumption of U.S. adults: impact on energy and nutrient intakes and overweight status. J Am Coll Nutr. 2004;23(2):163–168. doi: 10.1080/07315724.2004.10719357. [DOI] [PubMed] [Google Scholar]
- 5.Mesas AE, Munoz-Pareja M, Lopez-Garcia E, Rodriguez-Artalejo F. Selected eating behaviours and excess body weight: a systematic review. Obes Rev. 2012;13(2):106–135. doi: 10.1111/j.1467-789X.2011.00936.x. [DOI] [PubMed] [Google Scholar]
- 6.Institute of Medicine. Preventing Childhood Obesity: Health in the Balance. Washington, DC: The National Academies Press; 2005. [PubMed] [Google Scholar]
- 7.Institute of Medicine. Accelerating Progress in Obesity Prevention: Solving the Weight of the Nation. Washington, DC: The National Academies Press; 2012. [Google Scholar]
- 8.Pomeranz JL, Brownell KD. Legal and public health considerations affecting the success, reach, and impact of menu-labeling laws. Am J Public Health. 2008;98(9):1578–1583. doi: 10.2105/AJPH.2007.128488. [DOI] [PMC free article] [PubMed] [Google Scholar]
- 9.Roberto CA, Schwartz MB, Brownell KD. Rationale and evidence for menu-labeling legislation. Am J Prev Med. 2009;37(6):546–551. doi: 10.1016/j.amepre.2009.07.015. [DOI] [PubMed] [Google Scholar]
- 10. Food labeling: Nutrition labeling of standard menu items in restaurants and similar retail food establishments, final rule, 79 Federal Register 71155 (2014). [PubMed]
- 11.Harnack LJ, French SA. Effect of point-of-purchase calorie labeling on restaurant and cafeteria food choices: a review of the literature. Int J Behav Nutr Phys Act. 2008;5:51. doi: 10.1186/1479-5868-5-51. [DOI] [PMC free article] [PubMed] [Google Scholar]
- 12.Krieger J, Saelens BE. Impact of menu labeling on consumer behavior: a 2008–2012 update. Healthy Eating Research. 2013. Available at: http://www.rwjf.org/content/dam/farm/reports/reports/2013/rwjf406357. Accessed January 20, 2014.
- 13.Swartz JJ, Braxton D, Viera AJ. Calorie menu labeling on quick-service restaurant menus: an updated systematic review of the literature. Int J Behav Nutr Phys Act. 2011;8:135. doi: 10.1186/1479-5868-8-135. [DOI] [PMC free article] [PubMed] [Google Scholar]
- 14.Sinclair SE, Cooper M, Mansfield ED. The influence of menu labeling on calories selected or consumed: a systematic review and meta-analysis. J Acad Nutr Diet. 2014;114(9):1375–1388.e15. doi: 10.1016/j.jand.2014.05.014. [DOI] [PubMed] [Google Scholar]
- 15.Moher D, Liberati A, Tetzlaff J, Altman DG. Preferred reporting items for systematic reviews and meta-analyses: the PRISMA statement. PLoS Med. 2009;6(7) doi: 10.1371/journal.pmed.1000097. e1000097. [DOI] [PMC free article] [PubMed] [Google Scholar]
- 16.Harnack LJ, French SA, Oakes JM, Story MT, Jeffery RW, Rydell SA. Effects of calorie labeling and value size pricing on fast food meal choices: results from an experimental trial. Int J Behav Nutr Phys Act. 2008;5:63. doi: 10.1186/1479-5868-5-63. [DOI] [PMC free article] [PubMed] [Google Scholar]
- 17.Roberto CA, Larsen PD, Agnew H, Baik J, Brownell KD. Evaluating the impact of menu labeling on food choices and intake. Am J Public Health. 2010;100(2):312–318. doi: 10.2105/AJPH.2009.160226. [DOI] [PMC free article] [PubMed] [Google Scholar]
- 18.National Library of Medicine. PubMed. Available at: http://www.ncbi.nlm.nih.gov/pubmed. Accessed October 3, 2013. [DOI] [PubMed]
- 19. Thomson Reuters. Web of Science. Available at: http://thomsonreuters.com/products_services/science/science_products/a-z/web_of_science. Accessed October 3, 2013.
- 20. ProQuest LLC. PolicyFile. Available at: http://www.policyfile.com. Accessed October 3, 2013.
- 21. ProQuest LLC. PAIS International. Available at: http://www.proquest.com/products-services/pais-set-c.html. Accessed October 3, 2013.
- 22.Higgins JPT, Green S. Cochrane Handbook for Systematic Reviews of Interventions, v. 5.1.0. Oxford, UK: The Cochrane Collaboration; 2011. [Google Scholar]
- 23.Morley B, Scully M, Martin J, Niven P, Dixon H, Wakefield M. What types of nutrition menu labelling lead consumers to select less energy-dense fast food? An experimental study. Appetite. 2013;67:8–15. doi: 10.1016/j.appet.2013.03.003. [DOI] [PubMed] [Google Scholar]
- 24.Ellison B, Lusk JL, Davis D. Looking at the label and beyond: the effects of calorie labels, health consciousness, and demographics on caloric intake in restaurants. Int J Behav Nutr Phys Act. 2013;10:21. doi: 10.1186/1479-5868-10-21. [DOI] [PMC free article] [PubMed] [Google Scholar]
- 25.Roseman MG, Mathe-Soulek K, Higgins JA. Relationships among grocery nutrition label users and consumers’ attitudes and behavior toward restaurant menu labeling. Appetite. 2013;71:274–278. doi: 10.1016/j.appet.2013.08.019. [DOI] [PubMed] [Google Scholar]
- 26.Downs JS, Wisdom J, Wansink B, Loewenstein G. Supplementing menu labeling with calorie recommendations to test for facilitation effects. Am J Public Health. 2013;103(9):1604–1609. doi: 10.2105/AJPH.2013.301218. [DOI] [PMC free article] [PubMed] [Google Scholar]
- 27.Wisdom J, Downs JS, Loewenstein G. Promoting healthy choices: information vs. convenience. Am Econ J Appl Econ. 2010;2:164–178. [Google Scholar]
- 28.Elbel B, Gyamfi J, Kersh R. Child and adolescent fast-food choice and the influence of calorie labeling: a natural experiment. Int J Obes (Lond) 2011;35(4):493–500. doi: 10.1038/ijo.2011.4. [DOI] [PMC free article] [PubMed] [Google Scholar]
- 29.Finkelstein EA, Strombotne KL, Chan NL, Krieger J. Mandatory menu labeling in one fast-food chain in King County, Washington. Am J Prev Med. 2011;40(2):122–127. doi: 10.1016/j.amepre.2010.10.019. [DOI] [PubMed] [Google Scholar]
- 30.Krieger JW, Chan NL, Saelens BE, Ta ML, Solet D, Fleming DW. Menu labeling regulations and calories purchased at chain restaurants. Am J Prev Med. 2013;44(6):595–604. doi: 10.1016/j.amepre.2013.01.031. [DOI] [PubMed] [Google Scholar]
- 31.Higgins JP, Thompson SG, Deeks JJ, Altman DG. Measuring inconsistency in meta-analyses. BMJ. 2003;327(7414):557–560. doi: 10.1136/bmj.327.7414.557. [DOI] [PMC free article] [PubMed] [Google Scholar]
- 32.Shadish WR, Cook TD, Campbell DT. Experimental and Quasi-experimental Designs for Generalized Causal Inference. Boston, MA: Houghton Mifflin Co;; 2002. [Google Scholar]
- 33.Begg CB, Mazumdar M. Operating characteristics of a rank correlation test for publication bias. Biometrics. 1994;50(4):1088–1101. [PubMed] [Google Scholar]
- 34.Burton S, Creyer EH, Kees J, Huggins K. Attacking the obesity epidemic: the potential health benefits of providing nutrition information in restaurants. Am J Public Health. 2006;96(9):1669–1675. doi: 10.2105/AJPH.2004.054973. [DOI] [PMC free article] [PubMed] [Google Scholar]
- 35.Sproul AD, Canter DD, Schmidt JB. Does point-of-purchase nutrition labeling influence meal selections? A test in an Army cafeteria. Mil Med. 2003;168(7):556–560. [PubMed] [Google Scholar]
- 36.Vadiveloo MK, Dixon LB, Elbel B. Consumer purchasing patterns in response to calorie labeling legislation in New York City. Int J Behav Nutr Phys Act. 2011;8:51. doi: 10.1186/1479-5868-8-51. [DOI] [PMC free article] [PubMed] [Google Scholar]
- 37.Aaron JI, Evans RE, Mela DJ. Paradoxical effect of a nutrition labeling scheme in a student cafeteria. Nutr Res. 1995;15:1251–1261. [Google Scholar]
- 38.Holmes AS, Serrano EL, Machin JE, Duetsch T, Davis GC. Effect of different children’s menu labeling designs on family purchases. Appetite. 2013;62:198–202. doi: 10.1016/j.appet.2012.05.029. [DOI] [PubMed] [Google Scholar]
- 39.Chu YH, Frongillo EA, Jones SJ, Kaye GL. Improving patrons’ meal selections through the use of point-of-selection nutrition labels. Am J Public Health. 2009;99(11):2001–2005. doi: 10.2105/AJPH.2008.153205. [DOI] [PMC free article] [PubMed] [Google Scholar]
- 40.Pulos E, Leng K. Evaluation of a voluntary menu-labeling program in full-service restaurants. Am J Public Health. 2010;100(6):1035–1039. doi: 10.2105/AJPH.2009.174839. [DOI] [PMC free article] [PubMed] [Google Scholar]
- 41.Stutts MA, Zank GM, Smith KH, William SA. Nutrition information and children’s fast food menu choices. J Consum Aff. 2012;45(1):52–86. [Google Scholar]
- 42.Yamamoto JA, Yamamoto JB, Yamamoto BE, Yamamoto LG. Adolescent fast food and restaurant ordering behavior with and without calorie and fat content menu information. J Adolesc Health. 2005;37(5):397–402. doi: 10.1016/j.jadohealth.2004.10.002. [DOI] [PubMed] [Google Scholar]
- 43.Temple JL, Johnson KM, Archer K, Lacarte A, Yi C, Epstein LH. Influence of simplified nutrition labeling and taxation on laboratory energy intake in adults. Appetite. 2011;57(1):184–192. doi: 10.1016/j.appet.2011.04.018. [DOI] [PubMed] [Google Scholar]
- 44.Temple JL, Johnson K, Recupero K, Suders H. Nutrition labels decrease energy intake in adults consuming lunch in the laboratory. J Am Diet Assoc. 2010;110(7):1094–1097. doi: 10.1016/j.jada.2010.04.006. [DOI] [PubMed] [Google Scholar]
- 45.Hoefkens C, Pieniak Z, Van Camp J, Verbeke W. Explaining the effects of a point-of-purchase nutrition-information intervention in university canteens: a structural equation modelling analysis. Int J Behav Nutr Phys Act. 2012;9:111. doi: 10.1186/1479-5868-9-111. [DOI] [PMC free article] [PubMed] [Google Scholar]
- 46.Pang J, Hammond D. Efficacy and consumer preferences for different approaches to calorie labeling on menus. J Nutr Educ Behav. 2013;45(6):669–675. doi: 10.1016/j.jneb.2013.06.005. [DOI] [PubMed] [Google Scholar]
- 47.Milich R, Anderson J, Mills M. Effects of visual presentation of caloric values on food buying by normal and obese persons. Percept Mot Skills. 1976;42(1):155–162. doi: 10.2466/pms.1976.42.1.155. [DOI] [PubMed] [Google Scholar]
- 48.Giesen JC, Payne CR, Havermans RC, Jansen A. Exploring how calorie information and taxes on high-calorie foods influence lunch decisions. Am J Clin Nutr. 2011;93(4):689–694. doi: 10.3945/ajcn.110.008193. [DOI] [PubMed] [Google Scholar]
- 49.Vanderlee L, Hammond D. Does nutrition information on menus impact food choice? Comparisons across two hospital cafeterias. Public Health Nutr. 2014;17(6):1393–1402. doi: 10.1017/S136898001300164X. [DOI] [PMC free article] [PubMed] [Google Scholar]
- 50.Bollinger B, Leslie P, Sorensen A. Calorie posting in chain restaurants. Am Econ J. 2011;3:91–128. [Google Scholar]
- 51.Dumanovsky T, Huang CY, Nonas CA, Matte TD, Bassett MT, Silver LD. Changes in energy content of lunchtime purchases from fast food restaurants after introduction of calorie labelling: cross sectional customer surveys. BMJ. 2011;343 doi: 10.1136/bmj.d4464. d4464. [DOI] [PMC free article] [PubMed] [Google Scholar]
- 52.Elbel B, Kersh R, Brescoll VL, Dixon LB. Calorie labeling and food choices: a first look at the effects on low-income people in New York City. Health Aff (Millwood) 2009;28(6):w1110–w1121. doi: 10.1377/hlthaff.28.6.w1110. [DOI] [PubMed] [Google Scholar]
- 53.Tandon PS, Zhou C, Chan NL et al. The impact of menu labeling on fast-food purchases for children and parents. Am J Prev Med. 2011;41(4):434–438. doi: 10.1016/j.amepre.2011.06.033. [DOI] [PMC free article] [PubMed] [Google Scholar]
- 54.Dowray S, Swartz JJ, Braxton D, Viera AJ. Potential effect of physical activity based menu labels on the calorie content of selected fast food meals. Appetite. 2013;62:173–181. doi: 10.1016/j.appet.2012.11.013. [DOI] [PubMed] [Google Scholar]
- 55.Liu PJ, Roberto CA, Liu LJ, Brownell KD. A test of different menu labeling presentations. Appetite. 2012;59(3):770–777. doi: 10.1016/j.appet.2012.08.011. [DOI] [PubMed] [Google Scholar]
- 56.Wei W, Miao L. Effects of calorie information disclosure on consumers’ food choices at restaurants. Int J Hospit Manag. 2013;33:106–117. [Google Scholar]
- 57.Gerend MA. Does calorie information promote lower calorie fast food choices among college students? J Adolesc Health. 2009;44(1):84–86. doi: 10.1016/j.jadohealth.2008.06.014. [DOI] [PubMed] [Google Scholar]
- 58.Tandon PS, Wright J, Zhou C, Rogers CB, Christakis DA. Nutrition menu labeling may lead to lower-calorie restaurant meal choices for children. Pediatrics. 2010;125(2):244–248. doi: 10.1542/peds.2009-1117. [DOI] [PubMed] [Google Scholar]
- 59.Allison P. Fixed Effects Regression Methods for Longitudinal Data Using SAS. Cary, NC: SAS Institute Inc; 2005. [Google Scholar]
- 60.Bruemmer B, Krieger J, Saelens BE, Chan N. Energy, saturated fat, and sodium were lower in entrees at chain restaurants at 18 months compared with 6 months following the implementation of mandatory menu labeling regulation in King County, Washington. J Acad Nutr Diet. 2012;112(8):1169–1176. doi: 10.1016/j.jand.2012.04.019. [DOI] [PubMed] [Google Scholar]