Abstract
Changes in adipose tissue mass must be accompanied by parallel changes in microcirculation. Investigating the mechanisms that regulate adipose tissue angiogenesis could lead to better understanding of adipose tissue function and reveal new potential therapeutic strategies. Angiogenesis is defined as the formation of new capillaries from existing microvessels. This process can be recapitulated in vitro, by incubation of tissue in extracellular matrix components in the presence of pro-angiogenic factors. Here, we describe a method to study angiogenesis from adipose tissue fragments obtained from mouse and human tissue. This assay can be used to define effects of diverse factors added in vitro, as well as the role of endogenously produced factors on angiogenesis. We also describe approaches to quantify angiogenic potential for the purpose of enabling comparisons between subjects, thus providing information on the role of physiological conditions of the donor on adipose tissue angiogenic potential.
1. INTRODUCTION
The adipose tissue of mammals has evolved as a preferred storage site for excess calories in the form of triacylglycerol, and also as a critically important endocrine organ, which controls whole body metabolic homeostasis. One of the unique features of adipose tissue is its ability to massively expand in response to chronic positive energy balance, and to decrease in size under conditions in which stored calories are mobilized for use in other organs. Adipose tissue expansion results from an increase in adipocyte size, as well as from the differentiation of precursors into new adipocytes. As is the case for any tissue, changes in adipose tissue mass must be accompanied by parallel changes in microcirculation (Cho et al., 2007; Christiaens & Lijnen, 2010; Crandall, Hausman, & Kral, 1997). Adequate vascularization is required to deliver nutrients and oxygen to all cells in the tissue, to remove waste products, and to allow the tissue to functionally interact with the rest of the organism through the sensing and production of hormones and growth factors. In the case of adipose tissue, inadequate microcirculation could impair appropriate triglyceride storage by preventing access to circulating lipoproteins under fed conditions; it could also prevent adequate fuel delivery to other organs during fasting. Recent data suggest that adipose tissue microcirculatory alterations occur in type 2 diabetes, raising the possibility that impaired vascular development may be pathogenic in this disease (Hodson, Humphreys, Karpe, & Frayn, 2012; Hosogai et al., 2007; Michailidou et al., 2012; Pasarica et al., 2009; Rausch, Weisberg, Vardhana, & Tortoriello, 2008). In support of an important role for adipose tissue angiogenesis, increased production of pro-angiogenic factors, in particular VEGF, by adipose tissue improves whole body metabolism in high-fat diet-fed mice (Michailidou et al., 2012; Sung et al., 2013; Wree et al., 2012). Thus, investigating the mechanisms that regulate adipose tissue angiogenesis could lead to better understanding of adipose tissue function and potentially reveal new therapeutic strategies.
Research on complex processes, such as tissue vascularization, can benefit from in vitro models that mimic important features of the process. In the area of angiogenesis, significant information has been derived from the aorta ring assay, in which aortic rings dissected from rat or mouse thoracic aortas generate outgrowths of branching microvessels (Aplin, Fogel, Zorzi, & Nicosia, 2008; Baker et al., 2012). The formation of sprouts can be visualized by light microscopy of live cultures, and branching microvessels are composed of the same cell types that operate in vivo. The formation of aortic ring sprouts is regulated by endogenous and exogenously added pro- and anti-angiogenic factors. Thus, this assay has been extremely valuable in dissecting the basic mechanisms of angiogenesis.
Here we present an adaptation of the aorta ring assay, which we have used to assess the angiogenic capacity of adipose tissue from mice and humans (Gealekman et al., 2008, 2012, 2011). We have found that angiogenic capacity of adipose tissue in vitro reflects the physiological conditions of the donor. For example, adipose tissue angiogenesis, but not that of aorta, is enhanced in ob/ob hyperphagic mice, and in response to stimuli that increase adipose tissue growth, such as thiazolidinediones (Gealekman et al., 2008). Angiogenic capacity also differs among human adipose tissue depots and correlates with insulin sensitivity (Gealekman et al., 2011). Thus this assay can be used to dissect endogenous factors that regulate adipose tissue angiogenesis under different physiological conditions.
2. MATERIALS
2.1. Medium, instruments, and culture dishes
Matrigel™ Basement Membrane Matrix, Growth Factor Reduced, Phenol Red-free, *LDEV-Free (BD Biosciences, San Jose, CA, catalog # 356231). Matrigel comes in bottles of 10 ml. To avoid freeze–thaw cycles and contamination, it is dispensed into 1 ml aliquots and stored at −20 °C
EBM-2 medium supplemented with EGM-2 MV (Lonza, Basel, Switzerland, BulletKit, CC-3202)
Dulbecco’s phosphate-buffered saline (DPBS) (Life Technologies Corp-Gibco®, Carlsbad, CA, catalog # 14190)
Dispase (BD Biosciences, San Jose, CA, catalog # 354235) enzyme is used for proteolysis of Matrigel. Aliquot dispase in 1.5 ml tubes and store at −20 °C. Try to avoid multiple freeze–thaw cycle
50 mM EDTA
Trypsin-Versene (Lonza, Basel, Switzerland, catalog # 17-161E)
Formaldehyde (Ted Pella, Inc., Redding, CA, catalog #18505)
Hoechst 33258, pentahydrate (Life Technologies Corp, Carlsbad, CA, catalog # 947743)
Triton X-100 (Sigma-Aldrich, St. Louis, MO, catalog # T-9284)
BSA (Sigma-Aldrich, St. Louis, MO, catalog # A3059)
-
96-well flat bottom multiwell plates (BD Falcon™, Franklin Lakes, NJ, catalog # 353072)
35 mm glass-bottom culture dishes (MatTek Corporation, Ashland, MA, catalog # P35G-1.5-14-C)
Very fine point forceps (VWR International, Radnor, PA, catalog # 25607-856)
Micro Surgery Scissors (Integra™-Miltex®, York, PA, catalog # 17-2150)
Sterile pipettes, tips, and conical tubes
Three 100 mm×20 mm petri dishes
Round bladed disposable scalpels (FEATHER® Safety Razor Co. Ltd, Osaka, Japan, catalog # 2975#10)
2.2. Adipose tissue samples
Sample collection of adipose tissue from mice or human subjects requires IACUC and IRB approval from the institution at which the procedure will be performed.
In preliminary studies, only the epididymal adipose depot of mice was competent to form angiogenic sprouts in vitro, for reasons that are currently under investigation. Thus, all of our studies have been carried out with male mice on a C56BL/6 background, or on genetic variants such as the ob/ob mouse. For this assay, epididymal adipose tissue is dissected and processed for embedding as described in detail below.
This assay has also been used to measure angiogenesis from human adipose tissue. Explants from both subcutaneous and visceral adipose tissue depots develop capillary sprouts (Gealekman et al., 2011). However, differences in the extent of angiogenic growth have been seen between visceral and subcutaneous adipose tissue. Thus, the exact source of each adipose tissue sample (including morphometric and metabolic characteristics of human subjects and the exact location from which the adipose tissue sample is extracted) should be carefully tracked and kept as consistent as possible between subjects within a study. An additional factor that may affect the outcome of this assay is the time between the excision of adipose tissue from the patient and the embedding of the tissue pieces into Matrigel. Both the conditions in which adipose tissue samples are stored and the time between excision and embedding should be optimized and, at very least, kept consistent between the subjects being compared. For optimal results we recommend collecting adipose tissue pieces that do not exceed 1 g, and storing them at room temperature in EGM-2 MV-supplemented EBM-2 medium. The time between excision of the adipose tissue from human subject and its embedding into Matrigel should be minimized, and in our laboratory is routinely under 3 h.
3. METHODS
3.1. Sample preparation
Before starting
Protocol should be performed in a Class II Biocabinet.
Wear personal protective garment including the use of lab coat, double gloves, facial barrier protection, hair net, etc. Follow Human Tissue Handling Guidelines from your institution.
Instruments for handling tissue should be previously sterilized.
Remove aliquots of Matrigel from −20 °C and place on ice to bring it to 4 °C. Use 2.5 ml of Matrigel for 60 wells of a 96-well-multiwell plate.
3.1.1 Collection of mouse adipose tissue
Male C57Bl/6 mice from 9 to 23 weeks of age, fed either normal chow or high-fat diet.
Mice are sacrificed according to institutional protocols.
Epididymal fat pads are harvested by dissection using iris scissors according to the proximity to the epididymis and vesicular gland, taking care not to include the internal spermatic artery/vein and caput epididymis.
After harvesting, adipose tissue is placed into 50 ml conical tubes containing 25 ml of EGM-2 MV-supplemented EBM-2 medium in which it is stored until embedding.
3.1.2 Collection of human adipose tissue
Tissue is obtained following IRB protocols. In our studies, human adipose tissue has been obtained from needle biopsies, bariatric surgery, or panniculectomy procedures.
Tissue is cut into ~1 g fragments, from which large vessels and obvious connective tissue are removed using iris scissors.
After harvesting, adipose tissue is placed into 50 ml conical tubes containing 25 ml of EGM-2 MV-supplemented EBM-2 medium in which it is stored until embedding.
3.2. Embedding procedure
Label 3 100 cm petri dishes as #1, 2, and 3.
Pipette 25 ml of EGM-2MV-supplemented EBM-2 medium in plate #1 and #3. Put 15 ml of medium in plate #2.
Using forceps, transfer tissue from 50 ml conical tube into plate #1 and wash it by gently moving it around the plate.
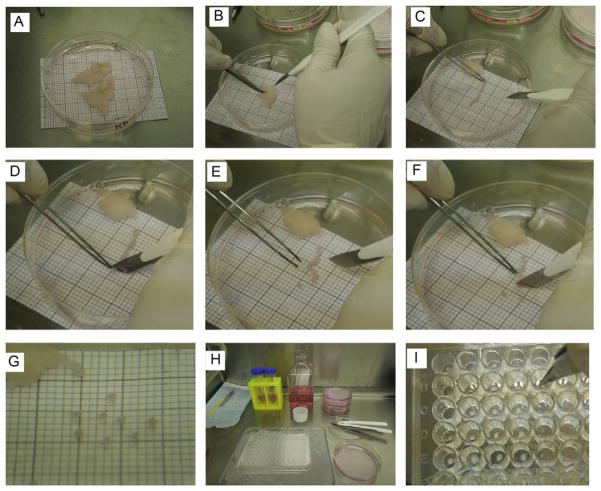
Using forceps and scalpel, cut the tissue into strips (Fig. 5.1). Use the forceps to hold the piece and the scalpel to make the cuts, always moving in one direction (no upward or downward movement). Rinse the strip with a gentle mix in the medium on the plate. Move the tissue strips to plate #2.
In plate #2, cut the strips into small slices. Maintain the size of pieces constant. As a guide for size, you can place millimeter paper underneath plate #2. Each piece should not be greater than 1 mm3. Once cut, move the piece to plate #3. Cut approximately 75–80 slices per tissue sample.
Obtain a small tray and fill with ice. Put 96-well plate over ice. Maintain the plate in ice during the following steps.
Dispense 40 μl of Matrigel into wells to be used. Do not use the wells around the perimeter of the plate. Keep Matrigel on ice at all times.
Using the forceps, place one piece of adipose tissue per well.
After embedding, take plate out of ice. Make sure each explant is in the middle of the well. Use forceps if accommodation is needed.
Incubate at 37 °C in 5% CO2 for 30 min.
Add 200 μl of EGM-2 MV-supplemented EBM-2 medium per well. Make sure to fill all well in the plate, including the well around the perimeter of the plate, which do not contain adipose tissue explants. Wells at the perimeter of the plate tend to evaporate faster and placing explants only in the wells located in the middle of the plate allows for maintenance of a constant level of medium in all wells containing the explants.
Incubate at 37 °C in 5% CO2. 100 μl of the medium should be replaced every other day.
Figure 5.1.
Embedding procedure. (A) Adipose tissue samples placed in a 100 cm petri dish containing 25 ml of EGM-2 MV medium. The millimeter (mm) paper placed under the petri dish is used as a size reference. (B) Sample of adipose tissue in plate #2 containing 15 ml of EGM-2 MV medium. The scalpel and forceps are used to hold the fat and cut it into strips. (C) Piece of fat strip cut from the adipose tissue sample. Using the millimeter paper reference, the fat strip is aligned in order to cut the appropriate size of each slice (explant). (D) For the first cut, it is easier to start at one of the ends of the adipose tissue strip. The forceps are used to hold the fat while the scalpel is used to cut the slice. (E) The explant is aligned with one of the quadrants in the millimeter paper to verify adequate size. (F) The rest of the strip is cut into slices. The adipose tissue is held by forceps and the cut is done by the scalpel. While handling the forceps, avoid pulling or stretching the fat, since it may damage the tissue. (G) Individual slices cut to appropriate size and verified with the millimeter paper. (H). Display of workstation in the biocabinet before starting the embedding procedure. Explants were transferred to plate #3, containing 25 ml of EGM-2 MV medium. 96-multiwell plate is kept in a tray filled with ice for the embedding steps. (I) Embedding step. After the Matrigel is dispensed, forceps are used to place the explants, one per well. The explant is positioned at the center of the well.
3.3. Quantification of angiogenic potential
The mount of capillary growth can be evaluated using several approaches. Here we describe three independent strategies to quantify angiogenic potential, which we have successfully applied to both mouse and human samples. We recommend using at least two independent methods so correlation analysis can be performed to validate reproducibility of the data obtained.
3.3.1 Counting of capillary sprouts
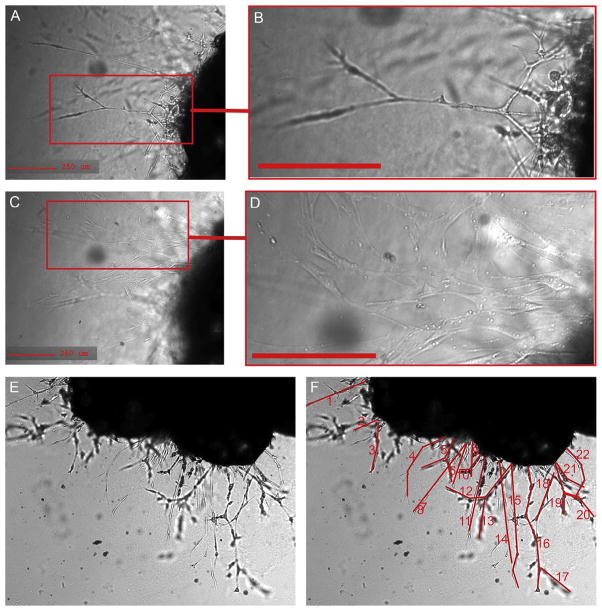
A capillary sprout is defined as a branching structure of at least three cells connected to each other in a linear manner (Fig. 5.2A and B). This structure is qualitatively different from other cell types that can also emerge from the explant, but which grow in a disorganized manner and typically adhere to the surface of the plate (Fig. 5.2C and D). To detect capillary sprouts, imaging under sufficient magnification under phase contrast is required. In our laboratory we use a Zeiss Axiovert equipped with a 10× objective. Phase contrast images of embedded explants and emerging capillary sprouts from mouse adipose tissue at day 14 are shown in Fig. 5.2E, and in Fig. 5.2F, the structures that would be considered to be sprouts are delineated in red. As new sprouts emerge they become interconnected and grow into the three-dimensional volume of the Matrigel; thus, counting should be performed early during the growth period. Sprouts begin to emerge after 4–5 days post-embedding of mouse epididymal fat explants, and we quantify the number of sprouts per explant at day 7 and day 14 postembedding. Because the definition of a sprout is somewhat subjective, it is necessary to have more than one individual perform the counting, and that the individuals performing the counting be blinded as to the experimental condition of the sample.
Figure 5.2.
Cells emerging from mouse adipose tissue explant. (A, B) Capillary sprout emerging from embedded mouse explant, displaying characteristic linear branching structure. (C, D) Focus set to the surface of the well, where fibroblastic adherent cells can be seen emerging from the explant, observed at a different optical plane of the image. (E) Phase contrast image of the explant and the capillary sprouts 14 days post-embedding. (F) Structures shown in red highlight formations that can be considered to be sprouts.
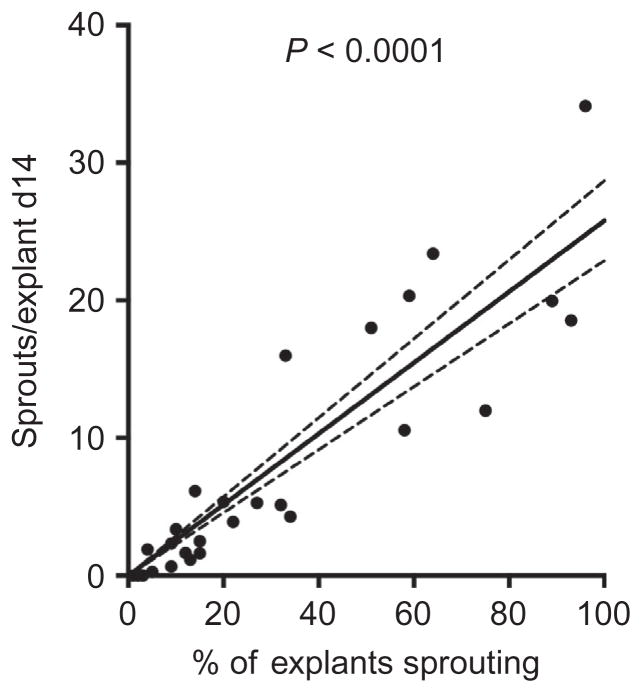
Because of the variability in the number of sprouts emerging from each explant, at least 25 explants must be analyzed for each experimental condition. The results are expressed as the average number of sprouts per explant. When studying mouse epididymal fat, there is a linear correlation between the number of explants that develop sprouts and the average number of sprouts per explant (Fig. 5.3). Thus, the percent of explants that display sprouting is an alternative way to quantify angiogenic potential.
Figure 5.3.
Linear correlation between the number of explants sprouting and the quantity of sprouts per explant from mouse adipose tissue. Capillary sprouting was quantified in a study of 36 mice fed normal or high-fat diet for 3–30 weeks. 25–30 explants from each mouse were embedded. The percent of the embedded explants for each mouse displaying sprouts after 14 days of culture is plotted on the x-axis. The mean number of sprouts per explant (i.e., sum of sprouts in all explants/total number of explants embedded) is plotted on the ml axis. Linear regression was calculated using PRISM software.
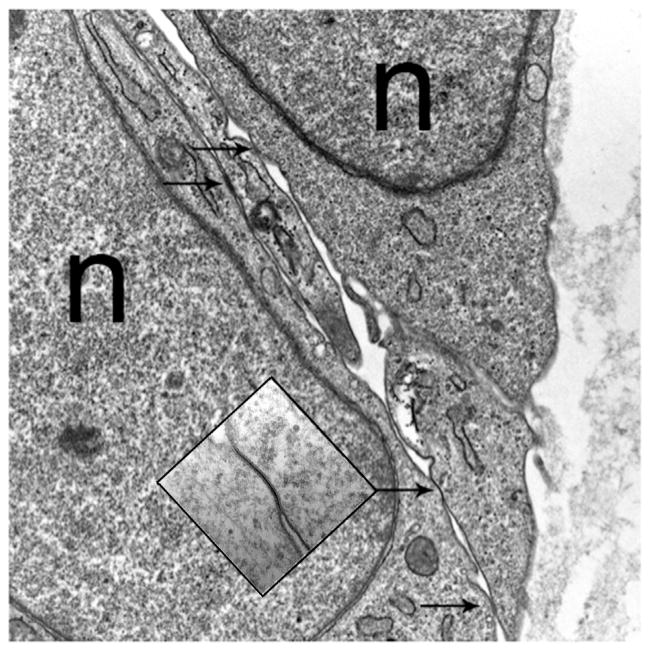
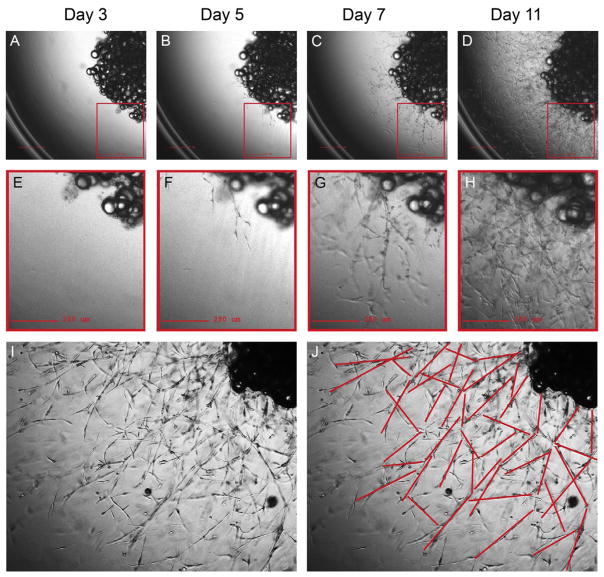
Counting can also be performed on human explants, which form well-defined capillaries with tight junctions defining primitive lumens (Fig. 5.4). Human explants develop many more sprouts compared to mouse (Fig. 5.5). After 11 days, the sprouts become highly branched and expand into the three-dimensional volume of the Matrigel, making counting more complex. Thus, counting of human sprouts is best done at days 5–7 postembedding.
Figure 5.4.
Electron micrograph of capillary sprouts from a human adipose tissue explant. Arrows identify tight junctions. n, nucleus.
Figure 5.5.
Capillary sprouting from human adipose tissue. A human explant from subcutaneous adipose tissue at days 3 (A, B), 5 (C, D), 7 (E, F), and 11 (G, H) post-embedding. Capillary sprouting begins to be observed at day 5. After day 11, the growth is highly increased (I, J), making difficult to identify all sprout formation.
3.3.2 Digital analysis of growth area
The capillary growth can be further analyzed by measuring the area of sprouting in each well. In our laboratory, we have used a Zeiss Axio Observer Z1 microscope equipped with an automated stage. Brightfield images of each well of a 96-well plate are acquired using a 2.5× objective and captured using an Andor Clara E interline CCD camera. The stage position, illumination and acquisition setting are controlled by Micro-manager open source microscopy software (Edelstein, Amodaj, Hoover, Vale, & Stuurman, 2010), using a multiwell plate plugin developed by Karl Bellve and Ben Czech (http://valelab.ucsf.edu/~MM/MMwiki/index.php/Well_Plate_Plugin). The plugin is designed to handle standard SBS well plates from 24, 96, 384, and 1536 wells. The plugin will calculate the correct X, Y, and Z coordinate for each well position, and for any number of positions within each well. Imaging can then iterate through each well, starting at the first well. The plugin will move the stage down or up each column, until the last row, before moving to the next column and reversing direction. The zigzag path chosen for moving the stage is the fastest path on a Zeiss AxioObserver Z1. The starting well, or the ending well, can be selected to only work on a subregion. For our experiments, each well of a 96-well plate containing an explant is divided into four quadrants, with a 50 CCD pixel overlap. Five optical sections spaced at 150 μm are collected for each quadrant, and a montage of the quadrants is then generated for further analysis.
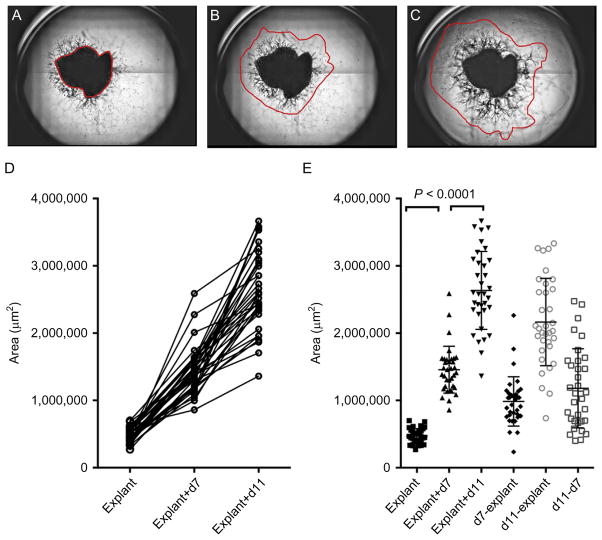
For further analysis, the composite image is imported into Fiji, an image processing package, which is a distribution of ImageJ, Java, Java 3D, and several plugins organized into a coherent menu structure (Schindelin et al., 2012). For calculation of the growth area, areas of explant and capillary sprout growth are delineated. Various parameters can then be extracted, including the area occupied by explant and sprouts (Fig. 5.6) as follows:
Figure 5.6.
Digital analysis of capillary growth area. An example of montages generated from bright field images of quadrants of a single well from a 96-well-multiwell plate containing an explant from human omental adipose tissue. The region of the explant (A), and of capillary growth at day 7 (B), and day 11 (C) postembedding is delineated. The areas are calculated for the selected regions highlighted in red. (D) Calculated areas of 34 explants from the same tissue sample growing in the same 96-well-multiwell plotted in a before–after format, revealing linear growth in all embedded explants over the culture period. (E) Scatter plot displaying the means and standard deviation of the values obtained for each explant at each time point, and values obtained after subtracting the area of the initial explant. Paired Student’s t-test between time points reveals highly significant differences, which can be used to compare angiogenic potential among different donors.
To measure areas in the image files:
Open Fiji
Open image to be analyzed
Visually examine in which plane the explant is more in focus. Use it for selecting the area of the explant
In the tools menu, select “Freehand selections”
-
Select the area of the explant:
Highlight the borders of the explant with the cursor, keeping pressed the left button on the mouse. If the button is released, the area selected will be automatically closed
Edit>Selection>Add to Manager. Automatically, the selected area is added to ROI Manager. Keep the ROI Manager window open. ROI will allow you to select the area of growth in the same image and measure a series of parameters, including the area measurements
Go back to the image and select the area of growth. Make sure to examine every plane. You can move around each plane while making the selection, so all the growth is included
After selecting the area of growth, press “Add (t)” in the ROI Manager window
-
In the ROI Manager window, select both areas
“Shift”+”↓” if needed
-
Press “Measure” in the ROI Manager window. A “Results” window will appear. It contains different kinds of measurements, including area of the explant and growth
Item #1 is the area of the explant
Item #2 is the area of the growth
It is very important to maintain the order of measurements. First the explant, then the area of growth.
-
In the Results window, go to File>Save as
Suggestion: Save results file with the well name (A2, B2, etc.) and a short identification of the sample. Keep consistency in naming, in case a program is developed to help in analysis. (Examples: A2_Control_Day7.txt, B7_Sample1_Day7.txt)
-
In the ROI Manager window, select “More≫,” Save
Save ROI file as a .zip. This will allow you to save both explant and growth area as .roi files. Suggestion: Name the .zip file with the well name (A2, B2, etc.) and a short identification of the sample. Keep consistency in naming, in case a program is developed to help in analysis. (Examples: A2_Control_Day7.zip, B7_Sample1_Day7. zip)
-
To open image files that were already measured
Open Fiji
Open desired image
File>Open>Select file>Open “.zip” file
-
In the ROI Manager window, select both areas
“Shift”+”↓” if needed
Mark “Show All”
Both selected areas should appear in the active image
3.3.3 Immunofluorescence analysis of explants
Adipose tissue explants can also be analyzed by immunofluorescence, with the exception that embedding must be done on coverslips or glass-bottom culture dishes. In our laboratory we have used 35 mm glass-bottom culture dishes (MatTek Corporation). The use of glass-bottom culture dishes allows for examination of stained samples at higher magnifications. The protocol used for visualizing human Von Willebrand factor is as follows:
Dispense 100 μl of Matrigel to cover the bottom of each dish, and embed explants and maintain in culture as described above.
On the desired day, wash samples three times in DPBS by gently aspirating medium from the side of the dish and using 3 ml of DPBS for each wash.
Prepare fresh 4% formaldehyde solution by diluting the supplied 16% solution in DPBS at 1:3 ratio. Make sure to use chemical hood with proper ventilation at all times while handling formaldehyde.
Inside of chemical hood, gently aspirate DPBS from the dishes with samples and add 1 ml of freshly prepared 4% formaldehyde solution into each dish. Incubate for 15 min at room temperature with very gentle shaking.
Gently remove 4% formaldehyde from the dish and wash again three times in DPBS, gently shaking for 5 min in each wash step.
Prepare permeabilizing solution by supplementing DPBS with 0.5% Triton X-100 and 1% BSA.
Permeabilize and block nonspecific antibody attachment by incubating in 0.5% Triton X-100 1% BSA in DPBS for 60 min with gentle shaking. Use 2 ml of the solution per each well.
Remove solution and replace with primary antibody, in this case anti-human polyclonal rabbit Von Willebrand factor (Dako, catalog # A0082), diluted 1:100 in permeabilizing solution. Use at least 1 ml of antibody solution for each dish. Incubate overnight at 5 °C with gentle shaking.
Remove primary antibody, and wash three times with DPBS, gently shaking for 5 min between each wash step.
Incubate for 1 h with secondary antibodies diluted in permeabilizing solution. The secondary antibody we have used is Alexa Fluor 488 (Invitrogen; Molecular probes, catalog # 11008, dilution 1:500).
Wash three times with DPBS, gently shaking for 5 min between each wash step.
Perform nuclear counter staining by incubating for 5 min with Hoechst 33258, pentahydrate diluted 1:5000 in DPBS.
Wash in DPBS three times.
3.3.4 Isolated cell analysis
After completing manual counting and digital assessments of capillary growth, cells comprising capillary sprouts can be harvested from the Matrigel for further analysis by western blotting, FACS, etc. To quantitatively recover the cells from each well, the following procedure is used:
Before starting
Dispase is used for proteolysis of Matrigel. Dispase should be aliquoted in 1.5 ml volume vials and stored at −20 °C. Avoid multiple freeze–thaw cycles. Before use, dispase is thawed at 37 °C.
Most of the capillary cells grow in Matrigel, but some cells (e.g., fibro-blasts) attach to the bottom of the plate. Trypsin-Versene is used for detaching cells that remain adherent to the well after the dispase treatment.
-
Materials and tools used, including jeweler’s forceps and scissors, should be sterile.
Carefully, remove the medium by aspirating it from the wells. Be careful not to aspirate Matrigel or explants.
-
Rinse twice with 200 μl of sterile DPBS. Discard DPBS.
Caution: In case of human tissue, discard medium and DPBS according to your institution’s safety regulations.
Add 50 μl of dispase to each well. Incubate at 37 °C for 1.5–2 h. Make sure that all cells are detached and floating in the digested Matrigel by looking under the microscope after incubation.
Prepare a 1:1 mixture of Trypsin-Versene and 50 mM EDTA.
Add 50 μl of the Trypsin-Versene/EDTA mixture to each well to stop dispase digestion and dislodge adherent cells. Gently mix by pipetting up and down. Incubate at 37 °C for 10 min.
Use forceps to remove remaining explant from wells. Discard the explants in biomedical waste.
Add 50 μl of DPBS to each well. Mix by pipetting up and down.
Transfer the cell suspension from all wells to a 15 ml conical tube. Fill with EGM-2 MV-supplemented EBM-2 medium to achieve a final volume of 10 ml.
Centrifuge the tube containing the cells at 200×g for 10 min at room temperature.
Make sure the cells are pelleted down. Aspirate the supernatant and resuspend the pellet in 1 ml of fresh EGM-2 MV-supplemented EBM-2 medium.
Obtain cell concentration and viability. For this purpose, the Cellometer Auto T4 Cell Counter and Software was used (Nexcelom Bioscience).
Resuspend cells for further use.
4. METHOD LIMITATIONS
There is significant variation between each individual explant, so quantitative analysis requires at least 25 explants per condition.
The capillary sprouts are defined by morphological criteria, so changes in the cellular composition, cell shape or cell motility could affect the result.
The Matrigel is relatively impermeable and thus penetration by large molecules such as nucleic acids, or viruses that could be used to interrogate the properties of the growing cells is difficult.
Immunostaining is complicated by nonspecific attachment of antibodies to Matrigel, and therefore successful results depend on the availability of high affinity antibodies and molecules expressed at relatively high levels.
Acknowledgments
This work was funded by the National Institutes of Health Grant DK089101 to S. C.
References
- Aplin AC, Fogel E, Zorzi P, Nicosia RF. The aortic ring model of angiogenesis. Methods in Enzymology. 2008;443:119–136. doi: 10.1016/S0076-6879(08)02007-7. [DOI] [PubMed] [Google Scholar]
- Baker M, Robinson SD, Lechertier T, Barber PR, Tavora B, D’Amico G, et al. Use of the mouse aortic ring assay to study angiogenesis. Nature Protocols. 2012;7:89–104. doi: 10.1038/nprot.2011.435. [DOI] [PubMed] [Google Scholar]
- Cho CH, Koh YJ, Han J, Sung HK, Jong Lee H, Morisada T, et al. Angiogenic role of LYVE-1-positive macrophages in adipose tissue. Circulation Research. 2007;100:e47–e57. doi: 10.1161/01.RES.0000259564.92792.93. [DOI] [PubMed] [Google Scholar]
- Christiaens V, Lijnen HR. Angiogenesis and development of adipose tissue. Molecular and Cellular Endocrinology. 2010;318:2–9. doi: 10.1016/j.mce.2009.08.006. [DOI] [PubMed] [Google Scholar]
- Crandall DL, Hausman GJ, Kral JG. A review of the of adipose tissue: Anatomic, metabolic, and angiogenic perspectives. Microcirculation. 1997;4:211–232. doi: 10.3109/10739689709146786. [DOI] [PubMed] [Google Scholar]
- Edelstein A, Amodaj N, Hoover K, Vale R, Stuurman N. Computer control of microscopes using microManager. Current Protocols in Molecular Biology. 2010;Chapter 14(Unit14):20. doi: 10.1002/0471142727.mb1420s92. [DOI] [PMC free article] [PubMed] [Google Scholar]
- Gealekman O, Burkart A, Chouinard M, Nicoloro SM, Straubhaar J, Corvera S. Enhanced angiogenesis in obesity and in response to PPARgamma activators through adipocyte VEGF and ANGPTL4 production. American Journal of Physiology Endocrinology and Metabolism. 2008;295:E1056–E1064. doi: 10.1152/ajpendo.90345.2008. [DOI] [PMC free article] [PubMed] [Google Scholar]
- Gealekman O, Guseva N, Gurav K, Gusev A, Hartigan C, Thompson M, et al. Effect of rosiglitazone on capillary density and angiogenesis in adipose tissue of normoglycaemic humans in a randomised controlled trial. Diabetologia. 2012;55:2794–2799. doi: 10.1007/s00125-012-2658-2. [DOI] [PMC free article] [PubMed] [Google Scholar]
- Gealekman O, Guseva N, Hartigan C, Apotheker S, Gorgoglione M, Gurav K, et al. Depot-specific differences and insufficient subcutaneous adipose tissue angiogenesis in human obesity. Circulation. 2011;123:186–194. doi: 10.1161/CIRCULATIONAHA.110.970145. [DOI] [PMC free article] [PubMed] [Google Scholar]
- Hodson L, Humphreys SM, Karpe F, Frayn KN. Metabolic signatures of human adipose tissue hypoxia in obesity. Diabetes. 2012;62:1417–1425. doi: 10.2337/db12-1032. [DOI] [PMC free article] [PubMed] [Google Scholar]
- Hosogai N, Fukuhara A, Oshima K, Miyata Y, Tanaka S, Segawa K, et al. Adipose tissue hypoxia in obesity and its impact on adipocytokine dysregulation. Diabetes. 2007;56:901–911. doi: 10.2337/db06-0911. [DOI] [PubMed] [Google Scholar]
- Michailidou Z, Turban S, Miller E, Zou X, Schrader J, Ratcliffe PJ, et al. Increased angiogenesis protects against adipose hypoxia and fibrosis in metabolic disease-resistant 11beta-hydroxysteroid dehydrogenase type 1 (HSD1)-deficient mice. The Journal of Biological Chemistry. 2012;287:4188–4197. doi: 10.1074/jbc.M111.259325. [DOI] [PMC free article] [PubMed] [Google Scholar]
- Pasarica M, Sereda OR, Redman LM, Albarado DC, Hymel DT, Roan LE, et al. Reduced adipose tissue oxygenation in human obesity: Evidence for rarefaction, macrophage chemotaxis, and inflammation without an angiogenic response. Diabetes. 2009;58:718–725. doi: 10.2337/db08-1098. [DOI] [PMC free article] [PubMed] [Google Scholar]
- Rausch ME, Weisberg S, Vardhana P, Tortoriello DV. Obesity in C57BL/6J mice is characterized by adipose tissue hypoxia and cytotoxic T-cell infiltration. International Journal of Obesity. 2008;32:451–463. doi: 10.1038/sj.ijo.0803744. [DOI] [PubMed] [Google Scholar]
- Schindelin J, Arganda-Carreras I, Frise E, Kaynig V, Longair M, Pietzsch T, et al. Fiji: An open-source platform for biological-image analysis. Nature Methods. 2012;9:676–682. doi: 10.1038/nmeth.2019. [DOI] [PMC free article] [PubMed] [Google Scholar]
- Sung HK, Doh KO, Son JE, Park JG, Bae Y, Choi S, et al. Adipose vascular endothelial growth factor regulates metabolic homeostasis through angiogenesis. Cell Metabolism. 2013;17(1):61–72. doi: 10.1016/j.cmet.2012.12.010. [DOI] [PubMed] [Google Scholar]
- Wree A, Mayer A, Westphal S, Beilfuss A, Canbay A, Schick RR, et al. Adipokine expression in brown and white adipocytes in response to hypoxia. Journal of Endocrinological Investigation. 2012;35:522–527. doi: 10.3275/7964. [DOI] [PubMed] [Google Scholar]


