

Abstract
In this study, a series of new, highly sensitive BF2-chelated tetraarylazadipyrromethane dyes are synthesized and analyzed to be suitable as on/off photo-induced electron transfer modulated fluorescent sensors for determination of intracellular pH. The ethanolic solutions of the new indicators feature absorption maxima in the range of 696–700 nm and a fluorescence emission maximum at 720 nm. Molar absorptivity and fluorescence quantum yield data were determined for the studied set of aza-BODIPY indicators. These indicators have high molar absorption coefficients of ~80 000 M−1 cm−1 and quantum yields (up to 18%). Corresponding pKa values of indicators are determined from absorbance and fluorescence measurements and range from 9.1 to 10.8, depending on the selective positioning of electron-donating functionalities. The excellent photostability of the aza-BODIPY indicators makes them particularly suitable for long duration measurements. The in vitro cellular staining of living tissues in PC3 cells based on the isosbestic point at pH 7.8 and pH 9.3 has been employed which shows an increase in fluorescence intensity at 800 nm with increase in pH for certain compounds and fluorescence intensity decreases at 700 nm. Therefore, the new indicators are suitable for exploitation and adaptation in a diverse range of analytical applications.
Introduction
The design, synthesis, and spectroscopic characterization of novel fluorescent chemosensors continue to attract sustained research interest.1 Recently, fluorophores in the near-infrared (NIR) region have attracted much attention because of rapid advancements in various bioanalytical and optical imaging techniques, such as DNA sequencing, gel electrophoresis, nucleic acid detection, in vivo imaging, vascular mapping and tissue perfusion.2
There are several advantages of working in the NIR region of the spectrum. Firstly, the endogenous chromophores present in living tissues absorb and scatter visible light, limiting its penetration to only a few millimeters. Secondly, the absorption coefficient of tissue is much lower for NIR light, which permits deeper penetration to depths of several centimeters.3 Additionally, the scattered light from the excitation source is greatly reduced in the NIR region since the scattering intensity is proportional to the inverse fourth power of the wavelength. Low background noise and low scattering of the NIR light result in a high signal to noise ratio, thereby allowing highly sensitive detection. Further advantages of NIR radiation include low interference from Raman scattering and reduced possibility of sample degradation. Due to these combined characteristics, this region of the electromagnetic spectrum (700–900 nm) is often referred to as the “window of biological clarity.” These advantages, along with the availability and low cost of long-wavelength diode lasers and detectors for the NIR light, have led to increasing research interest in the design, development, spectroscopic characterization and application of novel NIR-fluorescent fluorophores.4 In addition to the absorption and emission in the NIR region, an ideal NIR dye should possess high molar absorption coefficients, high fluorescence quantum yields, robustness against light and chemicals, good solubility, resistance towards self-aggregation, straightforward synthetic routes and amenability towards further facile functionalization.5
An interesting and highly modifiable class of dyes that satisfy most of the above-mentioned requirements are aza-BODIPY dyes. Common BODIPY attributes include excellent photophysical properties such as high molar absorption coefficients, negligible dependence on solvent polarity and numerous sites of potential synthetic modification.6,7 Intracellular pH plays a diverse and crucial role in several biological processes and disorders. As a result, design and construction of selective and sensitive fluorescent chemosensors have gained considerable research interest over the past decade. The measurement of pH by fluorescence-based techniques is well established for both imaging and sensing applications8 in various fields of experimental science, such as optical data storage,9 photoconductors,10 electrochromic devices,11 chemosensors,12 immunoassay labels and bioconjugated probes13 and in vitro and in vivo imaging agents.14 Several aza-BODIPY dye fluorescent pH indicators bearing amino- or hydroxy-functionalized substituents were reported by O'Shea and Klimant, respectively.15–18
In this study, we report synthesis and spectroscopic characterization of four aza-BODIPY fluorophore derivatives that can probe pH changes by their emission intensity changes. The aza-BODIPY fluorophore derivatives possess more than one pKa value in the alkaline pH range. A systematic study of the properties of these pH indicators and possible synthetic modifications with respect to tuning the pKa values has been demonstrated. Additionally, the characterized NIR fluorescent BODIPY probes were employed for in vitro visualization, imaging and staining of living tissues in PC3 cells based on the isosbestic point at pH 7.8 and pH 9.3. These pH indicators enable a variety of potential applications for sensors and imaging and may be useful in designing novel aza-BODIPY fluorophore dyes for analytical and spectroscopic applications.
Experimental section
Chemicals and reagents
The four aza-BODIPY fluorophore dyes were synthesized using commercially obtained reagents from Sigma Aldrich, Alfa Aesar and Matrix Scientific and the chemicals were utilized without purification. Solvents for the synthetic steps were of HPLC grade from Sigma Aldrich. The 1H NMR and 13C NMR spectra were recorded on a Bruker Avance (400 MHz) spectrometer using DMSO-d6 or MeOD-d4 containing tetramethylsilane (TMS) as an internal calibration standard. The chemical reagents utilized for the analytical experiments are discussed further with the 2,9,16,23-tetra-tert-butyl-29H,31H-phthalocyanine (97%, Aldrich, St. Louis, MO) being obtained for use as a reference standard in the determination of the relative quantum yield. Indocyanine green (ICG) was purchased (Sigma-Aldrich, MO, USA) to be used as a reference standard in the stability study. Sodium hydroxide (J.T. Baker, NJ, USA), acetonitrile, toluene and ethanol (Sigma-Aldrich, MO, USA), DMSO (99.9%, spectroscopic grade, Acros, NJ, USA), sodium chloride, benzene (Fisher Scientific, NJ, USA), cyclohexane (99%, Alfa Aesar, Ward Hill, MH, USA), and chloroform (HPLC grade, Merck KGaA, Darmstadt, Germany) were all commercially obtained and used in the analytical experiments.
Apparatus
High-resolution accurate mass spectra (HRMS) were obtained either at the Georgia State University Mass Spectrometry Facility using a Waters Q-TOF micro (ESI-Q-TOF) mass spectrometer or utilizing a Waters Micromass LCT TOF ES+ Premier Mass Spectrometer. Liquid chromatography utilized a Waters 2487 single wavelength absorption detector with wavelengths set between 640 and 700 nm depending on the dye's photophysical properties. The column used in LC was a Waters Delta-Pak 5 µM 100 °Å 3.9 × 150 mm reversed phase C18 column. Evaporative light scattering detection analyzes trace impurities that cannot be observed by alternate methods; a SEDEX 75 ELSD was utilized in tandem with liquid chromatography to confirm the purity. Absorbance spectra were measured using a Cary 300 UV-visible spectrophotometer (Agilent Technologies, Santa Clara, CA, USA) interfaced to a PC, with a spectral bandwidth of 2 nm. The fluorescence spectra and measurements were recorded using an ISS K2 Multifrequency Cross-correlation Phase and Modulation Fluorometer (ISSTm Focus and Discover, Champaign, USA), interfaced to a PC, equipped with a 300 W xenon arc lamp, grating excitation and emission monochromators and a K2.EL data acquisition recorder using steady state settings. Slit widths for both monochromators were 2 mm (mechanical widths). Disposable absorbance cuvettes and quartz fluorescence cuvettes with pathlengths of 1.00 cm were used for absorbance and fluorescence measurements, respectively. All calculations were carried out using Microsoft Excel (Microsoft Corporation, Redmond, WA). A SympHonly (SB20) pH-meter (Thermo Orion Beverly, MA, U.S.A) was used for pH measurements. Deionized water was prepared using a Barnstead NANO pure DIamond Analytical (USA) ultrapure water system.
Dye synthesis
Synthesis of chalcone analogs 5–7
Solutions of benzaldehydes 1–2 and acetophenones 3–4 were combined in a 1 : 1 molar ratio. The mixture was diluted with ethanol (30 mL) and a sodium hydroxide solution (40% in water, 10 mL) was added. The reaction mixture was heated to 55 °C for 2 hours until the starting material was consumed. The volatile solvents were concentrated under reduced pressure and the product was obtained as a yellow solid after water was added. The chalcones 5–7 were obtained in excellent purity after dissolving the solid in a minimal amount of ethanol and diluting with water.
General synthetic procedure for nitro compounds 8–10
Diethylamine (6 molar equivalents) was added to solutions of individual chalcones 5–7 in ethanol (50 mL). Nitromethane (12 molar equivalents) was added dropwise to the reaction mixture. The reaction was allowed to reflux for 8 h until the starting material was consumed. The resulting mixture was cooled to room temperature and the ethanol was removed under reduced pressure. The residue was diluted with ethyl acetate and washed with brine (5 × 30 mL). The organic layer was extracted, dried over magnesium sulfate and the solvent was removed under reduced pressure to afford the final compounds. The compounds were used in the next step without purification.
General synthetic procedure for BODIPY precursors 11–13
Individual compounds 8–10 (3.5 mmol) and ammonium acetate (9.46 g, 0.12 mol) were dissolved in ethanol (25 mL) and heated at reflux for 72 h. The solution was cooled to room temperature, the solvent was evaporated and the resulting viscous dark blue residue was dissolved in CH2Cl2 (40 mL). The organic solution was washed with water (3 × 80 mL), combined, dried over sodium sulfate and evaporated under reduced pressure. The resulting solid was triturated with cold methanol (10 mL) and filtered to give a dark blue solid.
(Z)-4-(3-(4-Ethoxyphenyl)-2-((3-(4-ethoxyphenyl)-5-(4-hydroxyphenyl)-1H-pyrrol-2-yl)imino)-2H-pyrrol-5-yl)phenol (11)
Compound 11 (R1 = OEt, R2 = OH) was obtained as a blue solid (35%). Mp: >230 °C; 1H NMR (DMSO-d6): 8.03 (d, J = 9 Hz, 4H), 7.88 (d, J = 9 Hz, 4H), 7.39 (s, 2H), 7.00–7.02 (m, 8H), 4.11 (m, 4H), 1.37 (m, 6H); 13C NMR (DMSO-d6): 160.37, 159.09, 154.60, 148.90, 141.21, 130.33, 128.78, 126.31, 123.23, 116.88, 114.87, 113.90, 63.68, 15.09.
(Z)-4,4′-(2-((3,5-Bis(4-hydroxyphenyl)-1H-pyrrol-2-yl)imino)-2H-pyrrole-3,5-diyl)diphenol (12)
Compound 12 (R1 = OH, R2 = OH) was obtained as a blue solid and was used in the next step without purification.
(Z)-4-(5-(4-Ethoxyphenyl)-2-((5-(4-ethoxyphenyl)-3-(4-hydroxyphenyl)-1H-pyrrol-2-yl)imino)-2H-pyrrol-3-yl)phenol (13)
Compound 13 (R1 = OH, R2 = OEt) was obtained as a blue solid (48%). Mp: >230 °C; 1H NMR (DMSO-d6): 9.74 (br s, 2H), 7.95–7.99 (m, 8H), 7.40 (s, 2H), 7.18 (d, J = 8 Hz, 4H), 6.85 (d, J = 8 Hz, 4H), 4.17 (m, 4H), 1.39 (m, 6H).
General synthetic procedure for 14–16
Solutions of corresponding 11–13 (0.09 mmol) in anhydrous dichloromethane (2.5 mL) were cooled to 0 °C, then BBr3 (0.9 mL, 0.90 mmol) was added dropwise over a few min. The solution was then allowed to reach room temperature and stirring was continued for an additional 10 h. The reaction was then quenched with water at 0 °C and extracted with ethyl acetate. The combined organic layers were washed with saturated NH4Cl, dried over sodium sulfate and concentrated in vacuo. The product was then purified by column chromatography on silica gel eluted with 5% ethyl acetate–hexane to yield the desired product.
(Z)-4-(2-((1-(Difluoroboranyl)-3-(4-ethoxyphenyl)-5-(4-hydroxyphenyl)-1H-pyrrol-2-yl)imino)-3-(4-ethoxyphenyl)-2H-pyrrol-5-yl)-phenol (14)
Compound 14 (R1 = OEt, R2 = OH) was obtained as a blue solid (45%). Mp: >260 °C; 1H NMR (CDCl3): 8.88 (d, J = 3 Hz, 2H), 8.22 (d, J = 7 Hz, 2H), 8.12 (d, J = 3 Hz, 2H), 7.77 (s, 2H), 7.76 (d, J = 4 Hz, 2H), 7.28 (dd, J1 = 6 Hz, J2 = 1.4 Hz, 2H), 5.73 (d, J = 7 Hz, 2H), 5.25 (s, 2H), 3.95 (br s, 4H), 3.28 (m, 4H), 3.00 (s, 18H), 2.10 (br s, 4H), 1.70 (s, 12H); 13C NMR (CDCl3): 181.88, 175.21, 155.23, 143.57, 142.04, 141.23, 137.19, 133.25, 130.67, 129.92, 127.51, 120.49, 111.37, 102.87, 63.95, 53.84, 49.82, 41.30, 39.42, 32.25, 27.51, 21.16; HRMS (TOF MS ES+): calcd for [C36H31BN3O4F2]+ 618.2376 found 618.2366. An additional peak was found in the mass spectrum which indicated the sodium salt of the compound—HRMS (TOF MS ES+): calcd for [C36H30BN3O4F2Na]+ 640.2195 found 640.2178.
(Z)-4,4′-(5-((3,5-Bis(4-hydroxyphenyl)-2H-pyrrol-2-ylidene)-amino)-1-(difluoroboranyl)-1H-pyrrole-2,4-diyl)diphenol (15)
Compound 15 (R1 = OH, R2 = OH) was obtained as a dark blue solid (38%). Mp: >260 °C; 1H NMR (400 MHz, MeOD-d4): 7.88 (d, J = 9 Hz, 4H), 7.85 (d, J = 9 Hz, 4H), 7.21 (s, 2H), 7.01 (d, J = 9 Hz, 4H), 6.84 (d, J = 9 Hz, 4H), 13C NMR (100 MHz, MeOD-d4): 155.26, 142.41, 141.83, 138.78, 135.14, 131.39, 130.80, 129.17, 120.91, 21.39, 19.60, 14.85, 13.52.
(Z)-4-(1-(Difluoroboranyl)-5-(4-ethoxyphenyl)-2-((5-(4-ethoxyphenyl)-3-(4-hydroxyphenyl)-2H-pyrrol-2-ylidene)amino)-1H-pyrrol-3-yl)phenol (16)
Compound 16 (R1 = OH, R2 = OEt) was obtained as a blue solid (81%). Mp: 239–240 °C; 1H NMR (DMSOd6): 10.06 (br s, 2H), 8.09 (m, 8H), 7.38 (s, 2H), 7.09 (d, J = 9 Hz, 4H), 6.91 (d, J = 9 Hz, 4H), 4.16 (m, 4H), 1.37 (m, 6H), 13C NMR (DMSO-d6): 161.39, 159.76, 157.23, 144.64, 142.69, 131.95, 131.37, 123.87, 123.65, 117.74, 116.20, 115.14, 64.01, 15.05; HRMS (TOFMS ES+): calcd for [C36H31BN3O4F2]+ 618.2376 found 618.2361.
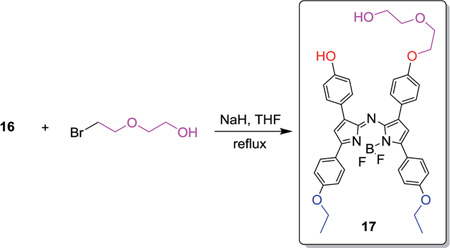
(Z)-4-(2-((1-(Difluoroboranyl)-5-(4-ethoxyphenyl)-3-(4-(2-(2-hydroxyethoxy)ethoxy)phenyl)-1H-pyrrol-2-yl)imino)-5-(4-ethoxyphenyl)-2H-pyrrol-3-yl)phenol (17)
Compound 17 (0.14 mmol) and NaH (60% oil dispersion) (12 mg, 0.52 mmol) were stirred in dry THF (8 mL) and treated with 2-(2-bromoethoxy)ethanol (0.15 mmol) at 0 °C under N2. The reaction was warmed to rt and then heated under reflux for 3 h. The reaction mixture was cooled and partitioned between EtOAc (10 mL) and brine (20 mL). The organic layer was separated, dried over sodium sulfate and the solvent was removed under reduced pressure. Purification was achieved through column chromatography on silica eluting with hexane–EtOAc (4 : 1). Compound 17 was obtained as a blue solid (63%). Mp: >220 °C; 1H NMR (DMSO-d6): 10.08 (s, 1H), 8.02–8.15 (m, 8H), 7.43 (d, J = 12 Hz, 2H), 7.08–7.12 (m, 6H), 6.95 (d, J = 12 Hz, 2H), 4.65 (m, 1H), 4.13–4.23 (m, 6H), 3.80 (t, 2H), 3.54 (m, 4H), 1.37 (m, 6H), 13C NMR (DMSO-d6): 161.53, 161.36, 160.27, 159.90, 157.87, 156.82, 144.94, 144.45, 143.05, 141.85, 132.07, 131.94, 131.38, 131.14, 125.21, 123.88, 123.75, 123.54, 118.21, 117.92, 116.31, 115.22, 115.17, 115.15, 72.97, 69.34, 67.89, 64.04, 64.01, 60.72, 15.04; HRMS (TOF MS ES+): calcd for [C40H39BN3O6F2]+ 706.2900 found 706.2884.
Stock solutions
Stock solutions of the dyes were prepared by weighing the powder on a 5-digit analytical balance directly into a glass vial then adding ethanol (final concentration 0.5 mM). The contents of the vial were vortexed for 20 seconds, then sonicated for 15 min to ensure complete dissolution. The stock solutions were protected from light and stored in a freezer when not in use. Working solutions were prepared by further dilution of the stock solutions with the same solvent to give the final desired concentrations 100 µM and 10 µM formolar absorptivity and relative fluorescence quantum yield measurements, respectively.
Determination of molar absorptivity
Aliquots of the working standard solution were transferred into a series of 10 mL Fischer brand disposable tubes to prepare six samples in ethanol with final concentrations ranging from 1.0–10.0 µM. The volume was completed with ethanol, the contents were mixed well and the absorbance spectrum of each sample was measured. The absorbance at the wavelength of maximum absorbance (λmax) was plotted vs. the final dye concentration (µM) to obtain the calibration graph. Alternatively, the corresponding regression equation was derived.
Determination of relative fluorescence quantum yield
Aliquots of the working standard solution were transferred into a series of 10 mL Fischer brand disposable tubes to prepare four samples in ethanol such that their absorbance at λexc was less than 0.1 (to prevent the inner filter effect in fluorescence measurements). The absorbance and fluorescence spectra of each sample were obtained concurrently to minimize experimental error from photo-bleaching and potential solubility issues. Relative fluorescence quantum yields were determined using tetra-tert-butyl-29H,31H-phthalocyanine as a standard (quantum yield = 0.44).19 For both the indicators and the standard, duplicate absorbance scans were obtained and the absorbance values and λexc were averaged. The emission spectra of the indicators and the standard solutions were measured in triplicate using the ISS-K2 fluorimeter with 650 nm excitation wavelength. The area under each fluorescence curve was calculated and corrected and the average fluorescence peak areas were determined.
Determination of pKa values of the indicators
Aliquots of the stock (500 µM) and/or working (100 µM) solution were transferred into a series of 10 mL Fischer brand disposable tubes maintaining 3% of ethanol as a constant ratio. The solutions were adjusted to constant ionic strength (IS = 0.02 M) using sodium chloride as the background electrolyte. pKa values of the new indicators were then determined from both the absorption and fluorescence measurements using zero-order, first-order derivative and second-order derivative data (if necessary).
Stability study
Aliquots of the working standard solution of the dyes and ICG were transferred into a series of 10 mL Fischer brand disposable tubes to prepare the samples in ethanol with a final concentration of 10.0 µM. The volume was completed with ethanol, the contents were mixed well. Three samples of the dyes and ICG were stored under different conditions: one sample was stored at room temperature in the dark; the second sample was irradiated with a double T5 lighting system (SolarMax H.O.™, 39 Wx2) at a distance of 3 cm at room temperature and the third sample was exposed to solar light at room temperature. The three sample solutions were measured simultaneously and the photodegradation profiles were obtained by monitoring the absorption spectra.
Optical property measurement
All optical measurements for biological samples were performed at 37 °C in phosphate-buffered saline (PBS), pH 7.4 or 100%fetal bovine serum (FBS) buffered with 50 mM HEPES, pH 7.4.20,21 Blood samples were taken from CD-1 mice before injecting fluorophores and the pH was adjusted using sodium bicarbonate (Fisher Scientific). Absorbance and fluorescence emission spectra of the series of NIR fluorophores were measured using fiber optic HR2000 absorbance (200–1100 nm) and USB2000FL fluorescence (350–1000 nm) spectrometers (Ocean Optics, Dunedin, FL). NIR excitation was provided by a 655 nm red laser pointer (Opcom Inc., Xiamen, China) set to 5 mW or a 770 nm NIR laser diode light source (Electro Optical Components, Santa Rosa, CA) set to 10 mW and coupled through a 300 µm core diameter, NA 0.22 fiber (Fiberguide Industries, Stirling, NJ).
Live cell labeling and imaging
Cells were purchased from ATCC (Manassas, VA, USA) and grown in DMEM (Mediatech, Hermdon, VA) supplemented with 10% FBS and gentamicin (50 mg mL−1) in a humidified incubator at 37 °C under 5% CO2 in air. Cells were seeded onto sterilized 18 mm diameter glass coverslips in 12-well plates (3 × 10⁵ cells per well), and incubated at 37 °C for 15 min in the presence of 1 µM BODIPY probes. The pH of each buffer solution was adjusted using sodium bicarbonate. After washing, the slides were observed using a 4-channel NIR fluorescence microscope.22
NIR fluorescence microscopy
NIR fluorescence microscopy was performed on a Nikon TE300 with a QImaging color camera, a Hamamatsu Orca R2 camera for fluorescence imaging and IVison software for data collection. 700 nm NIR fluorescence images were collected using a xenon lamp and passed through a 650/45 nm BP excitation filter, a 680 nm LP dichroic mirror, and a 710/50 nm BP emission filter, while 800 nm NIR images were collected through a 750/50 nm BP excitation filter, a 785 nm LP dichroic mirror, and a 810/40 nm BP emission filter.22 All filters were purchased from Chroma Technologies. Exposure times were varied to obtain a similar maximum fluorescence value for each fluorescence image. H&E images from a matching field of view were obtained. All NIR fluorescence images for a particular fluorophore were normalized identically for all conditions of an experiment. That is, for each NIR fluorophore, the image with the strongest signal was optimized for brightness, contrast, and gamma (BCG) then these settings were applied to all other images acquired using that particular fluorophore.
Animals and optical fluorescence imaging
Animals were housed in an AAALAC-certified facility, and all animal studies were performed under the supervision of Beth Israel Deaconess Medical Center's Institutional Animal Care and Use Committee (IACUC) in accordance with the approved institutional protocol #101–2011. Prior to surgery, animals were anesthetized with 100 mg kg−1 ketamine and 10 mg kg−1 xylazine intraperitoneally (Webster Veterinary, Fort Devens, MA). For the biodistribution and clearance study, 6 weeks old (20–25 g) male CD-1 mice were purchased from Charles River Laboratories (Wilmington, MA). Each BODIPY fluorophore in D5W (Fisher Scientific) containing 5% Cremophor (Fisher Scientific) was administered intravenously at a dose of 500 pmol g−1 of animal weight. Animals were imaged using the FLARE™ imaging system as described in detail previously.23,24 In this study, 670 nm excitation and 760 nm excitation fluence rates used were 4.0 and 11.0 mW cm−2, respectively, with white light (400 to 650 nm) at 40 000 l×. Color video and 2 independent channels (700 nm and 800 nm) of NIR fluorescence images were acquired simultaneously with custom FLARE software at rates up to 15 Hz over a 15 cm diameter field of view (FOV). The imaging system was positioned at a distance of 18 inches from the surgical field. A custom filter set (Chroma Technology Corporation, Brattleboro, VT) composed of a 750 ± 25 nm excitation filter, a 785 nm dichroic mirror, and an 810 ± 20 nm emission filter was used to detect 800 nm NIR images, while 650 ± 22 nm and 710 ± 25 nm excitation and emission filters were used for 700 nm NIR images.
Results and discussion
Synthesis
The synthetic steps for the synthesis of BODIPY derivatives began with the Aldol condensation between para-substituted benzaldehyde and derivatives of acetophenone as shown in Scheme 1. These reactions proceed satisfactorily in ethanol with potassium hydroxide. The resulting α,β-unsaturated ketones 5–7 were subjected to Michael addition conditions to result in the nitro-compounds 8–10 that upon ammonium formate reduction in ethanol yielded the triaza-percursors 11–13. Treatment of these analogs with boron trifluoride diethyl etherate with N,N-diisopropylethylamine in dichloromethne afforded the final BODIPY dyes 14–16. Derivative 16 was subjected to the additional reaction shown in eqn (1) using sodium hydride to facilitate phenolic deprotonation followed by nucleophilic displacement of bromine in 2-(2-bromoethoxy)ethanol which effected the transformation in good yield to afford the desired product 17.
Scheme 1.

Optical property determination
The new aza-BODIPY dyes shown in Scheme 1 and eqn (1) were dissolved in EtOH, and their spectroscopic properties were investigated (Fig. 1A and B, Table 1).
 |
(1) |
Fig. 1.

(A) Absorbance spectra of pH sensor dyes in EtOH (10 × 10−6 M). (B) Fluorescence spectra of pH sensor dyes in EtOH (λexc 650 nm) (14; 5.00 × 10⁻⁷ M, 15; 1.25 × 10⁻⁶ M, 16; 5.00 × 10⁻⁷ M and 17; 9.00 × 10⁻⁷ M: abs ≈ 0.04–0.05). pH responsive absorbance spectra of compound 14 (C), 15 (D), 16 (E), and 17 (F) in 3% EtOH–water solution, I NaCl = 0.02.
Table 1.
Spectroscopic properties of the aza-BODIPY probes 14–17: absorbance maxima under acidic (λabs-acid) and basic conditions (λabs-base), emission maxima (λem), molar absorption coefficients (ε), and relative fluorescence quantum yields (QY)
| λabs (nm) |
λabs-acid/λabs-base (nm) |
λem (nm) |
λem (nm) | ε (M−1 cm−1) | QY (%) | |||
|---|---|---|---|---|---|---|---|---|
| Dye | R1 | R2 | EtOH | H2O | EtOH | H2O | EtOHa | EtOHa |
| 14 | OEt | OH | 700 | 769/795 | 720 | 765/781 | 82 000 | 15 |
| 15 | OH | OH | 698 | 650/771 | 718 | 810 | 36 800 | 11 |
| 16 | OH | OEt | 696 | 672, 740b | 716 | 775 | 80 000 | 11 |
| 17 | OH/PEG | OEt | 696 | 745/802 | 715 | 795/813 | 66 600 | 18 |
For the protonated form.
The two λmax are similar in both protonated and deprotonated forms (no shift).
The absorption of the probes bearing a hydroxyl group in the p-positions of Ar1–4 is rather similar (696–700 nm) which is bathochromically shifted ~50 nm from the absorbance value of the non-substituted tetraphenyl aza-BODIPY chromophore (650 nm).25 The shortest wavelengths of the absorption maxima are observed for 16 (R1 = OH, R2 = OEt) and compound 17 (R1 = OH/PEG, R2 = OEt) (696 nm). The absorption of 14 (R1 = OEt, R2 = OH) is bathochromically shifted ~4 nm as compared with 16 (R1 = OH, R2 = OEt). Interestingly, the introduction of four hydroxy groups in the four para-positions of 15 (R1 = OH, R2 = OH) results in very minor changes compared with its ethoxy derivative 16 (R1 = OH, R2 = OEt).
The trend observed in absorption maxima in EtOH was the same for fluorescence emission maxima in EtOH (Table 1). Namely, only 5 nm differences between the wavelengths of the emission maxima in EtOH was observed for 14 and about 3 nm for 15 which mirrored the minor bathochromic shifts observed when comparing their UV-visible spectra. These observed data indicate pronounced conjugation of the Ar3 and Ar4 rings with the aza-BODIPY chromophore 14 and the absence of such conjugation for the Ar1 and Ar2 rings (16 and 17). This conjugation can be caused by hydrogen–halogen bonding interactions between the fluorine atom and the hydrogen atom located in the o-position of Ar3 and Ar4 rings.18 Interestingly, the hydroxyl groups in the p-position of the Ar3 and Ar4 rings result in the bathochromic shift of the absorption and fluorescence spectra more than their effect if located in the Ar1 and Ar2 rings.
The molar absorption coefficients and the relative fluorescence quantum yields (QY) for all aza-BODIPY derivatives are determined and abridged in Table 1. The molar absorption coefficients and the relative fluorescence quantum yields determined in this study are in good agreement with those reported by Jokic et al.18 Similar to the relative fluorescence quantum yields (QY) of most reported NIR-emitting dyes, the QYs of our aza-BODIPY indicators are generally lower than those of analogous compounds that emit visible wavelength fluorescence. The lower QY (0.11–0.18 in EtOH) can be explained by a lowering of the excited state energy levels resulting in more efficient energetic deactivation involving vibrational relaxation. In summary, the photophysical properties of the new aza-BODIPY indicators retain most of the advantages of the aza-BODIPY, including characteristically high molar absorption coefficients with acceptable relative fluorescence quantum yields.
pH-sensing properties
The pKa values of the new pH indicators were determined in a 3% ethanol–water solution from the absorption and fluorescence measurements. It can be seen that the absorption spectra shift bathochromically upon deprotonation of the hydroxyl group in all cases except for 16 (R1 = OH, R2 = OEt), even at very low concentration (Fig. 1, Table 1). Notably, the absorption spectrum of deprotonated compound 16 is rather unusual and shows two peaks (Fig. 1). The pKa values determined for the new probes at 0.02 M ionic strength of the solution are shown in Table 2.
Table 2.
The pKa values of the aza-BODIPY indicators
| Dye | R1 | R2 | pKa (abs) | pKa (em) | pKa (intersect) |
|---|---|---|---|---|---|
| 14 | OEt | OH | 1 (796 nm) = 9.10 | 1 (765 nm) = 9.15 | 9.20 |
| 2 (796 nm) = 9.95 | 2 (765 nm) = 10.10 | ||||
| 15 | OH | OH | 1 (771 nm) = 9.10 | 1 (810 nm) = 9.10 | 9.10 |
| 2 (810 nm) = 9.95 | |||||
| 2 (771 nm) = 10.80 | 3 (810 nm) = 10.55 | 9.95 | |||
| 4 (810 nm) = 10.80 | |||||
| 16 | OH | OEt | 1 (825 nm) = 10.65 | 1 (765 nm) = 10.80 | 10.80 |
| 2 (825 nm) = 10.85 | |||||
| 17 | OH/PEG | OEt | 1 (800 nm) = 10.85 | 1 (785 nm) = 10.80 | 10.90 |
The pKa of the aza-BODIPY derivatives can be tuned from 9.10 to 10.85 by changing the position of the hydroxyl group. For instance, two pKa values were determined for probe 14 (R1 = OEt, R2 = OH); 9.10 and 9.95, using first-order derivative absorption data at a wavelength of 796 nm. It was found that the pKa1 and pKa2 are separated by only 0.85 units, which is not enough to exhibit a clear isosbestic point. If a hydroxyl group is introduced in the p-position of the Ar1 or Ar2 aryl rings instead of the Ar3 or Ar4 aryl rings, the pKa increases to 10.65 and 10.80 (e.g. 16 and 17). This is very close to the pKa value of phenol (pKa = 10)26 which indicates the absence of the conjugation with the aza-BODIPY core. This observation is in good agreement with the trends obtained from the fluorescence spectra. The apparent pKa values obtained from the emission measurements in solutions are very similar to those determined from the absorption spectra (Table 2).
It is interesting to observe virtually complete quenching of the fluorescence in the pH range where indicator 14 is deprotonated (Fig. 2), which is attributed to efficient photoinduced electron transfer (PET).27,28 Upon protonation, the fluorescence spectrum showed a strong proton induced fluorescence enhancement with a wavelength of maximum fluorescence emission at 765 nm (excitation at 690 nm) (Fig. 2). A first-order plot of fluorescence intensity (at λem 765 nm) vs. pH predicted apparent pKa values of 9.15 and 10.10. Significantly, the enhancement of fluorescence intensity was greater than 7-fold between the chemosensor's off and on positions. This is further endorsed by analyzing the absorption spectrum of 14. A pH titration displays strong charge transfer (CT) characteristics with three bands between 400 and 900 nm (Fig. 1C). At pH 6.82, band 1 gave a maximum at 769 nm, and upon increasing the pH value up to 9.46, a hypochromic effect with bathochromic shift (band 2 with a maximum at 778 nm) was clearly seen. Then from pH 9.62 and above, a third absorption band at 795 nm was observed with a progressive increase in the intensity. A plot of the first-order derivative of absorbance intensity at λ (abs at 796 nm) vs. pH clearly demonstrates a double deprotonation event occurring as a consequence of the two hydroxyl groups predicting apparent two pKa (λabs 796 nm) values of 9.10 and 9.95 of the indicator (Fig. 2). Moreover, plotting of the ratiometric pH profile of compound 14 for increase of absorbance at 796 nm and decrease of fluorescence emission at 765 nm (λexc 690 nm) gives an intersect at 9.20 (Fig. 3).
Fig. 2.

(Top) pH responsive fluorescence spectra of compound 14 (excitation 690 nm, 4.8 × 10⁻⁷ M) in EtOH–H2O, I NaCl = 0.02 M. The inset shows the first-order plot predicting apparent pKa (λem 765 nm) values of 9.15 and 10.10. (Bottom) Selected pH responsive absorbance spectra of 14 (3 × 10⁻⁶ M) in EtOH–H2O, I NaCl = 0.02 M. The inset shows the first-order plot predicting apparent pKa (λabs 796 nm) values of 9.10 and 9.95.
Fig. 3.

Ratiometric pH profile of 14 for the increase of absorbance at 796 nm (red; sigmoidal fit, 3 × 10⁻⁶ M) and decrease of fluorescence emission at 765 nm (blue; sigmoidal fit, 4.8 × 10⁻⁷ M, λexc 690 nm) giving an intersect at 9.20.
Photostability
Photostability is a very important parameter for all optical chemosensors. We investigated solutions of the new pH dyes in ethanol under continuous illumination with a double T5 lighting system (SolarMax H.O.™, 39 Wx2) at a distance of 3 cm at room temperature and solar light at room temperature. Fig. 4 demonstrates the photodegradation profiles for the new compounds and for ICG, which is used for comparison. The aza-BODIPY probes were significantly more photostable (about 80-fold) than ICG under identical conditions. In fact, the pH indicators 14, 16 and 17 are stable for 4 days and only 11–20% of these dyes were decomposed compared with ICG. However, compound 15 is fully stable for one day with 67% remaining after 15 days compared to 0% of ICG as per absorbance measurements. The photostability trend for aza-BODIPY probes was 17 > 16 > 14 > 15 (Fig. 4). The presence of four hydroxyl groups in the aryl rings Ar1 and Ar2 of compound 15 seems to be responsible for decreased photostability; nevertheless, new pH dyes retain the excellent photostability of aza-BODIPY dyes which makes them particularly suitable for long-duration measurements, especially compared to the industry imaging standard ICG.
Fig. 4.

(Left) Comparison of photobleaching profiles for aza-BODIPY fluorescent pH probes and ICG in ethanol determined from the absorption measurements after irradiation with a double T5 lighting system. (Right) Comparison of photobleaching profiles for aza-BODIPY fluorescent pH probes and ICG in ethanol determined from the absorption measurements after exposure to sunlight.
Live cell imaging and in vivo biodistribution
To evaluate the feasibility of using these pH sensors in vivo, the pH sensitivity of dyes was tested in biological and physiological conditions. As shown in Fig. 5, the fluorescence emission of BODIPY 14 in PBS exhibited gradual changes of fluorescence signals between 700 nm and 800 nm ratiometrically, which was monitored by using the dual-channel FLARE imaging system. Similar pH dependent changes were observed in live cell imaging (Fig. 6). PC3 cells were incubated with the series of BODIPY probes for 15 min, where the pH of media was adjusted using sodium bicarbonate. All lipophilic compounds were internalized across the cellular membrane and accumulated in the cytoplasm. Significantly, the PC3 cells incubated with compound 14 showed relatively high signals in 700 nm at lower pH, and the internal cellular fluorescence decreased along with the isosbestic point. Cells incubated with the rest of the molecules showed no significant changes in different pH media. In addition, the pH dependency of compounds 14 and 15 was evaluated in D5W containing 5% Cremophor before administering into mice. Only compound 14 displayed stable absorbance and fluorescence emission spectra in the working solution (Fig. 7). The buffered dye solutions at pH 7.8 were injected intravenously into CD-1 mice, and their biodistribution and clearance profiles were monitored using the FLARE intraoperative imaging system. As shown in Fig. 7B, because of their inherit hydrophobicity, all dyes were taken up by lung, liver, and spleen, where macrophages work for nonspecific host defense, as well as specific immune responses. Animals injected with compound 14 showed relatively low background signals compared to other animals injected with compounds 15, 16, and 17 under the 800 nm channel of the FLARE system. No specific in vivo toxicity was found in this dose range.
Fig. 5.

In vitro fluorescence emission changes were measured using the FLARE system with 700 nm and 800 nm filter sets described in Methods. Sodium bicarbonate buffers were used to adjust the pH of media. 10 µM of each BODPY dye was spotted on the Parafilm (A) and their signal intensities were plotted in terms of pH changes in NIR #1 (700 nm) and NIR #2 (800 nm) channels, respectively (B). All NIR fluorescence images have identical exposure times and normalization.
Fig. 6.

Live cell imaging of BODIPY fluorophores in PC3 cells. Sodium bicarbonate buffers were used to adjust the pH of media, and each fluorophore was tested at a concentration of 1 µM. (A) Shown are phase contrast, 700 nm NIR, and 800 nm NIR images at pH 7.8 and pH 9.3 to compare cell accumulation based on the isosbestic point. (B) Fluorescence signals were plotted in terms of pH changes in NIR #1 (700 nm) and NIR #2 (800 nm) channels, respectively. Scale bars = 50 µm. All NIR fluorescence images have identical exposure and normalizations.
Fig. 7.

Biodistribution and clearance of BODIPY fluorophores in mice. 10 nmol of each fluorophore was prepared in D5W containing 5% Cremophor (A) and injected into CD-1 male mice 4 h prior to imaging (B). Abbreviations used are: Bo, bone; Du, duodenum; He, heart; In, intestine; Ki, kidneys; Li, liver; Lu, lungs; LN, lymph node; Mu, muscle; Pa, pancreas; Sp, spleen; and SG, salivary gland. Scale bars = 0.5 cm. All NIR fluorescence images have identical exposure times and normalization.
Conclusions
In conclusion, we prepared and characterized a new series of NIR fluorescent pH indicators with potential to suit a diverse range of analytical applications. pH-sensitive functional aza-BODIPY derivatives were obtained via an effective synthetic route starting from commercially available compounds. The new pH indicators have good brightness and excellent photostability. Variations in the position of hydroxyl functionality allowed manipulation of pKa values over a wide range, providing valuable information that can be used for future rational design of the indicator systems. The new sensors have high potential for a variety of biotechnological, biological, environmental, etc. applications like, monitoring of pH inside certain biological systems specifically in the high pH range in which the sensor responses occur with an advantage of long-duration measurements.
Acknowledgements
We would like to thank Dr Gabor Patonay at Georgia State University for helpful discussions. EAO was supported through a Center for Diagnostics and Therapeutics fellowship at GSU. The authors would also like to acknowledge the Brains and Behavior program at GSU as well as the grant from the National Institute of Health: NIBIB grant #R01-EB-011523, and a grant from the Dana Foundation in Brain and Immuno-Imaging for funding this research.
References
- 1.Lakowicz JR. Principles of Fluorescence Spectroscopy. 3rd edn. New York, NY 10013, USA: 2006. [Google Scholar]
- 2.Haugland RP, et al. The handbook: a guide to fluorescent probes and labeling technologies. 10th edn. Eugene, OR: Molecular Probes; 2005. p. 1126. iv. [Google Scholar]
- 3.Amiot CL, et al. Near-infrared fluorescent materials for sensing of biological targets. Sensors. 2008;8(5):3082–3105. doi: 10.3390/s8053082. [DOI] [PMC free article] [PubMed] [Google Scholar]
- 4.Weissleder R. A clearer vision for in vivo imaging. Nat. Biotechnol. 2001;19(4):316–317. doi: 10.1038/86684. [DOI] [PubMed] [Google Scholar]
- 5.Boens N, Leen V, Dehaen W. Fluorescent indicators based on BODIPY. Chem. Soc. Rev. 2012;41(3):1130–1172. doi: 10.1039/c1cs15132k. [DOI] [PubMed] [Google Scholar]
- 6.Killoran J, et al. Synthesis of BF2 chelates of tetraarylazadipyrromethenes and evidence for their photodynamic therapeutic behaviour. Chem. Commun. 2002;7(17):1862–1863. doi: 10.1039/b204317c. [DOI] [PubMed] [Google Scholar]
- 7.Jiao L, et al. Long wavelength red fluorescent dyes from 3,5-diiodo-BODIPYs. Org. Biomol. Chem. 2010;8(11):2517–2519. doi: 10.1039/c001068e. [DOI] [PubMed] [Google Scholar]
- 8.Han J, Burgess K. Fluorescent indicators for intracellular pH. Chem. Rev. 2010;110(5):2709–2728. doi: 10.1021/cr900249z. [DOI] [PubMed] [Google Scholar]
- 9.Mustroph H, Stollenwerk M, Bressau V. Current developments in optical data storage with organic dyes. Angew. Chem., Int. Ed. Engl. 2006;45(13):2016–2035. doi: 10.1002/anie.200502820. [DOI] [PubMed] [Google Scholar]
- 10.Law KY. Organic Photoconductive Materials – Recent Trends and Developments. Chem. Rev. 1993;93(1):449–486. [Google Scholar]
- 11.Rurack K, Kollmannsberger M, Daub J. Molecular Switching in the Near Infrared (NIR) with a Functionalized Boron–Dipyrromethene Dye. Angew. Chem., Int. Ed. 2001;40(2):385–387. doi: 10.1002/1521-3773(20010119)40:2<385::AID-ANIE385>3.0.CO;2-F. [DOI] [PubMed] [Google Scholar]
- 12.Zen JM, Patonay G. Near-infrared fluorescence probe for pH determination. Anal. Chem. 1991;63(24):2934–2938. [Google Scholar]
- 13.Gomez-Hens A, Aguilar-Caballos MP. Long-wavelength fluorophores: new trends in their analytical use. Trac: Trends in Analytical Chemistry. 2004;23(2):127–136. [Google Scholar]
- 14.Ntziachristos V, et al. Looking and listening to light: the evolution of whole-body photonic imaging. Nat. Biotechnol. 2005;23(3):313–320. doi: 10.1038/nbt1074. [DOI] [PubMed] [Google Scholar]
- 15.Killoran J, et al. A substituted BF2-chelated tetraarylazadipyrromethene as an intrinsic dual chemosensor in the 650–850 nm spectral range. New J. Chem. 2008;32(3):483–489. [Google Scholar]
- 16.Murtagh J, Frimannsson DO, O'Shea DF. Azide conjugatable and pH responsive near-infrared fluorescent imaging probes. Org. Lett. 2009;11(23):5386–5389. doi: 10.1021/ol902140v. [DOI] [PubMed] [Google Scholar]
- 17.McDonnell SO, O'Shea DF. Near-infrared sensing properties of dimethlyamino-substituted BF2-azadipyrromethenes. Org. Lett. 2006;8(16):3493–3496. doi: 10.1021/ol061171x. [DOI] [PubMed] [Google Scholar]
- 18.Jokic T, et al. Highly Photostable Near-Infrared Fluorescent pH Indicators and Sensors Based on BF2-Chelated Tetraarylazadipyrromethene Dyes. Anal. Chem. 2012;84(15):6723–6730. doi: 10.1021/ac3011796. [DOI] [PMC free article] [PubMed] [Google Scholar]
- 19.Freyer W, Mueller S, Teuchner K. Photophysical properties of benzoannelated metal-free phthalocyanines. J. Photochem. Photobiol., A. 2004;163(1–2):231–240. [Google Scholar]
- 20.Choi HS, et al. Rapid translocation of nanoparticles from the lung airspaces to the body. Nat. Biotechnol. 2010;28(12):1300–1303. doi: 10.1038/nbt.1696. [DOI] [PMC free article] [PubMed] [Google Scholar]
- 21.Choi HS, et al. Tissue- and organ-selective biodistribution of NIR fluorescent quantum dots. Nano Lett. 2009;9(6):2354–2359. doi: 10.1021/nl900872r. [DOI] [PMC free article] [PubMed] [Google Scholar]
- 22.Choi HS, et al. Targeted zwitterionic near-infrared fluorophores for improved optical imaging. Nat. Biotechnol. 2013;31(2):148–153. doi: 10.1038/nbt.2468. [DOI] [PMC free article] [PubMed] [Google Scholar]
- 23.Troyan SL, et al. The FLARE intraoperative near-infrared fluorescence imaging system: a first-in-human clinical trial in breast cancer sentinel lymph node mapping. Ann. Surg. Oncol. 2009;16(10):2943–2952. doi: 10.1245/s10434-009-0594-2. [DOI] [PMC free article] [PubMed] [Google Scholar]
- 24.Gioux S, Choi HS, Frangioni JV. Image-guided surgery using invisible near-infrared light: fundamentals of clinical translation. Mol. Imaging. 2010;9(5):237–255. [PMC free article] [PubMed] [Google Scholar]
- 25.Gorman A, et al. In vitro demonstration of the heavy-atom effect for photodynamic therapy. J. Am. Chem. Soc. 2004;126(34):10619–10631. doi: 10.1021/ja047649e. [DOI] [PubMed] [Google Scholar]
- 26.Isaacs NS. Physical Organic Chemistry. 2nd edn. England: Longman Scientific & Technical, Harlow; 1995. [Google Scholar]
- 27.Daffy LM, et al. Arenedicarboximide Building Blocks for Fluorescent Photoinduced Electron Transfer pH Sensors Applicable with Different Media and Communication Wavelengths. Chem.–Eur. J. 1998;4(9):1810–1815. [Google Scholar]
- 28.de Silva AP, et al. Bright molecules with sense, logic, numeracy and utility. Org. Biomol. Chem. 2008;6(14):2468–2480. doi: 10.1039/b802963f. [DOI] [PubMed] [Google Scholar]