Abstract
In 2007 African swine fever (ASF) entered Georgia and in the same year the disease entered the Russian Federation. From 2007 to 2012 ASF spread throughout the southern region of the Russian Federation. At the same time several cases of ASF were detected in the central and northern regions of the Russian Federation, forming a northern cluster of outbreaks in 2011. This northern cluster is of concern because of its proximity to mainland Europe.
The aim of this study was to use details of recorded ASF outbreaks and human and swine population details to estimate the spatial distribution of ASF risk in the southern region of the European part of the Russian Federation. Our model of ASF risk was comprised of two components. The first was an estimate of ASF suitability scores calculated using maximum entropy methods. The second was an estimate of ASF risk as a function of Euclidean distance from index cases.
An exponential distribution fitted to a frequency histogram of the Euclidean distance between consecutive ASF cases had a mean value of 156 km, a distance greater than the surveillance zone radius of 100–150 km stated in the ASF control regulations for the Russian Federation. We show that the spatial and temporal risk of ASF expansion is related to the suitability of the area of potential expansion, which is in turn a function of socio-economic and geographic variables. We propose that the methodology presented in this paper provides a useful tool to optimize surveillance for ASF in affected areas.
Keywords: African swine fever, Spatio-temporal modeling, Risk mapping, Maxent
1. Introduction
African swine fever is a viral disease of wild and domestic pigs. The causative agent of ASF is an Asfivirus, the only member of the Asfarviridae family. ASF is transmitted by direct contact of infected and susceptible pigs or by ingestion of contaminated feed. Ornithodoros ticks can also act as vectors for ASF.
ASF disease is endemic in wild and domestic pigs in most countries of Central and Southern Africa as well as on the islands of Sardinia and Madagascar (FAO, 2007). Large-scale outbreaks of ASF were recorded from 1930 to 1980 in Europe (Spain and Portugal) and Central America (Cuba and the Dominican Republic). The outbreak of ASF that occurred in Spain in 1960 took 35 years to eradicate (Penrith and Vosloo, 2009).
In 2007 ASF entered Georgia and spread throughout the country (Chapman et al., 2011). In the same year the virus entered the Russian Federation. Wild boar were affected initially, with disease spilling over to domestic swine populations in 2008 (FAO, 2008). From 2007 to 2012 ASF spread throughout the southern region of the Russian Federation forming an endemic zone of approximately 600 000 square kilometers. More than 300 outbreaks were identified in domestic swine and wild boar (Sus scrofa) herds within this zone. At the same time several cases of ASF were detected in the central and northern regions of the Russian Federation, forming a northern cluster in 2011. The presence of this northern cluster is of concern because of its proximity to mainland Europe (Costard et al., 2013).
Disease can be acute, sub-acute or, in rare cases, chronic. In the acute form mortality rates are high, approaching 100%. There is no vaccine against ASF and in affected countries ASF outbreaks can have substantial economic impacts arising from the implementation of bans on the transportation of pigs and product associated with pigs in addition to depopulation of affected premises (Anonymous, 1980). In the Russian Federation in 2010 and 2011 it was estimated that the cost of ASF was in the order of 56.8 million Euros (Dudnikov et al., 2012).
Analysis of the sequence of ASF outbreaks in the Russian Federation for the period 2007–2012 has shown that cases occur in close proximity as well as at distances of several hundred kilometers (Gulenkin et al., 2011; Oganesyan et al., 2013; Khomenko et al., 2013). Time intervals between case detection vary from zero to a few weeks. Acknowledging that the spatial and temporal characteristics of ASF spread are dependent on the physical features of an affected area as well as the geographic distribution of the domestic and wild animal populations at risk and the frequency of contact between them, we propose a probabilistic approach for estimating the likely location of subsequent ASF outbreaks following detection of index cases. This provides a method for defining the boundaries of surveillance areas that better reflect the spatial distribution of disease risk at a given point in time. Appropriate surveillance area boundaries increase the likelihood that effective disease control measures will be applied when and where they are required. In turn, this increases the probability that disease control and eradication strategies will be successful.
2. Materials and methods
2.1. Data
Details of the location and date of detection of ASF cases that occurred in the southern region of the European part of the Russian Federation for the period 2007–2012 were provided by Center for Veterinary Medicine (Moscow) and the State Research Institute of Veterinary Virology and Microbiology (Rosselkhoznadzor, 2013).
In the Russian Federation, when a herd manager suspects a case of ASF in wild or domestic pigs he or she notifies the regional veterinary service. A tentative diagnosis of ASF is then made with samples forwarded to the State Research Institute of Veterinary Virology and Microbiology for confirmation. Following conformation the Federal Service for Veterinary and Phytosanitary Surveillance is notified. Notification details include the name of the populated place in which the infected herd is located, an estimate of the total number of animals at risk, the number of animals with clinical signs at the time of diagnosis, the number dead, and the date of onset of clinical signs (if known) and the date on which disease was confirmed. The Federal Service for Veterinary and Phytosanitary Surveillance maintains a database of incident case details including the longitude and latitude of the centroid of the populated place of diagnosis. These details are reported to the Office International des Epizooties (OIE) at regular intervals.
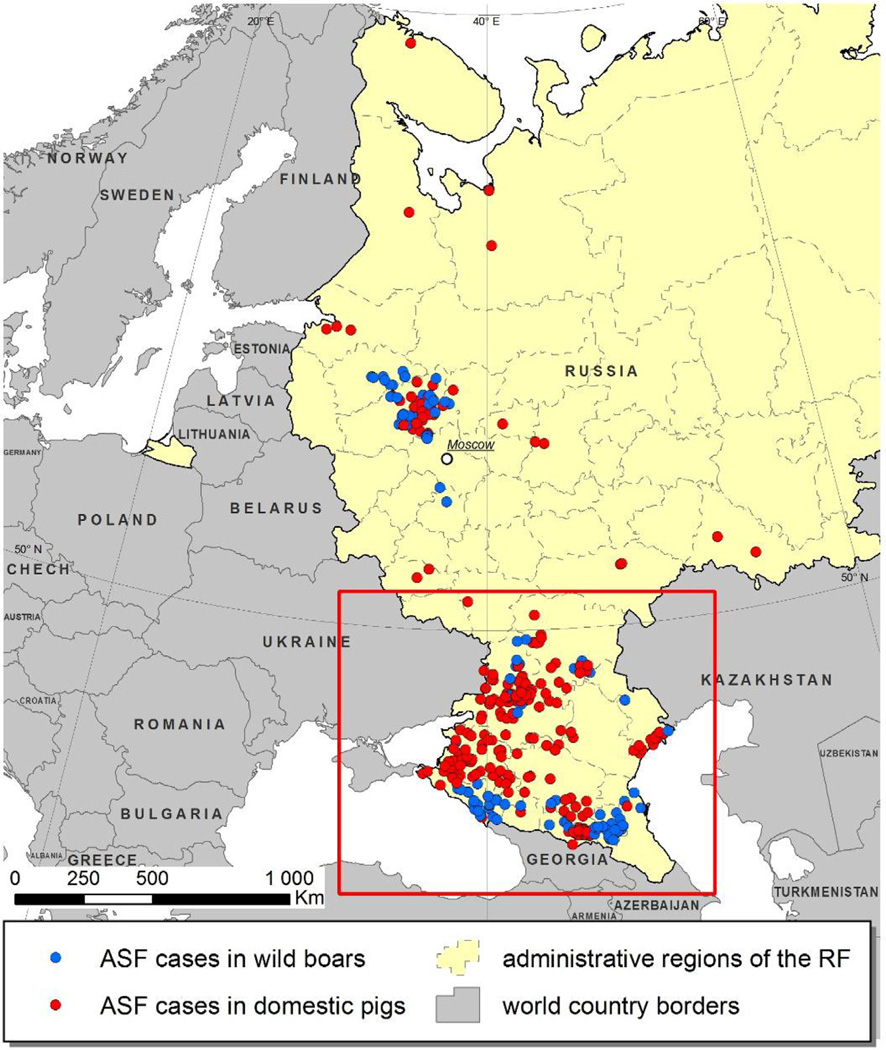
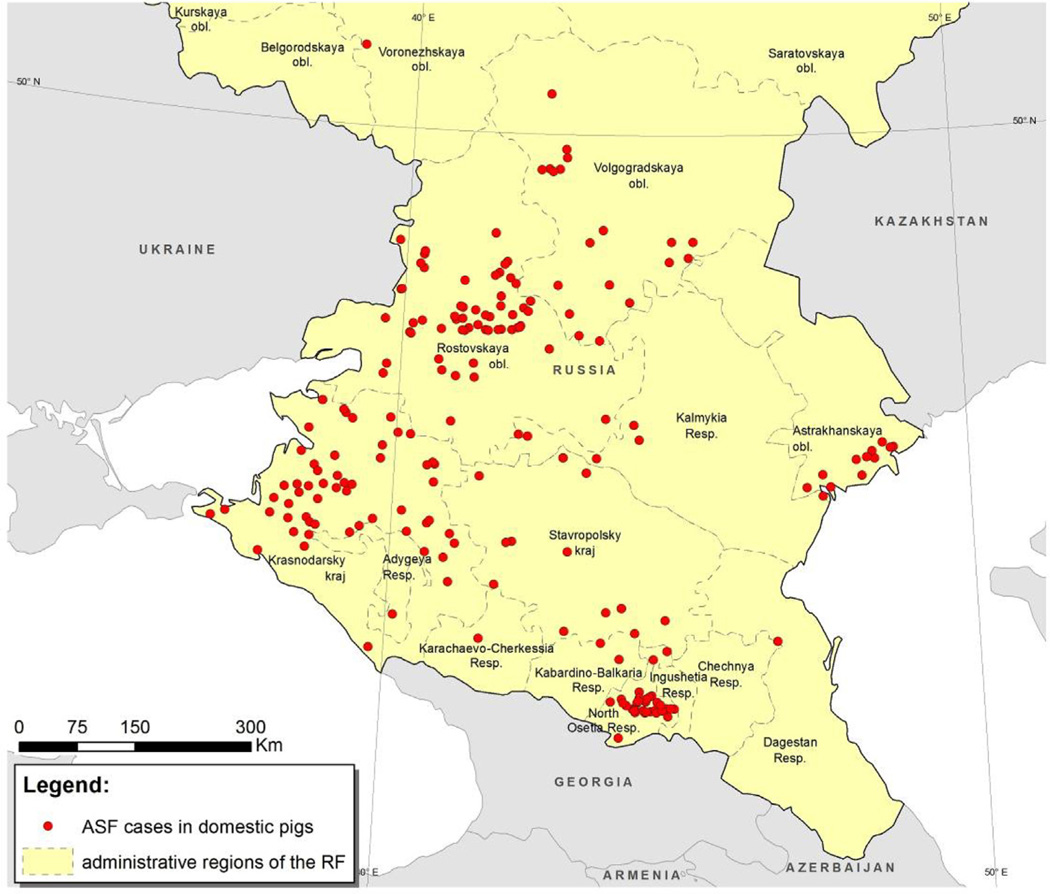
The geographical area of interest for this study was the south European region of the Russian Federation, as shown in Figs. 1 and 2. Incident cases of ASF in domestic pigs identified between 1 January 2007 and 31 December 2012 (n = 211) were selected for analysis.
Fig. 1.
Map of the European part of the Russian Federation showing the location of ASF outbreaks recorded from 1 January 2007 to 31 December 2012. The rectangle delineates the borders of the study area.
Fig. 2.
Map of the south European region of the Russian Federation showing the location of detected ASF outbreaks in domestic pigs, 1 January 2007 to 31 December 2012.
Digital maps of primary and secondary roads and location details of populated places (including cities, urban settlements, rural settlements and villages) within the Russian Federation were obtained from the Environmental Systems Research Institute for the Commonwealth of Independent States (ESRI-CIS, 2014). We assumed that rural settlements and villages were places where privately owned, backyard pig populations were (or had the potential to be) kept. Data on human and domestic pig populations in the Russian Federation were obtained from the Russian Federal State Statistics Service (Federal State Statistics Service, 2013). Human population counts were classified as either urban or rural. Urban populations were assumed to reside in cities and urban settlements whereas rural populations were assumed to reside in villages and rural settlements.
Estimates of the domestic pig population were based data collected by the Federal State Statistics Service (Anonymous, 2013). Domestic pigs were categorized into three main sub-populations: (a) backyard and small-scale enterprises, generally considered to have low biosecurity measures; (b) medium size enterprises, again considered to have low biosecurity measures; and (c) large, state-owned farms with high biosecurity measures (Oganesyan et al., 2013). The location of large, state-owned pig farms were georeferenced using data collected by the National Alliance of Pig Breeders.
2.2. Statistical analyses
Statistical analyses were carried out in two stages. For the first stage a raster map of ASF suitability scores was developed using combinations of geographic and human-animal demographic factors. Based on the findings of Gulenkin et al. (2011) variables hypothesized to be associated with ASF outbreak risk included human population density in rural and urban areas, settlement density, city density, primary and secondary road network density, the density of backyard, medium sized and large, state-owned pig enterprises and total pig population density. Raster maps were developed providing an estimate of the number of individuals (in the case of the human and pig population data) or objects (in the case of settlements, cities, road networks and pig enterprises) per square kilometer using the kernel density estimation function in the Spatial Analyst Toolbox in the Geographic Information System ArcGIS version 10.2 (ESRI, Redlands, CA, USA). Estimates of the number of humans and the number of swine at each point location were assigned to each point location and analyses were carried out using a regular grid of 1000 × 1000 m and a Gaussian kernel of radius (bandwidth) 100 km.
Maximum entropy methods (Phillips et al., 2006; Phillips and Dudik, 2008) were used to create a raster map of ASF suitability scores. Maximum entropy methods have most frequently been used in ecology to model wildlife presence-only data (Elith et al., 2011; Mischler et al., 2012). In an ecological context the technique compares a set of known locations of a particular species of interest against a set of environmental and climatic factors represented by continuous or categorical variables. An output of the model is the probability that a given grid cell will contain the outcome of interest, calculated as a function of the environmental and climatic factors within each cell. Predictive accuracy of the model can be assessed by calculating the area under a receiver operating characteristic curve (Greiner et al., 2000) computed using predictions from the model.
For this application we used maximum entropy methods to model the distribution of ASF-affected locations throughout the study area. Locations of ASF outbreaks in domestic swine in the southern region of the Russian Federation for the period 1 January 2007 to 31 December 2012 were treated as the points of known events (presence data). The raster maps of geographic and human-animal demographic factors described earlier were used as explanatory variables for the model. Analyses were carried out using Maxent version 3.3.3 (Phillips et al., 2006; Phillips and Dudik, 2008).
At the outset, all hypothesized explanatory variables were included in the model. Jackknife statistics were used to quantify the relative contribution of each variable on the estimated probability estimate. Explanatory variables that contributed less than 1% were removed from the model. One hundred Monte Carlo replications were used to obtain means and 95% confidence intervals for response curves characterizing the association between each of the geographic and human-animal demographic factors and the probability of a grid cell being ASF positive. The model was trained by selecting half of the number of points and running the model on the remaining number of observations. Output of the maximum entropy procedure is a raster surface that corresponds to the median probability distribution of ASF outbreaks in the study area, which we term RS.
For the second stage of our analyses, the distributions of Euclidean distances and time intervals between consecutive ASF outbreaks were calculated and plotted as frequency histograms. A parametric probability distribution was fitted to each plot using the BestFit procedure implemented in the spreadsheet add-in @RISK (Palisade Corporation, Ithaca, NY, USA). To model the likely location of future ASF outbreaks we chose the most recent (i.e. the ‘last’) case of ASF in a recorded case series, defining it as the index case. Using the probability distribution of distances we constructed a functional distance surface (termed RD) with the maximum value of 1 at the location of the index case and decreasing to zero as distance from the index case increases. Conditional on a subsequent case of ASF occurring following the identified index case, the RD surface provides an estimate of the likely location of the subsequent case, dependent on proximity to the index case.
To obtain a final risk estimate of ASF (RF) the raster map of ASF suitability scores (RS) was multiplied by the raster map of functional distance estimates (RD):
| (1) |
Internal validation of the model was performed by taking a random sample of 10% of index cases from the dataset comprised of 211 ASF outbreaks. The model was built for each of the selected cases and an RF surface produced. A mean and a 95% confidence interval were calculated for the RF surfaces.
3. Results
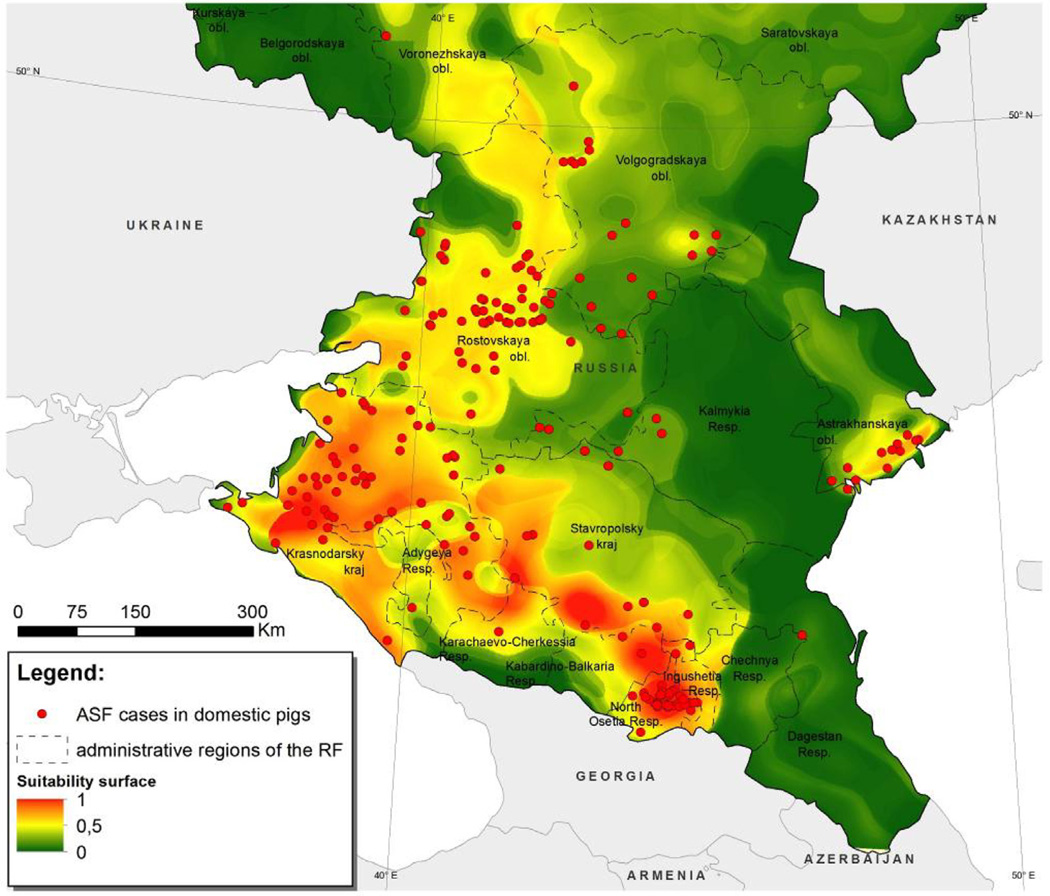
The following explanatory variables explained most of the variation in ASF risk: density of the rural population (59%), pig population density in the low-biosecurity sector (23%), density of rural settlements (15%) and density of secondary roads (4%). In Fig. 3 the estimated suitability surface RS is superimposed over a map of the study region and the point location of ASF outbreaks for the period January 1997 to 31 December 2012. This surface reflects the suitability of a given area for the occurrence of ASF, based on the values of the explanatory variables used to develop the model. Based 100 replications of the data the mean area under the receiver operating characteristic curve was 0.934 with a standard deviation of 0.015.
Fig. 3.
Map of the south European region of the Russian Federation. Superimposed is a raster map of ASF suitability scores.
An exponential distribution was fitted to the frequency distribution of Euclidean distance estimates. A mean of μD = 156 (range 4–576) km provided the best fit to the data. An exponential distribution was fitted to the frequency distribution of time intervals between consecutive outbreaks, with a mean μT = 7.5 (range 0–28) days providing the best fit to the data.
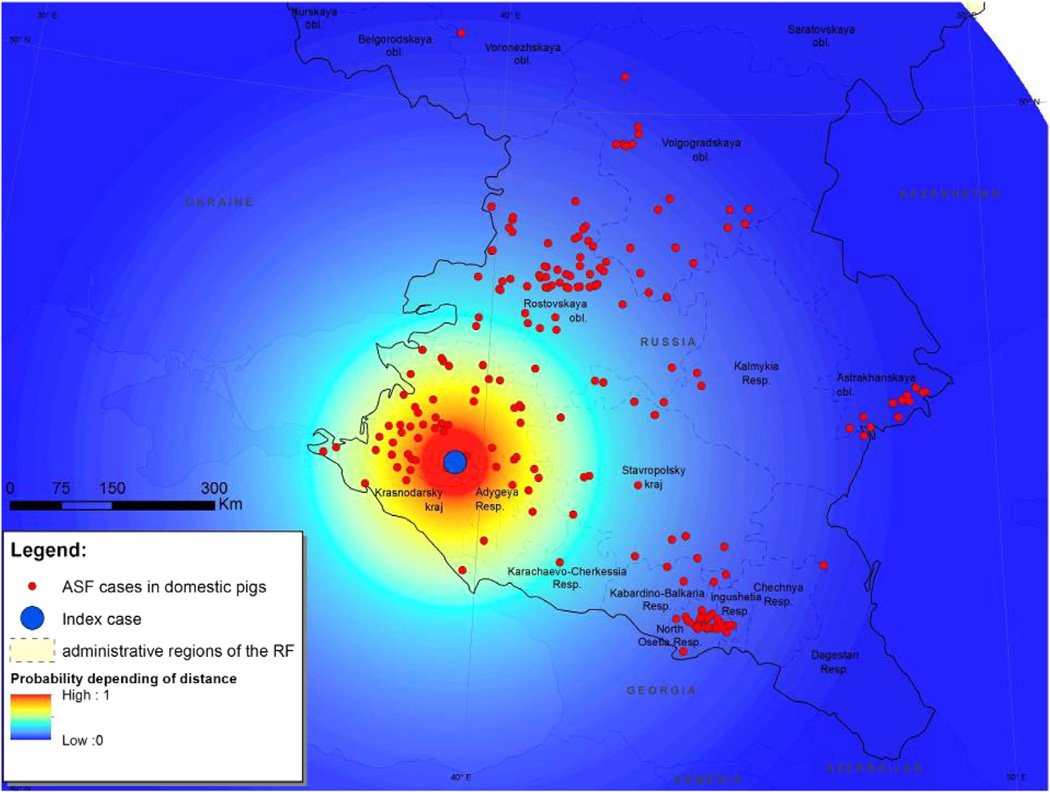
To illustrate our technique the last case in the sequence of recorded ASF cases with the geographical coordinates of 56.91°N and 40.97°E was selected as the index case (Fig. 4). A raster map of functional distance estimates RD = exp(−x/μD) was constructed with the maximum value of one equal to the location of the index case. Here, x represents the distance from the index case (in kilometers) and μD = 156 km. This surface provides a measure of the risk of a new ASF case occurring as a function of distance from the index case (Fig. 4).
Fig. 4.
Map of the south European region of the Russian Federation. Superimposed is a raster map of the functional distance surface, computed using an index case at geographical coordinates of 56.91°N and 40.97°E.
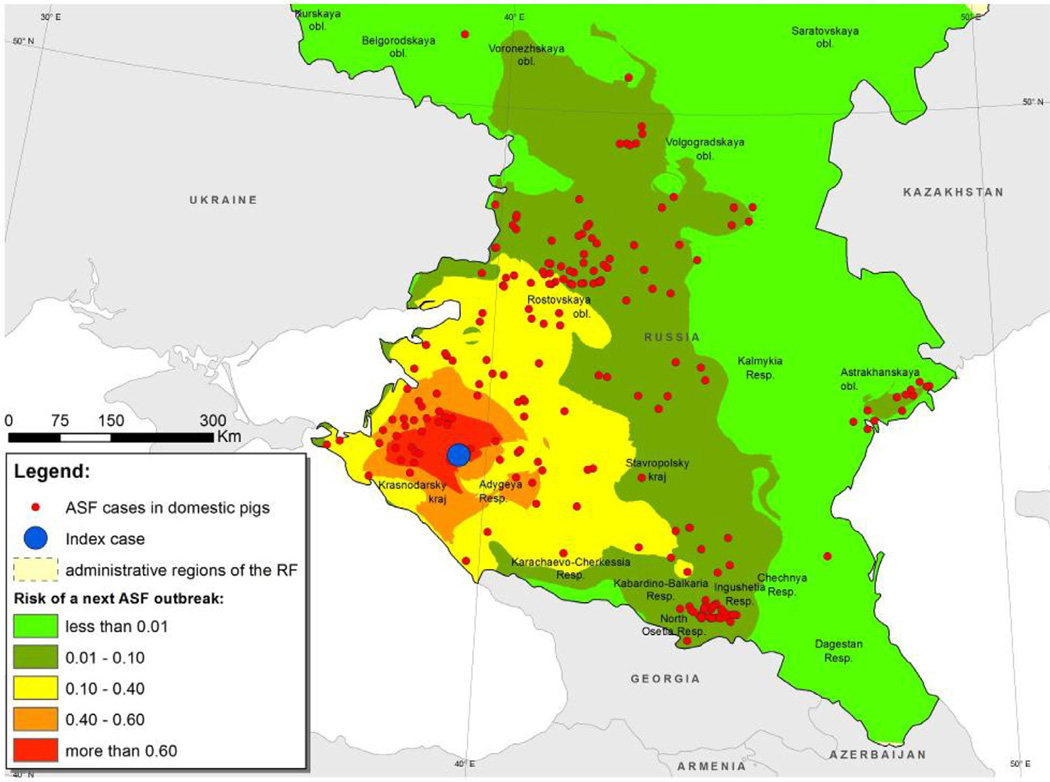
The raster map of final ASF risk (that is, the product of RS and RD) is shown in Fig. 5.
Fig. 5.
Map of the south European region of the Russian Federation. Superimposed is a raster map of estimated ASF risk computed as the product of the raster map of ASF suitability scores (Fig. 3) and the raster map of functional distance (Fig. 4).
The resulting risk surface RF was normalized by dividing all values by the maximum in order to fit the range [0, 1]. This surface shows the spatial distribution of ASF risk at given scales of distance from a prescribed index case.
Validation of the model showed that for 21 randomly selected index cases the next outbreaks occurred in locations with a (relatively high) mean RF value of 0.63 with standard deviance of 0.28.
4. Discussion
The aim of this study was to develop a risk map to provide an indication of the spatial distribution of ASF risk using case details recorded up to a given point in time. In this model the risk of ASF occurrence is the product of two components. The first is an estimate of ASF suitability scores. The second is an estimate of ASF risk as a function of Euclidean distance from the most recent (‘index’) ASF case. The raster map of functional distance estimates was obtained by an analysis of the distribution of Euclidean distances between each two consecutive ASF outbreaks recorded in the Russian Federation during 2007–2012. The resulting mean value of the distribution equal to 156 km (with a 95% confidence interval of 4–576 km) exceeds the conventional radius of surveillance zone set to 100 km. According to the current ASF control regulations in the Russian Federation (Anonymous, 1980) a surveillance zone of between 100 and 150 km should be set up around identified ASF outbreaks. In the usual situation the smaller value is routinely applied. Therefore, from the point of view of preventing virus from escaping from an infected site and ensuring that disease will be promptly detected if it has already spread from that site it is recommended that the veterinary service expand the radius of a surveillance zone to at least 150–160 km.
The average value of the time period between consecutive outbreaks was 7.5 (range 0–28) days suggests that ASF spreads rapidly among a susceptible population at risk. Gulenkin et al. (2011) showed that for an observation period of 15 days the average number of outbreaks varied from 2.25 to 2.83, which agrees with our data. It should be noted that often there is uncertainty in terms of the accuracy of the onset date of clinical signs with the presence of disease reported to authorities days or even weeks after the actual start of the outbreak (Oganesyan et al., 2013). This being the case, it is likely that the dates of onset reported in this study are, on average, overestimated and inferences should therefore be made using the 25th quantile of the time between consecutive outbreaks, instead of the median.
The raster map of ASF suitability scores was based on the distribution of the rural population and agricultural activities carried out by those populations. This approach provides a means for delineating the spatial distribution of the population at risk that is not possible using a simple ring-based techniques.
We can point to a number of constraints to the analytical approach presented in this paper. First, modeling was carried out using only those ASF cases identified in the south European region of the Russian Federation for the period 2007–2012. At the time the model was developed the number of cases in the central and northern regions of the Russian Federation were insufficient to develop reliable estimates of case-case distances. We caution that while the approach presented in this paper provides a rational methodology for estimating risk in the region in which data were collected, application of the model to regions outside of the study area of interest may lead to incorrect inferences.
Second, our model does not account for wild boar as a means for transmission of virus between domestic pig enterprises. We acknowledge that wild boar are likely to have an important impact on disease spread and an improvement to our methodology would be to include estimates of the spatial distribution of wild boar as an input for the maximum entropy model. Finally, while the agricultural census data provided a reasonable proxy for the swine population at risk precise details of the location of the domestic pig population in the south European region of the Russian Federation were not available for analysis. Similar to most developed countries, agricultural census details in the Russian Federation are collected at the individual enterprise level and livestock counts are aggregated (for reporting) to the district and/or regional level. It makes sense that census authorities should ensure that individual enterprise count and location details are recorded and stored, to better inform the models presented in this paper.
In conclusion, we show that the spatial and temporal risk of ASF expansion is related to the suitability of the area of potential expansion, which is in turn a function of socioeconomic and geographic variables. We propose that the methodology presented in this paper provides a useful tool to optimize surveillance for ASF in affected areas.
Acknowledgements
The authors thank: (1) the staff of the GIS department of the Louisiana Department of Wildlife and Fisheries in Baton Rouge, Louisiana, USA, particularly Dr. James LaCour, Dr. Brad Mooney and Dr. Scott P. Armand; and (2) the staff of the Centers for Epidemiology and Animal Health of USDA APHIS in Fort Collins, Colorado, USA, particularly Dr. Jerome E. Freier and Dr. Priscilla L. FitzMaurice.
Footnotes
Conflict of interest statement
None of the authors has any financial or personal relationships that could inappropriately influence or bias the content of this paper.
References
- Anonymous. Instruction on Prevention and Eradication of ASF. Moscow, Soviet Union (in Russian): General Office of Veterinary, Ministry of Agriculture; 1980. [Google Scholar]
- Anonymous. Federal State Statistics Service of the Russian Federation. [Accessed 24 January 2014];2013 URL: < http://www.gks.ru/wps/wcm/connect/rosstat_main/rosstat/en/main/>. [Google Scholar]
- Chapman DAG, Darby AC, Da Silva M, Upton C, Radford AD, Dixon LK. Genomic analysis of highly virulent Georgia 2007/1 isolate of African swine fever virus. Emerging Infectious Diseases. 2011 Apr;17(4) doi: 10.3201/eid1704.101283. (available at < http://dx/doi.org/10.3201/eid1704.101283>). [DOI] [PMC free article] [PubMed] [Google Scholar]
- Costard S, Mur L, Lubroth J, Sanchez-Vizcaino J, Pfeiffer D. Epidemiology of African swine fever virus. Virus Res. 2013;173:191–197. doi: 10.1016/j.virusres.2012.10.030. [DOI] [PubMed] [Google Scholar]
- Dudnikov SA, Korennoy FI, Gulenkin VM, Petrova ON. African swine fever in the Russian Federation: geo-spatial analysis and evaluation of the economic impact; Proceedings of the 13th International Symposium on Veterinary Epidemiology and Economics; 2012. ISVEE 13. [Google Scholar]
- Elith J, Phillips SJ, Hastie T, Dudik M, Chee YE, Yates CJ. A statistical explanation of MaxEnt for ecologists. Divers Distrib. 2011;17:43–57. [Google Scholar]
- Environmental Systems Research Institute for the Commonwealth of Independent States (ESRI-CIS) [Accessed 24 January 2014]; URL: < http://esri-cis.ru>. [Google Scholar]
- Gulenkin VM, Korennoy FI, Karaulov AK, Dudnikov SA. Cartographical analysis of African swine fever outbreaks in the territory of the Russian Federation and computer modeling of basic reproduction ratio. Prev Vet Med. 2011;102:167–174. doi: 10.1016/j.prevetmed.2011.07.004. [DOI] [PubMed] [Google Scholar]
- FAO. Empres Watch. [Accessed 24 January 2014];African swine fever in Georgia. 2007 URL: < ftp://ftp.fao.org/docrep/fao/011/aj217e/aj217e00.pdf>. [Google Scholar]
- FAO. Empres Watch. [Accessed 24 January 2014];African swine fever in the Caucasus. 2008 URL: < ftp://ftp.fao.org/docrep/fao/011/aj214e/aj214e00.pdf>. [Google Scholar]
- Greiner M, Pfeiffer D, Smith R. Principles and practical application of the receiver-operating characteristic analysis for diagnostic tests. Prev Vet Med. 2000;45:23–41. doi: 10.1016/s0167-5877(00)00115-x. [DOI] [PubMed] [Google Scholar]
- Khomenko S, Beltran-Alcrudo D, Rozstalnyy A, Gogin A, Kolbasov D, Pinto J, Lubroth J, Martin V. African swine fever in the Russian Fereration: risk factors for Europe and beyond. FAO, Empres Watch. 2013;28 [Google Scholar]
- Penrith M-L, Vosloo W. Review of African swine fever: transmission, spread and control. J South Afr Vet Assoc. 2009;80:58–62. doi: 10.4102/jsava.v80i2.172. [DOI] [PubMed] [Google Scholar]
- Mischler P, Kearney M, McCarroll JC, Scholte RGC, Vounatsou P, Malone JB. Environmental and socio-economic risk modelling for Chagas disease in Bolivia. Geospatial Health. 2012;6:S59–S66. doi: 10.4081/gh.2012.123. [DOI] [PubMed] [Google Scholar]
- Oganesyan AS, Petrova ON, Korennoy FI, Bardina NS, Gogin AE, Dudnikov SA. African swine fever in the Russian Federation: spatio-temporal analysis and epidemiological overview. Virus Res. 2013;173:204–211. doi: 10.1016/j.virusres.2012.12.009. [DOI] [PubMed] [Google Scholar]
- Phillips SJ, Anderson RP, Schapire RE. Maximum entropy modeling of species geographic distributions. Ecol Modell. 2006;190:231–259. [Google Scholar]
- Phillips SJ, Dudik M. Modeling of species distributions with Maxent: new extensions and a comprehensive evaluation. Ecography. 2008;31:161–175. [Google Scholar]
- Rosselkhoznadzor Current epidemic situation on ASF in Russia, Federal Service for Veterinary and Phytosanitary Surveillance. [Accessed 24 January 2014];2013 URL: < http://www.fsvps.ru/fsvps/asf>. [Google Scholar]


