Abstract
Medical imaging systems are composed of a large number of position sensitive radiation detectors to provide high resolution imaging. For example, whole-body Positron Emission Tomography (PET) systems are typically composed of thousands of scintillation crystal elements, which are coupled to photosensors. Thus, PET systems greatly benefit from methods to reduce the number of data acquisition channels, in order to reduce the system development cost and complexity. In this paper we present an electrical delay line multiplexing scheme that can significantly reduce the number of readout channels, while preserving the signal integrity required for good time resolution performance. We experimented with two 4 × 4 LYSO crystal arrays, with crystal elements having 3 mm × 3 mm × 5 mm and 3 mm × 3 mm × 20 mm dimensions, coupled to 16 Hamamatsu MPPC S10931-050P SiPM elements. Results show that each crystal could be accurately identified, even in the presence of scintillation light sharing and inter-crystal Compton scatter among neighboring crystal elements. The multiplexing configuration degraded the coincidence timing resolution from ~ 243 ps FWHM to ~272 ps FWHM when 16 SiPM signals were combined into a single channel for the 4 × 4 LYSO crystal array with 3 mm × 3 mm × 20 mm crystal element dimensions, in coincidence with a 3 mm × 3 mm × 5 mm LYSO crystal pixel. The method is exible to allow multiplexing configurations across different block detectors, and is scalable to an entire ring of detectors.
Keywords: radiation detectors, multiplexing, time-of-flight (TOF), positron emission tomography (PET)
1. Introduction
With the recent introduction of silicon photomultiplier (SiPM) photosensors [Antich et al., 1997, Bondarenko et al., 2000, Britvitch et al., 2007, Golovin and Saveliev, 2004, Herbert et al., 2007, McElroy et al., 2007, Musienko et al., 2007, Renker, 2007, Yamamoto et al., 2006] - which are much more compact than conventional photomultipliers (PMTs) and insensitive to magnetic fields (for PET-MRI integrated systems) - each scintillation crystal element can individually be coupled to a SiPM without a light guide between the crystals and SiPMs. This maximizes scintillation light signal per SiPM channel, since there is no scintillation light spreading through a light guide (unlike in many PMT-block detector designs). It has been shown that very good timing resolution can be obtained with these SiPMs coupled to individual crystals (see for example [Yeom et al., 2013a, Schaart et al., 2010, Gundacker et al., 2014, Vinke et al., 2009a]), resulting in tomo-graphic images with a high signal-to-noise ratio in whole-body time-of-flight PET. PET systems based on these SiPMs greatly benefit from methods to reduce the number of data acquisition channels, while preserving the signal-to-noise ratio (SNR) required for that timing performance, such that the cost and complexity can be kept at a minimum.
Traditional multiplexing methods are often based on resistor networks, whereby the amplitude of the signal outputs encode the photosensor [Popov et al., 2001, Olcott et al., 2005]. However, such an approach often reduces SNR and slows the pulse down, resulting in time resolution degradation.
Delay lines were introduced for enabling position detection in micro-channel plate (MCP) detectors [Keller et al., 1987]. Further, a delay line encoding method was introduced to optically multiplex signals from the comparator outputs of pulsed mode radiation detectors [Grant and Levin, 2014, Grant and Levin, 2013].
In this paper, we present an electrical delay line encoding scheme to multiplex the analog signals of pulsed mode radiation detectors. This method can significantly reduce the number of readout channels, while the signal integrity is preserved for good timing performance. Although we prototype the idea with cables, there are convenient chip-based delay element solutions available to enable system-level scale up of the concept. It is presented in the context of SiPM light sensors in (time-of-flight) PET, although it could be applied to any system employing pulsed mode radiation detectors or light sensors.
2. Theory: Timing uncertainty associated with electronic noise
When analog signals from various channels I1, I2, . . ., In are combined (summed) in output channel O, O will not only contain the signal contribution from each input channel, but also the electronic noise contribution from each input channel. Multiplexing SiPM signals in PET detectors will thus generally increase the noise content in the readout channels and thus degrade the timing performance. From fundamental signal theory it is known that the timing uncertainty associated with electronic noise σt is given by [Wilmshurst, 1985]
| (1) |
where σv is the RMS noise voltage and dv=dt the slope of the signal rising edge at the trigger level. Note that Eq. 1 only contains the timing uncertainty associated with electronic noise, and not the timing uncertainties associated with other parameters, such as scintillation rise and decay time, scintillation yield, photosensor photon detection efficiency (PDE), and photosensor transit time spread (TTS). Methods to calculate the timing resolution bounds from the latter parameters can be found in [Vinke et al., 2014, Seifert et al., 2012].
3. Materials and Methods
3.1. Electrical delay line multiplexing method
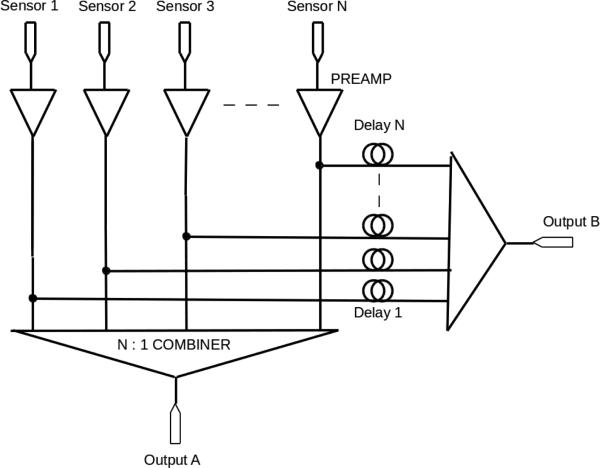
See Fig. 1 for a schematical diagram of the delay line multiplexing method. Each SiPM light sensor is connected to a preamplifier, whereby each preamplifier provides a 50 Ohm (or lower) input impedance to the SiPM, thereby shielding the internal SiPM capacitance from any high-impedance elements or other capacitive elements in subsequent electronic stages. This means that there is minimum RC signal shaping, such that the noise over slope ratio in Eq. 1 is preserved for optimal timing performance. In addition, the preamplifiers amplify the SiPM signals before any electronic noise is included from the subsequent multiplexing and readout electronics, thus minimizing the time uncertainty associated with the noise from these later stages (see also Eq. 1).
Figure 1.
Delay line multiplexing for N sensors, featuring 2-branch splitting.
After each preamplifier, a 1 : 2 splitter produces two identical signal branches. One signal branch of each splitter is sent to an N : 1 combiner (i.e. summer), which produces the first multiplexed signal output (Hereby, N is the number of SiPM sensors). The other signal branch of each splitter is sent to a separate N : 1 combiner, but with the difference that the cable (or trace on a PCB), that transports the signal towards the combiner, has a different length for each channel (or connects to a dedicated active or passive delay element before the N : 1 combiner). This produces the second multiplexed signal output. Signals propagate through the cables with a speed equal to v = c/εr, where c is the light speed and εr the relative permittivity of the cable. This implies that the propagation time towards the second combiner is different for each channel. The arrival time difference between the two multiplexed output signals will thus identify the SiPM element which registered a scintillation event.
Note that in this signal divider configuration no resistive or capacitive elements are used that could change the pulse shape. Only splitter elements are used, which can be chosen to have 50 Ohm input and output impedance, such that there is no impedance mismatch at any point in the circuit. The signal integrity is thus preserved for optimal timing performance.
Instead of splitting each preamplifier signal into two branches, it could also be splitted into more (M) branches, whereby each signal branch features a certain delay. The splitted signal branches from the various SiPM sensors are subsequently combined into M combiners. Each SiPM sensor is then identified by a unique time difference pattern: {t2 − t1, − t3 − t1, . . . , tM − t1}. Here, t1, t2, . . . , tM indicate the pulse arrival times at the outputs of the M summers. The higher branching ratio reduces the maximum delay that is needed to multiplex a large number of sensors.
3.2. Experimental setup
For proof-of-concept, 4 SiPM sensors at a time were multiplexed for the LYSO crystal array with 3 mm × 3 mm × 5 mm crystal elements. The experimental setup for these measurements is described in section 3.2.1. In a second series of measurements, 16 SiPM sensors were multiplexed for the LYSO crystal array with 3 mm × 3 mm × 20 mm crystal elements. The experimental setup for the latter measurements is described in section 3.2.2
3.2.1. 4 channel delay line multiplexing with 3 mm × 3 mm × 5 mm LYSO crystal elements
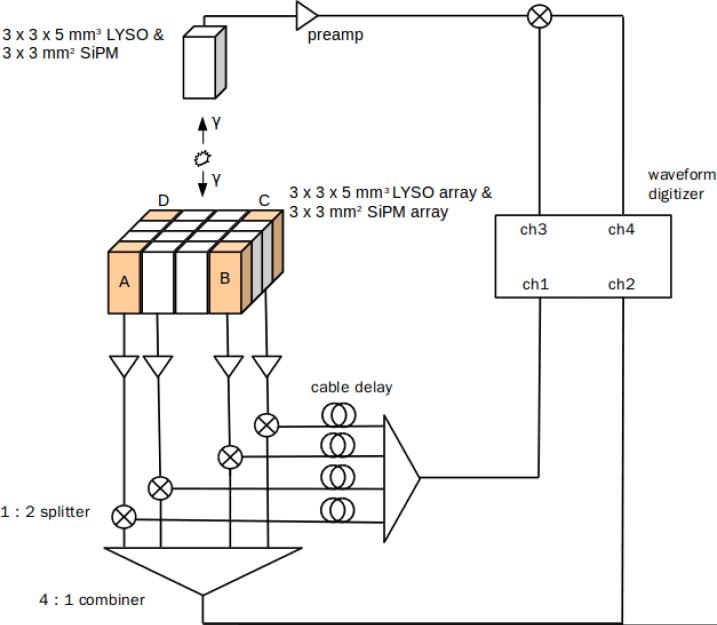
Fig. 2 shows a schematical diagram of the experimental setup for the 4 channel multiplexing configuration. A 4 × 4 SiPM array from tiled 3 mm × 3 mm SiPMs (Hamamatsu MPPC S10931-050P) was coupled to a 4 × 4 LYSO crystal array (Agile Technologies) using optical grease (Bicron BC-630), with each LYSO element having a 3 mm × 3 mm × 5 mm dimension, polished surfaces, and ESR reflectors on all faces. Each of the SiPM elements was connected to a preamplifier: a wideband (DC -2 GHz) RF amplifier (Mini-Circuits MAR-3SM+) with a low noise figure (~3.7 dB at 1 GHz) and gain of ~12 dB, with a 50 Ohm input and output impedance. This 4 × 4 SiPM array detector and front-end electronics were earlier described in more detail in [Yeom et al., 2013b].
Figure 2.
Schematical diagram of the used delay line multiplexing topology in the experimental setup of section 3.2.1 with 5 mm LYSO crystal length. The 4 corner SiPM configuration is shown.
The signals from 4 SiPM elements were used for the delay line multiplexing method. The 1 : 2 power splitter (Mini-Circuits ADP-2-4) after each of the 4 corresponding preamplifiers had a 10 - 1000 MHz bandwidth and a 3.4 dB insertion loss (3.0 dB inherent loss for a 1 : 2 splitter plus ~0.4 dB insertion loss for this specific device). One branch of each 1 : 2 splitter was sent with constant-length coaxial cables to a 4 : 1 power combiner (Mini-Circuits ZFSC-4-1-BNC+), with 1 -1000 MHz bandwidth and 6.6 dB insertion loss (6.0 dB inherent loss for a 4 : 1 combiner plus ~0.6 dB insertion loss for this specific device). The other branch of each 1 : 2 splitter was sent with varying-length coaxial cables to another 4 : 1 Mini-Circuits power combiner.
In a first configuration, the 4 corner SiPM elements (see Fig. 2) were connected to the multiplexing stage. In a second configuration, the 4 center SiPM elements were connected. Since the amount of scintillation light sharing among multiple SiPM elements (due to light leaking through the reflective crystal wrappings, as well as light spreading through the optical grease towards other SiPM elements) and inter-crystal Compton scattering may be substantial for neighboring crystal elements, this might complicate the SiPM identi cation task. It is noteworthy at this stage to mention that the delay line multiplexing method is not confined to multiplexing neighboring SiPM elements in a single block detector. The method could also be applied to multiplex SiPM elements across different block detectors, if light sharing among neighboring SiPM elements complicates the SiPM identi cation. A Ge-68 positron source provided 511 keV annihilation photons, uniformly illuminating the LYSO crystal array. The output pulses of the power combiners were sent to a waveform digitizer (Agilent DSO90254A), with 2.5 GHz bandwidth, 20 GS/s sampling rate for each channel, 8 bit voltage resolution, and 183 μ V RMS electronic noise floor at 80 mV dynamic range. SiPM identi cation was performed by measuring the arrival time difference between the output pulses from the power combiners (at ch1 and ch2 in Fig. 2).
For performing coincidence timing measurements, the multiplexed crystal array detector was placed in coincidence mode with a reference detector consisting of a single 3 mm × 3 mm × 5 mm LYSO crystal element coupled to a single 3 mm × 3 mm SiPM (Hamamatsu MPPC S10931-050P). This SiPM was also connected to a Mini-Circuits MAR-3SM+ amplifier. The output of this amplifier was sent to another 1 : 2 power splitter. The branches of this splitter were connected to acquisition channels ch3 and ch4 of the waveform digitizer (see section 3.3 for the reason of splitting the signal from the reference detector).
3.2.2. 16 channel delay line multiplexing with 3 mm × 3 mm 20 mm LYSO crystal elements
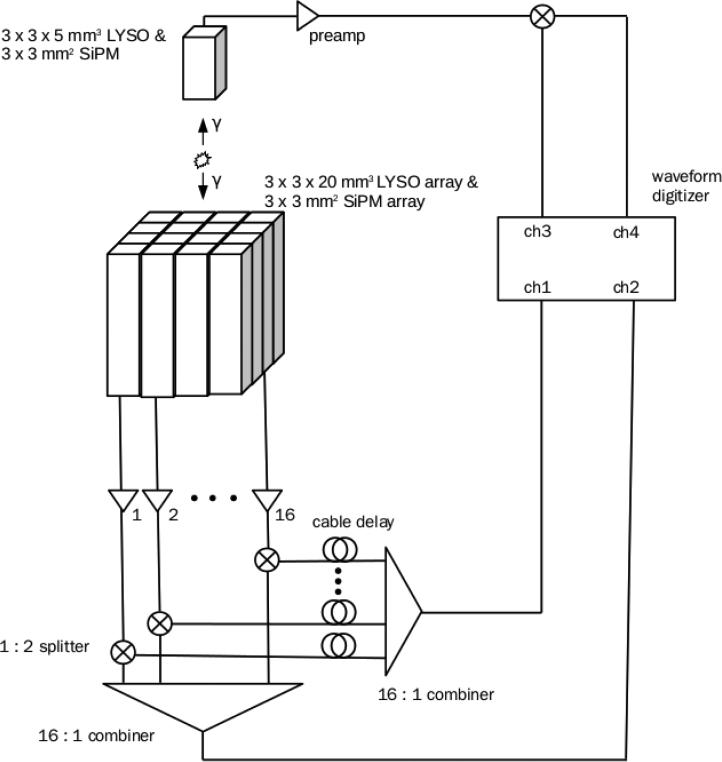
In a second series of measurements, all 16 SiPM elements of the SiPM array in section 3.2.1 were multiplexed (instead of 4 at a time), see Fig. 3. In addition, a 4 × 4 LYSO crystal array (Agile Technologies) was used, with each LYSO element having a clinical PET relevant dimension of 3 mm × 3 mm × 20 mm (i.e. with a 20 mm crystal length instead of the 5 mm in section 3.2.1). As in section 3.2.1, the crystal elements had polished surfaces, ESR reflectors on all faces, and were coupled to the SiPM array using Bicron BC-630 optical grease.
Figure 3.
Schematical diagram of the used delay line multiplexing topology in the experimental setup of section 3.2.2 with 20 mm LYSO crystal length.
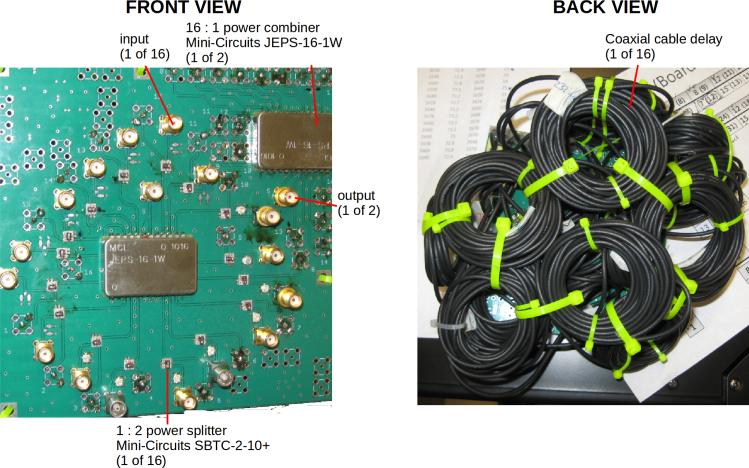
As in section 3.2.1, each of the 16 SiPM elements was connected to a Mini-Circuits MAR-3SM+ preamplifier. Each preamplifier was connected to a 1 : 2 power splitter (Mini-Circuits SBTC-2-10+), with a 5 - 1000 MHz bandwidth and 3.3 dB insertion loss (3.0 dB inherent loss for a 1 : 2 splitter plus ~0.3 dB insertion loss for this specific device). One branch of each splitter was sent with constant-length PCB traces to a 16 : 1 power combiner (Mini-Circuits JEPS-16-1W), with 5 - 1000 MHz bandwidth and ~13.5 dB insertion loss (12.0 dB inherent loss for a 16 : 1 combiner plus ~1.5 dB insertion loss for this specific device). The other branch of each splitter was sent with varying-length coaxial cables to another JEPS-16-1W power combiner. The coaxial cables were chosen to have ~40 cm length increments among the different channels, roughly corresponding to 2 ns signal delay increments: {l1 ≈ 40 cm, l2 ≈ 80 cm, . . ., l16 ≈ 640 cm}. A picture of the PCB containing the power splitters, combiners, and coaxial cables is shown in Fig. 4.
Figure 4.
Picture of the PCB containing the delay line multiplexing elements. Left figure shows the front view. Right figure shows the back view with the delay cables.
A Na-22 source provided 511 keV annihilation photons. The output pulses of the power combiners were sent to the same waveform digitizer as in section 3.2.1. The output pulses were processed in singles mode as well as in coincidence mode operation with the reference detector mentioned in section 3.2.1. For the coincidence mode operation, the Na-22 source was placed close (few mm distance) to the multiplexed array detector, while the reference detector was placed at a large distance (~200 mm) to the Na-22 source at the opposite side. By only taking coincidence events into account, the 511 keV annihilation photon beam is electronically collimated with a small spot size on the array detector. The photon beam was oriented on a single crystal element of the multiplexed array detector at a time, and SiPM identi cation was performed by measuring the arrival time difference between the output pulses from the power combiners.
3.3. Coincidence timing methods
For the coincidence timing measurements, the dynamic range for ch3 in Figs. 2 and 3 (’energy channel’ for the reference detector) was set such that the complete voltage range of the input pulses were captured. In this way, the amplitude of each pulse could be measured, such that the energy spectra could be determined and the Compton background could be filtered out for the coincidence timing measurements. The dynamic range for ch4 (’timing channel’ for the reference detector) was set to a low level of 80 mV such that the input pulses clipped in the voltage range, and only the intial part of the rising edge of the pulses was captured. This was done, as the quantization noise as well as the digitizer electronic noise floor (σv in Eq. 1) decrease when the dynamic range of the digitizer is lowered, such that an optimal time pickoff can be performed. In the same way, the dynamic range was set to capture the complete voltage range of pulses from acquisition channel ch1 (connected to the multiplexed signal output featuring varying cable delays), while it was set to 80 mV for ch2 (connected to the multiplexed signal output featuring constant cable delays). The time pickoff for the multiplexed array detector was then done on ch2, while the energy content was determined from ch1. Since there is no variation in signal delays on the multiplexed signal output connected to ch2, the signal will not be swept across the delay range (as is the case for ch1, see the right plot in Fig. 6) in case multiple SiPMs re during a scintillation event (e.g. during inter-crystal Compton scattering), such that the timing trigger can be set at a low level.
Figure 6.
Persistence plot of rising edge for ch1 for the 4 corner SiPM multiplexing configuration (left graph) and the 4 center SiPM multiplexing configuration (right graph), with 5 mm LYSO crystal length. Each trace was aligned with respect to a 35 mV LE trigger above baseline on ch2. Colors indicate the identified SiPMs according to the ch1 - ch2 time difference, see Fig. 7. The ~60 mV voltage range in these figures corresponds to ~19% of the signal amplitude.
For the coincidence timing measurements, only 511 keV photopeak events were taken into account, whereby the pulse energies were determined from the signals at ’energy channels’ ch1 and ch3 of the waveform digitizer. The bias voltages for all 16 SiPM sensors of the multiplexed array detector were turned on, such that a pulse signal arriving at ’timing channel’ ch2 of the waveform digitizer contained the electronic noise and dark counts originating from each of the 16 individual SiPM sensors. The experimental configuration for this measurement will be referred to as ’config. A’ further on in this paper.
For determining to which extent the proposed multiplexing topology deteriorates the timing performance for time-of-flight PET, two reference measurements were run. In one reference measurement, the bias voltage was turned on for only a single SiPM at a time of the multiplexed array detector, such that the other 15 SiPMs did not produce any signal. In this way, the timing degradation due to noise accumulation from several SiPMs could be evaluated. The configuration for this reference measurement will be referred to as ’config. B’ further on in this paper.
In the other reference measurement, the preamplifier output signal of the powered SiPM was splitted with a 1 : 2 power splitter, whereby the two output branches were directly connected to the waveform digitizer, like in the reference detector configuration. The 16 : 1 power combiners with the associated ~13.5 dB insertion loss (see section 3.2.2) were thus essentially removed for this reference measurement, such that the output pulses had a roughly 4 times higher amplitude. This means that the timing uncertainty associated with the quantization and electronic noise from the waveform digitzer was smaller due to the higher signal slope (see section 2 and Eq. 1). The configuration for this reference measurement will be referred to as ’config. C’ further on in this paper.
Configs. B and C thus allowed the evaluation of the timing degradation associated with the insertion loss of the power combiner. Since the power combiner (as well as the power splitters and preamplifiers) had a 50 Ohm input and output impedance, we expect that no pulse shape changes are introduced at the power combiner stage that might otherwise also degrade the timing performance. Further, as the power combiner is built from capacitive and inductive elements only, no resistor noise is introduced that might otherwise also affect the timing performance. We therefore expect that any time resolution difference between the first (config. B) and second (config. C) reference measurement would be caused by the difference in pulse amplitude.
For all the timing measurements (including the reference measurements), the dynamic range of the waveform digitizer was set at 80 mV for the acquisition channels at which the time pickoff was performed. The digitizer quantization and electronic noise was thus kept constant for all timing measurements. The coincidence timing resolutions were determined from a Gaussian t of the time difference spectra.
3.4. Digital time pickoff method
The scintillation pulse arrival times were determined using the digital time pickoff algorithm described in [Vinke et al., 2009b]. For completeness, the algorithm is detailed in this section as well. The detector signals were recovered from the sampled waveforms by cubic spline interpolation. Subsequently, the baseline was determined for each signal by an averaging procedure right before the onset of the pulse rising edge using a small time window of 500 ps, see Fig. 5. The onset of the time window t1 was set for each pulse relative to the time t2 at which the pulse crossed a certain threshold V2, such that t2 − t1 is constant for each pulse. Leading edge time pickoff was then performed on the interpolated signal with a constant trigger level relative to the determined baseline.
Figure 5.
Time pickoff on scintillation pulse. The right figure is a zoomed-in version of the left figure.
The baseline determination procedure is critical for optimizing the timing performance with SiPM based scintillation detectors. By determining the baseline right before the onset of the scintillation pulse, baseline uctuations induced by SiPM dark counts during this time window are accounted for, such that these dark counts have a minimal effect on the scintillation pulse trigger levels. Effectively, the scintillation pulse is disentangled from its preceding dark count. For the coincidence timing measurements, t2 − t1 and the trigger level relative to the baseline were varied for each measurement set, such that the optimal timing resolution could be obtained.
4. Results
4.1. SiPM identification - 4 channel multiplexing configuration with 5 mm LYSO crystal length
Fig. 6 shows a persistence plot of the rising edge for the output channel featuring varying-length cables (ch1) for the 4 channel multiplexed array detector with 5 mm LYSO crystal length, described in section 3.2.1. Each trace was aligned with respect to a leading-edge (LE) trigger on the output channel with constant-length cables (ch2).
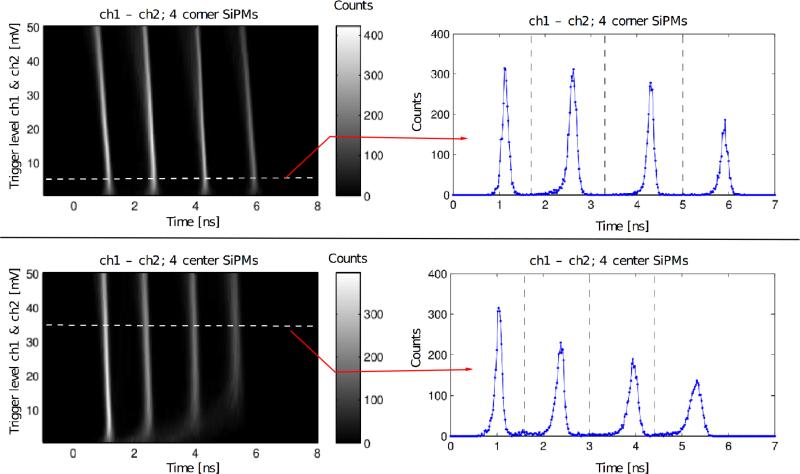
Fig. 7 shows the ch1 - ch2 time difference spectra as a function of LE trigger level on ch1 and ch2. Note that these are not coincidence spectra - as they are formed from the two signals of the array detector only - and are only used for SiPM identification in the array detector.
Figure 7.
ch1 - ch2 time difference spectra for the 4 corner SiPM multiplexing configuration (top left graph) and the 4 center SiPM multiplexing configuration (bottom left graph) with 5 mm LYSO crystal length, at various leading edge (LE) trigger levels for ch1 and ch2. The top right graph indicates the ch1 - ch2 time difference spectrum at 5 mV above baseline for the 4 corner SiPM multiplexing configuration. The bottom right graph indicates the ch1 - ch2 time difference spectrum at 35 mV above baseline for the 4 center SiPM multiplexing configuration. The white dashed lines in the left graphs indicate the 5 mV and 35 mV trigger levels corresponding to the right graphs.
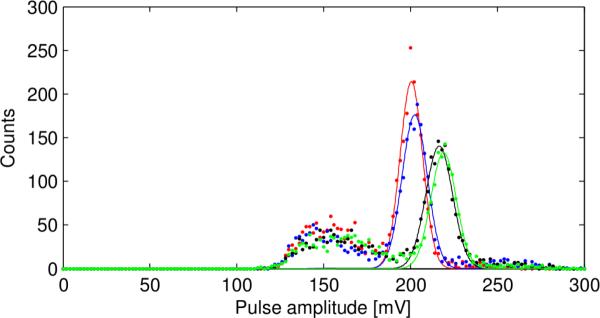
In Fig. 8 the energy spectra for the 4 center SiPM configuration are shown. SiPM identification was performed using the 35 mV LE time pickoff differences between ch1 and ch2 (shown in Fig. 7). The energy resolution for the 4 spectra varies around ~8 -9% FWHM (not corrected for SiPM saturation). Without SiPM identification, this resolution is ~17% FWHM due to the overlapping energy spectra, with each SiPM having a different gain. The energy spectra for the 4 corner configuration are similar to the ones in Fig. 8.
Figure 8.
Energy (pulse amplitude) spectra for the 4 center SiPM configuration with 5 mm LYSO crystal length, for each of the identified SiPMs, according to the ch1 - ch2 time difference, see Fig. 7. The energy spectra were not corrected for SiPM saturation.
4.2. SiPM identification - 16 channel multiplexing configuration with 20 mm LYSO crystal length
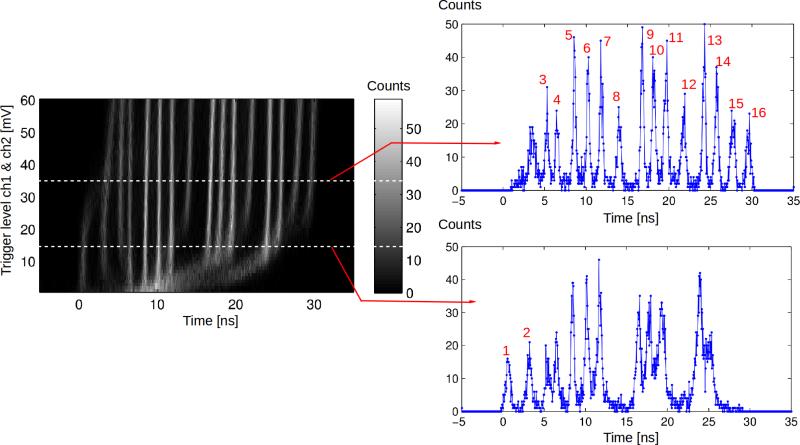
Fig. 9 shows the ch1 - ch2 time difference spectra as a function of LE trigger level on ch1 and ch2 for the 16 channel multiplexed array detector with 20 mm LYSO crystal length. Fig. 9 was generated with an uncollimated 511 keV annihilation photon beam from the Na-22 source (by singles mode acquisition instead of coincidence mode). In this figure, energy filtering was applied such that only 511 keV photopeak events are shown. As the preamplifiers corresponding to SiPM elements 1 and 2 had a relatively low gain, time difference histograms at two different trigger levels are shown in Fig. 9.
Figure 9.
ch1 - ch2 time difference spectra for the 16 channel multiplexed array detector with 20 mm LYSO crystal length at various LE trigger levels for ch1 and ch2 (left graph). The top right graph indicates the ch1 - ch2 time difference spectrum at 35 mV above baseline. The bottom right graph indicates the ch1 - ch2 time difference spectrum at 15 mV above baseline. The white dashed lines in the left graph indicate the 15 mV and 35 mV trigger levels corresponding to the right graphs. The numbers on the right graphs indicate the SiPM element indices. The ~60 mV voltage range in the left graph roughly corresponds to 50% of the pulse amplitude.
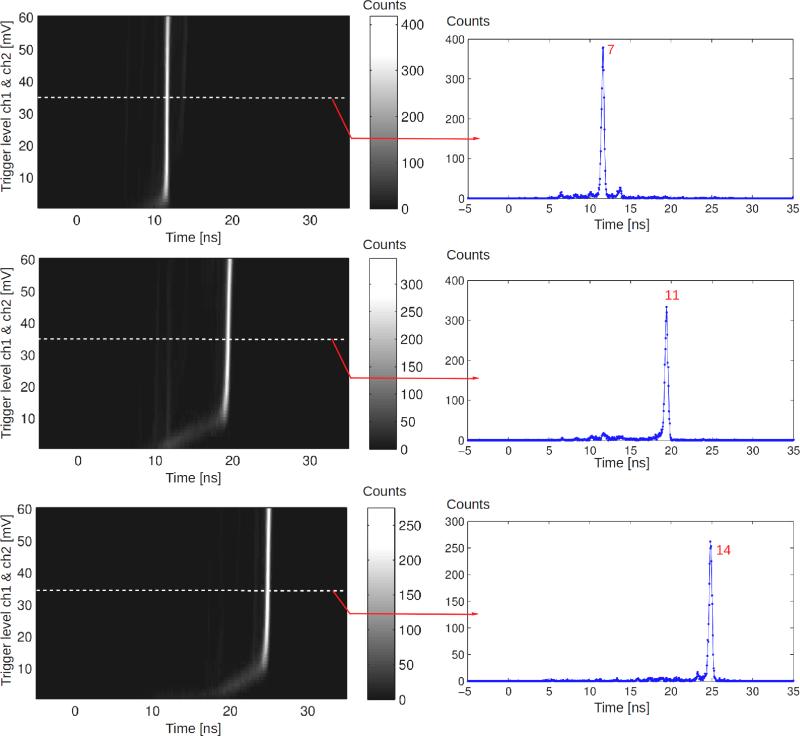
Fig. 10 shows the ch1 - ch2 time difference spectra with an electronically collimated photon beam exciting a single crystal element at a time (see section 3.2.2). Also in this figure, energy filtering was applied such that only 511 keV photopeak events are shown.
Figure 10.
ch1 - ch2 time difference spectra for the 16 channel multiplexed array detector with 20 mm LYSO crystal length at various LE trigger levels for ch1 and ch2 with a collimated annihilation photon beam (left graphs). The right graphs indicate the corresponding ch1 - ch2 time difference spectra at 35 mV above baseline. The annihilation photon beam was set at crystal elements 7 (top graphs), 11 (center graphs), and 14 (bottom graphs). The numbers on the right graphs indicate the SiPM element indices. The ~60 mV voltage range in the left graphs roughly corresponds to 50% of the pulse amplitudes.
4.3. Timing performance
Table 1 shows the obtained coincidence timing resolutions from the 16 channel multiplexed array detector with 20 mm LYSO crystal length and the reference detector pixel. Measurement configurations A, B, and C are described in section 3.3. The timing resolutions (CRTs) for config. A were determined from the datasets that were also used for generating Fig. 10. For these CRTs, ch1 - ch2 time difference filtering was applied, selecting only events within the SiPM identification peaks of Fig. 10. For each reported CRT, only photopeak events were taken into account.
Table 1.
FWHM coincidence timing resolutions (CRTs) for the 16 channel multiplexed array detector with 20 mm LYSO crystal length in coincidence with the reference detector pixel, with the measurement setups in Fig. 10. Configs. A, B, and C represent the measurement configurations detailed in section 3.3. Error values indicate the 2σ Gaussian fitting errors.
| SiPM index | FWHM CRT config. A [ps] | FWHM CRT config. B [ps] | FWHM CRT config. C [ps] |
|---|---|---|---|
| 7 | 273 ± 3 | 252 ± 2 | 220 ± 1 |
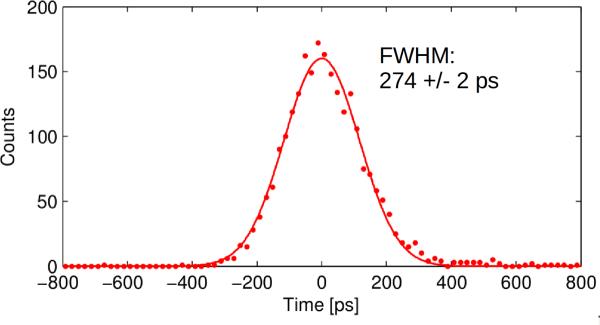
| 11 | 274 ± 2 | 240 ± 2 | 216 ± 1 |
| 14 | 268 ± 2 | 238 ± 1 | 203 ± 1 |
Fig. 11 shows the time difference spectrum for SiPM index 11 in config. A, corresponding to the measurement in Table 1. The energy spectra corresponding to the timing measurements in Table 1 for SiPM index 11 are shown in Fig. 12. These energy spectra were not corrected for SiPM saturation.
Figure 11.
Time difference spectrum for the 16 channel multiplexed array detector with 20 mm LYSO crystal length in coincidence with the reference detector pixel. ch1 - ch2 time difference filtering was applied, selecting only events within the SiPM identification peak of SiPM index 11 of Fig. 10. The timing spectrum corresponds to the timing measurement reported in Table 1 for SiPM index 11 in config. A. The 2σ Gaussian tting error of the FWHM resolution is indicated.
Figure 12.
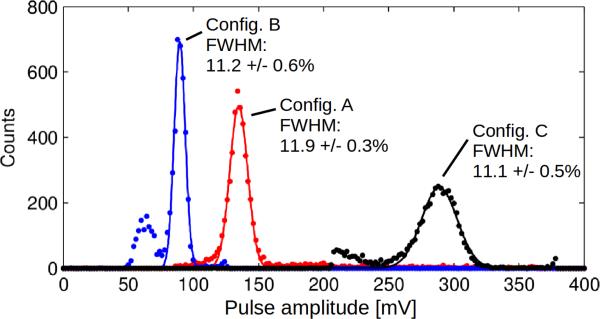
Energy (pulse amplitude) spectra for SiPM index 11 of the 16 channel multiplexed array detector with 20 mm LYSO crystal length. Configs. A, B, and C represent the measurement configurations detailed in section 3.3. The pulse amplitudes were determined from waveform digitizer channel ch1 (see section 3.3). FWHM energy resolutions together with the 2σ Gaussian tting errors are indicated. The energy spectra were not corrected for SiPM saturation.
For the 4 channel multiplexed array detector with 5 mm LYSO crystal length (see section 3.2.1) in coincidence with the reference detector pixel, the CRT was on average ~197 ps FWHM for the SiPMs in config. A (with 4 SiPM signals combined into a single a channel). The CRT was on average ~168 ps FWHM for the SiPMs in config. C (with a single powered-on SiPM at a time and without the 4 : 1 power combiner).
5. Discussion
It is evident from Figs. 6 and 7 that light sharing and/or inter-crystal Compton scattering is occurring for the 4 center SiPM configuration, with parts of the scintillation signal appearing across the 4 - 5 ns total signal delay. However, the SiPM identification can still be performed correctly at a relatively high LE trigger level of 35 mV above baseline for this configuration. This can also be observed in the energy spectra for the 4 center SiPM configuration in Fig. 8. As mentioned in section 4.1, the energy resolution for the 4 spectra varied around ~8 - 9% FWHM (not corrected for SiPM saturation). Without SiPM identification, this resolution is ~17% FWHM due to the overlapping energy spectra, with each SiPM having a different gain.
For the 16 channel multiplexing configuration with 20 mm LYSO crystal length, Fig. 9 also shows parts of the scintillation signal appearing across the signal delay range at low trigger levels. Well-resolvable time difference peaks can still be obtained however at higher trigger levels (e.g. 35 mV in Fig. 9). Since the signals from SiPM elements 1 and 2 had a relatively low amplitude, they could not be resolved at the 35 mV trigger level in Fig. 9, but at a lower (15 mV) trigger level. When an electronic collimation was applied for the 511 keV photon beam, with the beam exciting a single crystal element at a time, Fig. 10 shows the time difference spectra with the majority of scintillation events located within a single peak at a time. The scintillation light sharing is still visible in Fig. 10, with the scintillation signals spread out across the delay range at low trigger levels. This has however a minimal effect on the SiPM identification when the signals are triggered at a higher level (e.g. 35 mV in Fig. 10). At this higher trigger level, some events are still located outside the main time difference peak. We attribute this effect to events for which the incoming annihilation photons underwent inter-crystal (Compton) scattering, creating a large number of scintillation photons in one of the neighboring crystal elements.
It is apparent from Table 1 that there is an average time resolution difference of about 30 ps FWHM between configs. B and C. For both configurations, only a single SiPM was powered on at a time. In config. C, the 16 : 1 power combiner was removed (along with the associated ~13.5 dB insertion (power) loss, see section 3.2.2). As explained in section 3.3, the time resolution difference is expected to be caused by the difference in pulse amplitude, causing a different timing uncertainty associated with the electronic and quantization noise of the waveform digitizer. Fig. 12 shows the difference in pulse amplitudes between configs. B and C for SiPM element 11. This implies that the ~60 ps FWHM time resolution difference between config. A (whereby all 16 SiPMs were powered on) and C is partly caused by the signal attenuation associated with the 16 : 1 power combiner. Adding an additional amplifier after the power combiner, or using a summing amplifier instead of the power combiner, may thus result in a smaller timing degradation for the delay line multiplexing method, as this will increase the signal slope and reduce the timing uncertainty associated with the noise from the waveform digitizer. It is further apparent from Table 1 that the timing resolution is degraded by ~30 ps FWHM when the other 15 SiPMs are turned on, due to noise (dark count) accumulation in a single channel (see average time resolution difference between configs. A and B). This timing degradation is relatively small, as the time pickoff algorithm (see section 3.4) corrects for baseline shifts induced by dark counts. Further, as is shown in Fig. 12, the pulse amplitude for config. A was larger than for config. B. This is due to the scintillation light sharing among the crystal elements. As the multiplexing circuit sums the signals from all 16 SiPMs, scintillation photons that escaped to neighboring crystals may still contribute to the scintillation pulse, unlike in config. B for which only a single SiPM was powered on. The timing information associated with these scintillation photons and/or the larger pulse amplitude may partly offset the timing degradation due to noise accumulation from several sensors.
In an earlier study, we obtained a ~150 ps FWHM CRT for 3 × 3 × 5 mm3 LYSO crystals, and ~190 ps FWHM for 3 × 3 × 20 mm3 crystals mm LYSO using the same SiPM sensors [Yeom et al., 2013a]. These measurements were obtained with individual crystal pixels closely wrapped in reflective material. Due to the light losses associated with scintillation light sharing among multiple crystal elements in the current 4 × 4 crystal array detector, the timing resolution is degraded. For a 4 × 4 crystal array with 3 × 3 × 20 mm3 LYSO crystal elements, whereby one SiPM was powered on at a time, in coincidence with a 3 × 3 × 5 mm3 LYSO crystal pixel, an average CRT of ~213 ps FWHM was obtained (see Table 1, config. C). This translates to a CRT of ~261 ps FWHM for two such 3 × 3 × 20 mm3 LYSO crystals in (using a quadratical subtraction of coincidence the timing resolution for the 3 × 3 × 5 mm3 LYSO crystal).
As the delay line multiplexing method preserves the signal integrity (see section 3.1), the degradation in timing resolution is relatively small and mostly due to noise accumulation from multiple channels and signal attenuation associated with the power combiners (and splitters). As discussed earlier, the latter effect could be corrected for by including active amplifiers in the multiplexing circuit. The relatively small timing degradation may be an advantage of the delay line multiplexing method over traditional resistor chain networks, which often change the pulse shape and add resistor noise. Further, it was shown that the arrival time difference between the pulse signals, and thus the crystal identification, could be evaluated at multiple trigger levels. Scintillation light sharing among multiple crystal elements may affect the identification at a certain trigger level, but the identification may be minimally affected when it is performed at a different trigger level. This multi-dimensional time difference evaluation to account for scintillation light sharing may be an added advantage of the method over other multiplexing methods that use amplitude encoding, since only a one-dimensional signal amplitude comparison among channels is possible in the latter method.
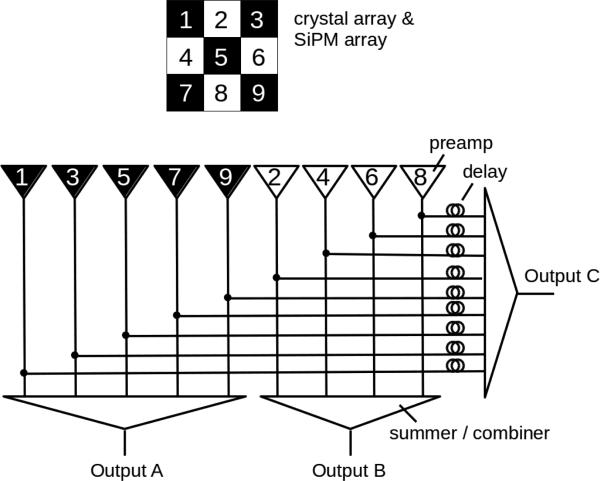
The multiplexing configuration in this paper could also be adjusted to potentially filter out (or recover) inter-crystal Compton scatter events. In Fig. 13 the multiplexing configuration is arranged in a checker board pattern. When an inter-crystal scattering event occurs, a signal would be generated in all three outputs A, B, and C in Fig. 13. If the annihilation photon interactions happen in a single crystal element, a signal would be generated in only two outputs. Hereby, the assumption is made that inter-crystal scattering predominantly occurs between neighboring crystal elements that share a crystal face, instead of between crystal elements along a diagonal line. Further, inter-crystal scattering events should produce distinguishable signals from events with scintillation light sharing among crystal elements.
Figure 13.
Checker board multiplexing configuration to account for inter-crystal Compton scattering. SiPMs and preamps with the same index are connected to each other.
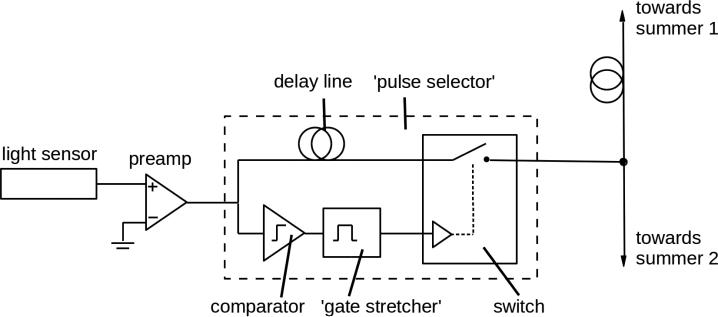
For encoding a very large number of light sensors, section 3.1 discussed that multiple branch splitting could be applied, such that the time difference pattern among multiple output channels encodes the light sensors. The higher branch ratio would reduce the maximum required delay for multiplexing the large number of sensors. The combination of multiple light sensors within a channel would however degrade the timing resolution due to the noise accumulation. The delay line could have an additional function to resolve this issue. Fig. 14 shows a schematical diagram of a ’pulse selector’ between the preamplifier and the delay line multiplexer. Hereby, an additional 1 : 2 splitter produces two identical signal branches. One branch is sent to a comparator that produces a logic gate signal once a pulse arrives with an amplitude higher than a preset trigger threshold. The gate signal is sent to a ’gate stretcher’ that stretches the gate pulse to a certain time width. The other branch of the 1 : 2 splitter is sent through a delay line to an electrical switch. On default, this switch is in an open state, and will thus not pass signals to the subsequent electronic circuitry. Only when a gate signal from from the gate stretcher arrives, the switch will close for a time duration comparable to the time width of the gate pulse. The trigger threshold of the comparator is set to a level in-between the signal noise level and the amplitude level of valid scintillation pulses. The gate time width is set to the typical duration of the scintillation pulse. The delay element is selected to have a time delay that is larger than the response time of the comparator and gate stretcher plus the time difference between the onset of the radiation pulse and the moment at which the pulse crosses the trigger threshold at the comparator. This ensures that the complete pulse information will be transferred from the delay element, through the switch, to the subsequent circuitry, when the comparator and gate stretcher trigger the switch. This configuration ensures that only valid scintillation pulses will be passed to the subsequent circuitry, and will block noise pulses, such that optimum signal-to-noise ratio is preserved. By including a delay line in this configuration, it is not required to have a comparator that produces a very fast output, a standard comparator could be used. In addition, the trigger threshold could be set to just below the 511 keV photopeak, such that many Compton scattered events are automatically filtered out and not processed by the subsequent readout electronics. Without the delay line in this configuration, the initial part of the scintillation pulse (with the timing information) would not be passed by the switch, due to the response time of the comparator and gate stretcher to produce a gate signal. The pulse selector in Fig. 14 may thus prevent the noise buildup when many light sensors are combined in a single channel, such that an optimal timing resolution may still be preserved.
Figure 14.
Schematical diagram of a ’pulse selector’ incorporated between the preamplifier and multiplexing circuit.
The coaxial cable delays that were used for the experiments in this paper (see Fig. 4) might be too bulky for a real PET system. However, RF delay lines can be made using materials with a high electric permittivity and magnetic permeability, to reduce signal speed. In addition, specific impedance conductor configurations exist, that can further reduce the delay component size [Pch, 2003]. Further, there are commercially available solutions to achieve much more compact delay lines than employed in the prototype setup (Fig. 4). It was mentioned earlier that multiple branch splitting could be applied as well, such that the time difference pattern among multiple output channels encodes the light sensors. This would reduce the maximum required delay for multiplexing a large number of sensors.
The signal delays might increase the coincidence time window in a real PET system, if the coincidence pairing and delay signal pairing is performed with traditional hardware AND-gates. To mitigate this issue, one could implement an offine channel identification from the delay signal pairing, and a singles (instead of coincidence) event processing.
The delay line multiplexing method provides a fully analog signal processing method as opposed to digital multiplexing methods that employ a comparator element directly after each light sensor, and use the ’time-over-threshold’ technique to encode the pulse energy (e.g. [Grant and Levin, 2014, Grant and Levin, 2013]). Although the digital methods do not suffer from noise accumulation from multiple sensors in their multiplexing schemes, the time-over-threshold technique may not accurately encode the pulse energy, while low pulse trigger thresholds may lead to extended ’dead time’ states of the trigger circuitry, due to dark count triggering.
6. Conclusion
The electrical delay line multiplexing method preserves signal integrity such that good timing performance can be preserved. Results show that accurate crystal identification can be performed based on the arrival time difference of the multiplexed signal outputs. The arrival time difference can be evaluated at multiple trigger levels, such that scintillation light sharing among crystal elements may not necessarily complicate the identification task. With this method, the number of data acquisition channels can be reduced, thereby reducing the cost and complexity of radiation detection systems, while still maintaining excellent timing performance.
Acknowledgements
We would like to thank Dr. Keyjo Hong for his help on soldering and mounting the coaxial cable delays (Fig. 4, right). This work was supported in part by NIH grant R21 EB014405, the Netherlands Organisation for Scientific Research (NWO), and the Quality of Working Life (QWL) program funded by the Ministry of Trade, Industry & Energy of Korea.
References
- Pchelnikov YN, Nyce DS. Electromagnetic delay line with improved impedance conductor. 2003 2003 Feb 18; [Pch, 2003] US Patent 6,522,222. [Google Scholar]
- Antich P, Tsyganov E, Malakhov N, Sadygov Z. Avalanche photo diode with local negative feedback sensitive to UV, blue and green light. Nucl. Instr. and Meth. A. 1997;389(3):491–498. [Antich et al., 1997] [Google Scholar]
- Bondarenko G, Buzhan P, Dolgoshein B, Golovin V, Guschin E, Ilyin A, Kaplin V, Karakash A, Klanner R, Pokachalov V, Popova E, Smirnov K. Limited Geiger-mode microcell silicon photodiode: new results. Nucl. Instr. and Meth. A. 2000;442(1-3):187–192. [Bondarenko et al., 2000] [Google Scholar]
- Britvitch Characterisation of Geiger-mode avalanche photodiodes for medical imaging applications. Nucl. Instr. and Meth. A. 2007;571(1-2):308–311. [Google Scholar]
- Golovin V, Saveliev V. Novel type of avalanche photodetector with Geiger mode operation. Nucl. Instr. and Meth. A. 2004;518(1-2):560–564. [Golovin and Saveliev, 2004] [Google Scholar]
- Grant A, Levin C. Nuclear Science Symposium and Medical Imaging Conference (NSS/MIC) 2013 IEEE; 2013. Optical encoding and multiplexing of detector signals with dual threshold time-over-threshold. pp. 1–3. [Grant and Levin, 2013] [Google Scholar]
- Grant AM, Levin CS. A new dual threshold time-over-threshold circuit for fast timing in pet. Physics in Medicine and Biology. 2014;59(13):3421. doi: 10.1088/0031-9155/59/13/3421. [Grant and Levin, 2014] [DOI] [PubMed] [Google Scholar]
- Gundacker S, Knapitsch A, Auffray E, Jarron P, Meyer T, Lecoq P. Time resolution deterioration with increasing crystal length in a tof-pet system. Nucl. Instrum. Meth. A. 2014;737(0):92–100. [Gundacker et al., 2014] [Google Scholar]
- Herbert DJ, Moehrs S, D'Ascenzo N, Belcari N, Del Guerra A, Morsani F, Saveliev V. The Silicon Photomultiplier for application to high-resolution Positron Emission Tomography. Nucl. Instr. and Meth. A. 2007;573(1-2):84–87. [Herbert et al., 2007] [Google Scholar]
- Keller H, Klingelhfer G, Kankeleit E. A position sensitive microchannelplate detector using a delay line readout anode. Nuclear Instruments and Methods in Physics Research Section A: Accelerators, Spectrometers, Detectors and Associated Equipment. 1987;258(2):221–224. [Keller et al., 1987] [Google Scholar]
- McElroy DP, Saveliev V, Reznik A, Rowlands JA. Evaluation of silicon photomultipliers: A promising new detector for MR compatible PET. Nucl. Instr. and Meth. A. 2007;571(1-2):106–109. [McElroy et al., 2007] [Google Scholar]
- Musienko Y, Auffray E, Lecoq P, Reucroft S, Swain J, Trummer J. Study of multi-pixel Geiger-mode avalanche photodiodes as a read-out for PET. Nucl. Instr. and Meth. A. 2007;571(1-2):362–365. [Musienko et al., 2007] [Google Scholar]
- Olcott P, Talcott J, Levin C, Habte F, Foudray AMK. Compact readout electronics for position sensitive photomultiplier tubes. IEEE Trans. Nucl. Sci. 2005;52(1):21–27. [Olcott et al., 2005] [Google Scholar]
- Popov V, Majewski S, Weisenberger A, Wojcik R. Analog readout system with charge division type output. 2001 IEEE Nucl. Sci. Symp. Conf. Record. 2001;4:1937–1940. [Popov et al., 2001] [Google Scholar]
- Renker D. New trends on photodetectors. Nucl. Instr. and Meth. A. 2007;571(1- 2):1–6. [Renker, 2007] [Google Scholar]
- Schaart DR, Seifert S, Vinke R, van Dam HT, Dendooven P, Löhner H, Beekman FJ. LaBr3:Ce and SiPMs for time-of-flight PET: achieving 100 ps coincidence resolving time. Phys. Med. Biol. 2010;55(7):N179. doi: 10.1088/0031-9155/55/7/N02. [Schaart et al., 2010] [DOI] [PubMed] [Google Scholar]
- Seifert S, van Dam HT, Schaart DR. The lower bound on the timing resolution of scintillation detectors. Phys. Med. Biol. 2012;57(7):1797–1814. doi: 10.1088/0031-9155/57/7/1797. [Seifert et al., 2012] [DOI] [PubMed] [Google Scholar]
- Vinke R, Löhner H, Schaart D, van Dam H, Seifert S, Beekman F, Dendooven P. Optimizing the timing resolution of SiPM sensors for use in TOF-PET detectors. Nucl. Instr. and Meth. A. 2009a;610(1):188–191. [Vinke et al., 2009a] [Google Scholar]
- Vinke R, Olcott PD, Cates JW, Levin CS. The lower timing resolution bound for scintillators with non-negligible optical photon transport time in time-of-flight pet. Physics in medicine and biology. 2014;59(20):6215. doi: 10.1088/0031-9155/59/20/6215. [Vinke et al., 2014] [DOI] [PMC free article] [PubMed] [Google Scholar]
- Vinke R, Seifert S, Schaart D, Schreuder F, de Boer M, van Dam H, Beekman F, Löhner H, Dendooven P. Optimization of digital time pickoff methods for LaBr3-SiPM TOF-PET detectors. 2009 IEEE Nucl. Sci. Symp. Conf. Record. 2009b:2962–2968. [Vinke et al., 2009b] [Google Scholar]
- Wilmshurst T. Signal recovery from noise in electronic instrumentation. A. Hilger Publ.; 1985. [Wilmshurst, 1985] [Google Scholar]
- Yamamoto K, Yamamura K, Sato K, Ota T, Suzuki H, Ohsuka S. Development of Multi-Pixel Photon Counter (MPPC). 2006 IEEE Nucl. Sci. Symp. Conf. Record. 2006;2:1094–1097. [Yamamoto et al., 2006] [Google Scholar]
- Yeom JY, Vinke R, Levin CS. Optimizing timing performance of silicon photomultiplier-based scintil lation detectors. Phys. Med. Biol. 2013a;58(4):1207. doi: 10.1088/0031-9155/58/4/1207. [Yeom et al., 2013a] [DOI] [PMC free article] [PubMed] [Google Scholar]
- Yeom JY, Vinke R, Spanoudaki V, Hong KJ, Levin C. Readout electronics and data acquisition of a positron emission tomography time-of-flight detector module with waveform digitizer. IEEE Trans. Nucl. Sci. 2013b;60(5):3735–3741. [Yeom et al., 2013b] [Google Scholar]


