Abstract
Conclusion
The human frequency-to-place map may be modified by experience, even in adult listeners. However, such plasticity has limitations. Knowledge of the extent and the limitations of human auditory plasticity can help optimize parameter settings in users of auditory prostheses.
Objectives
To what extent can adults adapt to sharply different frequency-to-place maps across ears? This question was investigated in two bilateral cochlear implant users who had a full electrode insertion in one ear, a much shallower insertion in the other ear, and standard frequency-to-electrode maps in both ears.
Method
Three methods were used to assess adaptation to the frequency-to-electrode maps in each ear: 1) pitch matching of electrodes in opposite ears, 2) listener-driven selection of the most intelligible frequency-to-electrode map, and 3) speech perception tests. Based on these measurements, one subject was fitted with an alternative frequency-to-electrode map, which sought to compensate for her incomplete adaptation to the standard frequency-to-electrode map.
Results
Both listeners showed remarkable ability to adapt, but such adaptation remained incomplete for the ear with the shallower electrode insertion, even after extended experience. The alternative frequency-to-electrode map that was tested resulted in substantial increases in speech perception for one subject in the short—insertion ear.
INTRODUCTION
Cochlear implants (CIs) rely on the tonotopic organization of the cochlea to provide frequency information. Each intracochlear electrode is stimulated in response to energy from a certain frequency band, with more basal electrodes being associated with higher frequencies. The table that maps acoustic frequency into different electrodes along the array is known as the Frequency Allocation Table (FAT). The frequency range covered by standard FATs starts at frequencies as low as 100–350 Hz, but there is evidence that some models of cochlear implant electrodes do not reach that cochlear regions that correspond to these frequencies in a normal ear. The result is a frequency mismatch to which postlingually deaf CI users must adapt [1, 2, 3, 4]. Fortunately, studies have shown that the pitch sensations associated with different electrodes change in response to auditory experience, becoming more consistent with the FAT programmed into the patient’s speech processor [5, 6, 7, 8]. But is this adaptation to a modified peripheral sensory map complete for all CI users? What are the limits of the human brain’s ability to adapt? The present study sought to confirm the “adaptation hypothesis”, which states that postlingually deaf human listeners can adapt (at least to some degree) to mismatch in place of stimulation across ears. The study also sought to test the “incomplete adaptation” hypothesis, which states that the adaptation process may not always be complete. Note that as stated, these two hypotheses are not necessarily mutually exclusive. One way to investigate these questions and test both hypotheses is by examining extreme cases of mismatch, those that tax the ability of the human brain to adapt. That is what was done in the present study. Two bilateral cochlear implant users were examined who (for different reasons) had a full electrode insertion in one ear, a much shallower insertion in the other ear, and FATs covering the same acoustic frequency range in both ears despite the sharp difference in electrode location across ears. Three behavioral methods were used in this study to assess the extent and the limitations of adaptation to different frequency--to--place maps, and mathematical models of speech perception by cochlear implant listeners were used to interpret the results.
In addition to their basic scientific interest, the questions posed above have clinical implications for the design and programming of hybrid cochlear implants (which have shorter electrodes that standard cochlear implants), particularly in ears that lose their remaining residual hearing.
MATERIALS AND METHODS
Subjects
Subject 1 has two Advanced Bionics (Valencia, CA) devices. The left ear has a normal insertion with all 16 electrodes in their standard position in the cochlea (according to the surgical report) while the right ear only has five of the 16 electrodes inside the cochlea. This subject was suddenly deafened at age 17 and received a UCSF/Storz (St. Louis, MO) implant in her right ear fourteen years later. Unfortunately, this device had to be explanted less than five years later due to an infection that would not clear. Twelve years after that she received an Advanced Bionics CII device in her left ear and six years later the right ear was implanted with another Advanced Bionics device that could only be partially inserted due to tissue growth inside the cochlea since the removal of the UCSF/Storz electrode. Despite the large difference in electrode location across ears, both devices were programmed using very similar frequency ranges, 350–8700 Hz for the right ear and 250–8700 for the left ear (see Table 1). At the time of testing she had three years of listening experience with her right ear and nine years with the left.
Table 1.
Clinically assigned frequency boundaries for Subject 1. Channels are numbered from most apical to most basal.
| Short insertion electrode array | Standard insertion electrode array | |||
|---|---|---|---|---|
| Channel number | Low frequency | High frequency | Low frequency | High frequency |
| 1 | 350 | 607 | 250 | 416 |
| 2 | 607 | 1053 | 416 | 494 |
| 3 | 1053 | 1827 | 494 | 587 |
| 4 | 1827 | 3170 | 587 | 697 |
| 5 | 3170 | 8700 | 697 | 828 |
| 6 | 828 | 983 | ||
| 7 | 983 | 1168 | ||
| 8 | 1168 | 1387 | ||
| 9 | 1387 | 1648 | ||
| 10 | 1648 | 1958 | ||
| 11 | 1958 | 2326 | ||
| 12 | 2326 | 2762 | ||
| 13 | 2762 | 3281 | ||
| 14 | 3281 | 3898 | ||
| 15 | 3898 | 4630 | ||
| 16 | 4630 | 8700 | ||
Subject 2 initially had residual hearing and received a Cochlear Hybrid-–S8 (10 mm electrode; Cochlear; Sydney, Australia) in the left ear. Two years after the Hybrid implantation she lost residual hearing in both ears (due to presumed autoimmune disease) and was then implanted with a standard 24 mm Cochlear device (a Freedom CI24RE receiver with a Contour electrode) in the right ear. The surgical report indicated a complete insertion of the electrode array and all electrode impedances fell within the normal range. At that point both processors were programmed with the standard FAT for users of Cochlear devices, which spans the frequency range of 188–7938 Hz (see Table 2). In the ear with the standard insertion array, the two most basal electrodes were deactivated due to poor quality percepts. At the time of initial testing she had 6 years of experience with the standard frequency tables in both ears.
Table 2.
Clinically assigned frequency boundaries for Subject 2. Note that in this case channels are numbered from most basal to most apical. The two most basal electrodes in the standard insertion array were deactivated due to poor quality percepts.
| Short insertion electrode array | Standard insertion electrode array | ||||
|---|---|---|---|---|---|
| Channel number |
Low frequency | High frequency | Channel number |
Low frequency | High frequency |
| 6 | 188 | 563 | 22 | 188 | 313 |
| 5 | 563 | 1063 | 21 | 313 | 438 |
| 4 | 1063 | 1813 | 20 | 438 | 563 |
| 3 | 1813 | 2938 | 19 | 563 | 688 |
| 2 | 2938 | 4813 | 18 | 688 | 813 |
| 1 | 4813 | 7938 | 17 | 813 | 938 |
| 16 | 938 | 1063 | |||
| 15 | 1063 | 1188 | |||
| 14 | 1188 | 1438 | |||
| 13 | 1438 | 1688 | |||
| 12 | 1688 | 1938 | |||
| 11 | 1938 | 2313 | |||
| 10 | 2313 | 2688 | |||
| 9 | 2688 | 3188 | |||
| 8 | 3188 | 3688 | |||
| 7 | 3688 | 4313 | |||
| 6 | 4313 | 5063 | |||
| 5 | 5063 | 5938 | |||
| 4 | 5938 | 6938 | |||
| 3 | 6938 | 7938 | |||
Both subjects were postlingually deaf, and had bilateral profound hearing loss at the time of testing. Both of them had sharp differences in electrode location across ears but both ears were programmed with very similar or identical frequency ranges. In both cases and for both ears they had several years of experience which gave them an excellent chance to adapt to the frequency mismatch. Intracochlear electrode location was estimated based on surgical reports combined with manufacturer information regarding electrode size. Even though these estimates are not as precise as those that could be obtained from imaging, it is clear that there was a very significant mismatch in electrode location across ears for both subjects.
Measurement of adaptation to frequency mismatch
All experiments were approved by the NYU School of Medicine Institutional Review Board and conducted in accordance with the ethical standards of the Helsinki Declaration of 1975, as revised in 1983. Three behavioral methods were used to assess whether listeners were able to adapt to the frequency-to-place maps in each ear. The text below includes descriptions of each method and what the corresponding outcomes would look like in cases of complete or incomplete adaptation.
Method 1: Pitch matching of electrodes in opposite ears
Clinical software (Soundwave™ in the case of subject 1 and Custom Sound™ in the case of subject 2) running in two separate computers was used to stimulate one electrode in the ear with the short insertion and another electrode in the ear with the deeper insertion. The subject’s task was to indicate which sound was higher pitched. There were three possible responses: left ear, right ear or same. When subjects were unsure they could request a repeat. Stimuli consisted on two 500 ms pulse trains separated by a brief pause. Each electrode in the ear with the short insertion was pitch ranked in this manner to each electrode in the contralateral ear between two and four times for subject 1 and between two and six times for subject 2. Psychometric curves were compiled to summarize all responses involving each individual electrode in the short insertion ear compared to all electrodes in the contralateral ear. Responses that required a repeat, or where the subject indicated that the difference was small, received half the weight of other responses. Four-parameter sigmoid functions were fit to the psychometric curves for the electrodes in the short insertion ear and the zero crossing point was considered the pitch-matched location in the contralateral ear. Complete adaptation in this case was defined as the situation where a pair of pitch-matched electrode locations, one in each ear, are associated with the same frequency according to the corresponding FAT. Any discrepancy between the two FAT-derived frequencies would indicate lack of complete adaptation, thus supporting the incomplete adaptation hypothesis. Furthermore, this discrepancy would provide a measure of the extent to which adaptation was not complete.
Method 2: Listener-driven selection of the most intelligible FAT in the short insertion ear
This method is based on a novel software tool [9] that allows CI users to self-select a most intelligible frequency table. They do this by exploring a 2-dimensional grid displayed on a computer screen that represents a range of different frequency tables. Clicking on different parts of the grid triggers the delivery of a preselected speech utterance processed with one specific FAT. Moving in the horizontal direction along the grid changed the high frequency edge of the FAT between 6 KHz and 18 KHz in nine steps. Similarly, moving along the vertical axis changed the low frequency edge of the FAT between 63 Hz and 4063 Hz in nineteen steps. Whenever possible, the frequency boundaries of the FAT between the low- and high-frequency edges were chosen to match the values that would be selected by the clinical fitting software for the same situation. Because this method is specific to Cochlear devices, it was only done with Subject 2. She was asked to explore the grid and select the FAT that made the presented utterance sound most intelligible when listening with the short insertion ear. In the case of this method, complete adaptation was defined as the scenario where a listener selects his current everyday FAT as the most intelligible. Selection of a different FAT is consistent with the incomplete adaptation hypothesis, and the size of the difference between the self-selected FAT and the everyday FAT provides a measure of the direction and size of the residual mismatch. As it turns out subject 2’s self-selected FAT was different from the standard so she was fit with the new FAT to provide an opportunity to evaluate it after take—home experience. CNC (consonant-nucleus-consonant) word recognition and vowel identification tests were done with both FATs before and after the take home experience with the self-selected FAT.
Method 3: Speech perception scores obtained from each ear
Each ear was tested separately using open-set word identification and closed-set vowel identification tests. Stimuli were pre-recorded and presented at 70 dB SPL (C scale) in a soundproof booth. Vowel stimuli consisted of nine vowels in /hVd/context, and each block included five presentations of each vowel. Three blocks were presented for each condition. In the case of this method it is more difficult to tease apart the effect of adaptation and other factors on differential outcomes for the two ears, because possible lack of adaptation in the short insertion ear is confounded with the fact that the number of channels is different across ears. Nonetheless, it is possible to use numbers from previously published studies to determine how much vowel identification and word identification scores should differ only as a function of the number of channels. To the extent that differences in speech perception scores across ears exceed the predicted difference due to dissimilar numbers of channels, this becomes an additional possible indication of lack of adaptation to the FAT in the short insertion ear, thus supporting the incomplete adaptation hypothesis.
Mathematical modeling
Lastly, The Multidimensional Phoneme Identification (MPI) model [10] was used to explain the vowel and word scores Subject 2 obtained with the two short electrode array frequency maps (standard, 188–7938 Hz and self—selected, which was 688–7938 Hz). Model implementation for vowels closely followed Sagi et al. [11],[12]. Model implementation for word scores combined MPI modeling for consonants, which closely followed Svirsky et al. [13] with the model of Rabinowitz et al. [14] wherein word scores are related to vowel and consonant identification scores using a simple power-function relationship.
In brief, with the MPI model phoneme identification is predicted based on a listener’s ability to discriminate a set of postulated speech cues that define a given phoneme. The model is multidimensional in that, typically, more than one cue (and hence, more than one dimension) is required to identify a phoneme. In the present study, two model parameters determine phoneme identification. The first parameter, referred to as "JND", represents a listener's discrimination ability, i.e. their internal noise, for each speech cue (proportional to their just-noticeable-difference, or JND, for each cue). A higher "JND" parameter gives rise to lower phoneme identification scores. The second parameter, referred to as bias, represents a listener's expectations of how a phoneme should sound relative to the physical speech cue values that define that phoneme. If a listener has zero bias, then there is no shift between their expectations of how phonemes should sound and the speech cue values that define that phoneme. Thus, a finding of zero bias would indicate complete adaptation and contradict the incomplete adaptation hypothesis. Conversely, nonzero bias would provide support to the hypothesis.
The speech cues employed to model the vowel data of Subject 2 were the locations along the subject's electrode array of the first two mean formant energies F1 and F2 for each vowel. In the case of the 688–7938 Hz frequency allocation map, F1 mean energy locations for the vowels used for testing were not encoded. Hence, for the 688–7938 Hz map, an MPI model was employed that only used F2 information. Where applicable, "JND" parameters were assumed equal for each formant dimension, whereas bias parameters were varied independently for each formant dimension. These input parameters were varied to yield a model percent correct score that most closely matched the vowel percent correct scores of Subject 2.
Using the vowel and word scores from Subject 2, it is possible to invert the relationship described by Rabinowitz et al. [14] to determine a consonant percent correct score for this subject. This was done for each short electrode frequency map. These derived consonant scores served as targets for MPI consonant modeling.
The speech cues employed to model the derived consonant data of Subject 2 were the same that were successfully used in a previous study [13] to model several aspects of consonant identification by several individual CI users who differed in age at implantation, implant experience, device and stimulation strategy used, as well as overall consonant identification level. The model includes three spectral cues (locations of mean formant energies along the electrode array for the first three formant), the proportion of consonant energy below 800 Hz (which is a correlate of voicing that should be accessible to CI users), and consonant gap duration (see [13]). For the short electrode map spanning 688–7938 Hz, although F1 information was limited, it was still deemed useful and therefore included. However, with this map, it was assumed that proportion of consonant energy below 800 Hz would be negligible, and therefore this dimension was not included. For formant dimensions, "JND" and bias parameters were set equal to those obtained with the MPI vowel model described for this study. For proportion of consonant energy below 800 Hz, "JND" = 0.05 and bias = 0. For gap duration, "JND" = 5 ms and bias = 0.
When implementing the MPI model described herein, the goal was to obtain plausible fitting models that were simple, with as few fitting parameters as possible. The goal was not to determine models that best described detailed phoneme confusions.
RESULTS
Method 1: Pitch matching of electrodes in opposite ears
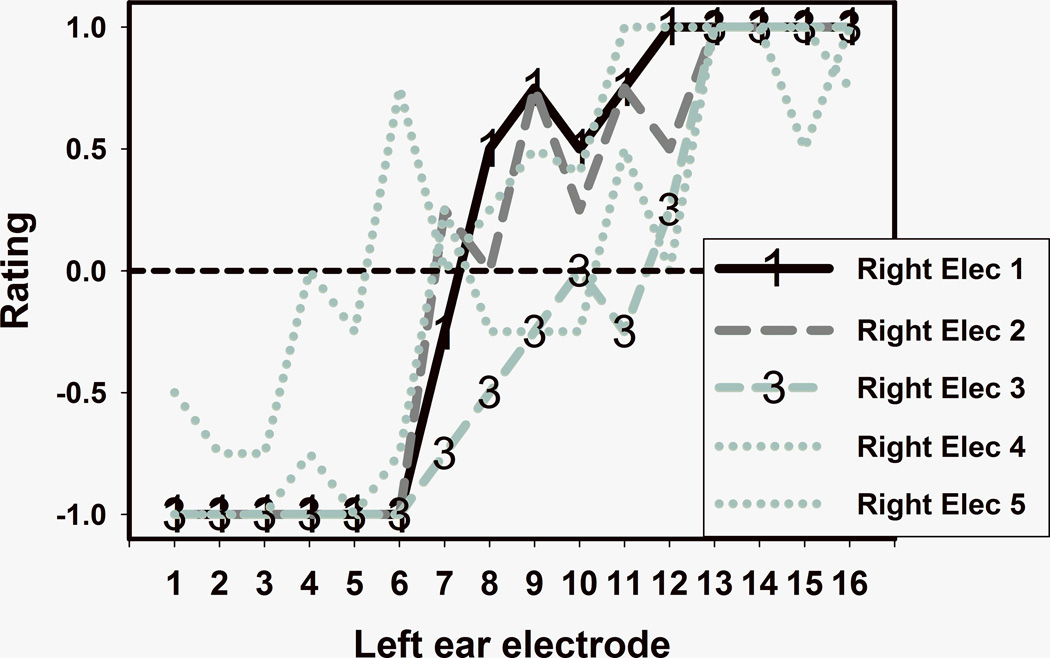
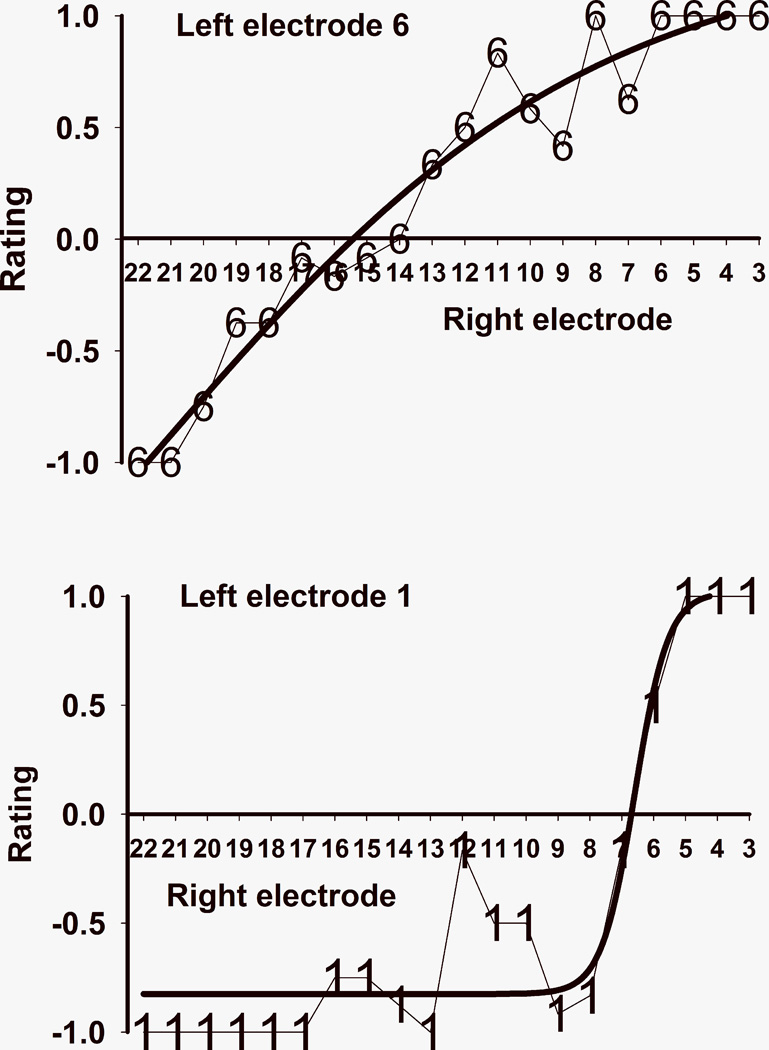
Figure 1 shows pitch matching results for subject 1. Five different curves (one for each electrode in the right ear, which has the short insertion array) summarize the results of comparing the pitch of each right ear electrode to each one of the 16 electrodes in the left ear. With the exception of electrode 5, there was a trend towards tonotopicity: the more basal the electrode in the right ear, the more basal were the pitch matched counterparts in the left ear. Electrode 5 was clinically programmed with an artificially low stimulation level (higher than threshold but lower than the subject’s maximum comfortable level) because it caused unpleasant percepts, something that is not uncommon when stimulating electrodes that are very close to the base of the cochlea. Electrodes 1 and 3 were chosen for further analysis because they had the clearest psychometric curves (highlighted by “1” and “3” symbols in Figure 1). Similar data for subject 2 are shown in Figure 2. Again, electrodes that were more basally located in a given ear tended to be pitch matched to electrodes that were more basally located in the contralateral ear. In this case, electrodes 1 and 6 were chosen for further analysis.
FIGURE 1.
Pitch matching results for subject 1. Each curve shows comparisons between the pitch of one electrode in the short insertion ear and each electrode in the contralateral ear.
FIGURE 2.
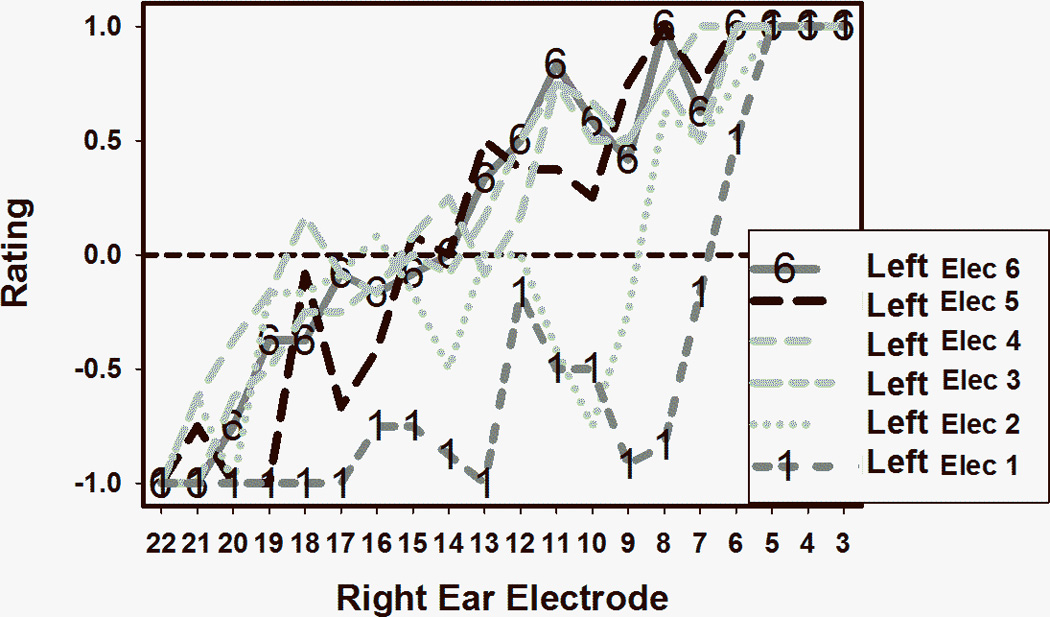
Pitch matching results for subject 2.
The two pitch matching curves from subject 1 chosen for more detailed analysis are shown in Figure 3, with electrode 1 from the right ear in the top panel and electrode 3 from the right ear in the bottom panel. The y-axis indicates the average pitch-matching result with respect to the electrodes in the contralateral (left) ear. A negative rating indicates that the electrode from the short insertion ear (which is the right ear in subject 1) was lower pitched than the comparison electrode in the contralateral ear. Conversely, positive ratings indicate that the electrode from the short insertion ear was higher pitched than the contralateral comparison electrode. The thick lines in Figure 3 are the sigmoid functions that were fit to the data. The fit was excellent for both electrodes, with adjusted R squared of 1.00 and 0.95 respectively for the right electrode 1 and right electrode 3 curves. The zero crossings of the sigmoid curves were at 7.4 for right ear electrode 1 and 10.5 for right ear electrode 3. This means that electrode 1 in the short insertion ear is approximately pitch matched to a location that’s intermediate between electrodes 7 and 8 in the contralateral ear, but closer to the former. Electrode 3 in the short insertion ear corresponds to a location that is about halfway between electrodes 10 and 11 in the contralateral ear. Figure 4 shows similar data from subject 2. Remember that in this case higher electrode numbers correspond to lower frequencies, so the x-axis is listed by decreasing electrode number to make it consistent with Figure 3 where high frequency electrodes are located at the right of the axis. In this case it was found that the most apical short insertion electrode (which is left electrode 6, see top panel of Figure 4) was pitch matched to electrode location 15.4 in the contralateral ear, and the most basal electrode (left electrode 1, bottom panel of Figure 4) was matched to electrode location 6.7 in the contralateral ear. The curve fits were excellent in this case too, with adjusted R squared values of 0.94 for left electrode 6 and 0.89 for left electrode 1.
FIGURE 3.
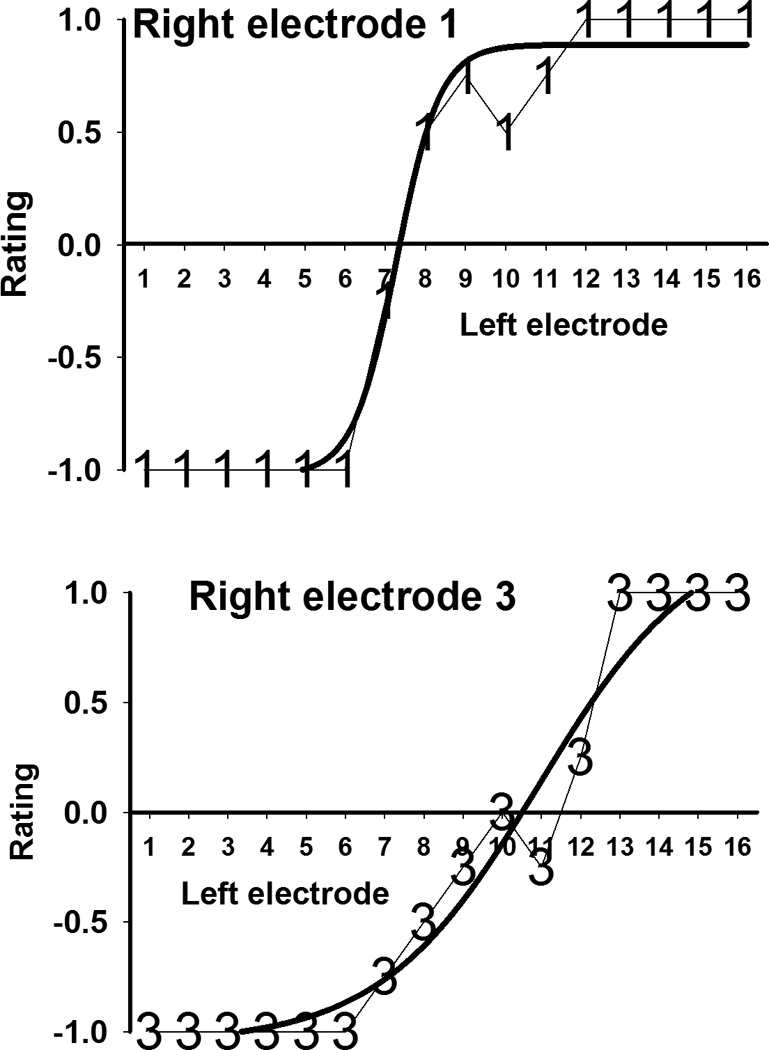
Pitch matching and fitted sigmoid curve for electrodes 1 and 3 from subject 1’s short insertion ear.
FIGURE 4.
Pitch matching and fitted sigmoid curve for electrodes 6 and 1 from subject 2’s short insertion ear.
Can we estimate the amount of frequency mismatch that each subject had to overcome? Is there evidence of adaptation to that frequency mismatch, and has this adaptation been complete? These questions are addressed in Figures 5 and 6, showing data for subjects 1 and 2 respectively. Figure 5 shows the approximate location of the electrodes in the short insertion ear (bottom) and the standard insertion ear (top) based on surgical report notes and measured in mm from the base of the cochlea. Arrows pointing to electrodes 1 and 3 indicate the center frequencies of the bands assigned to each electrode, calculated from columns 2 and 3 in Table 1. These frequencies are 479 Hz for electrode 1 and 1,440 Hz for electrode 3. Two other arrows pointing to the top electrode array indicate the location that corresponds to those frequencies in according to the FAT for the standard insertion ear (interpolated from columns 4 and 5 in Table 1). As can be clearly observed in the figure, the average locations stimulated in response to 479 Hz and 1,440 Hz are much more basal in the short insertion ear than in the standard insertion ear. The difference between these locations across ears represent a measure of the sizeable frequency mismatch that subject 1 had to overcome, between 10 and 15 mm of displacement along the cochlea. The two long arrows connecting the two electrode arrays represent the result of the pitch matching experiment: electrodes 3 and 1 in the short insertion ear were approximately matched to electrode locations 10.5 and 7.4 in the contralateral ear, as indicated above. These two locations correspond approximately to 2,000 Hz and 1,100 Hz in the frequency allocation table for the standard insertion ear. The fact that these arrows connect very different locations in both cochleae suggest that there had been a substantial amount of adaptation since subject 1 had started using the standard FATs in both ears many years before. This result provides support for the adaptation hypothesis. Lastly, the fact that electrodes 3 and 1 in the short insertion ear were matched to contralateral ear locations that corresponded roughly to 2,000 Hz and 1,100 Hz rather than locations that are stimulated by 1,440 Hz and 479 Hz suggest that the adaptation process was incomplete. It also bears pointing out that for the adaptation process to be complete, the distance between electrodes 1 and 3 in the short insertion ear (1.7 mm) should have been mapped into a 4 mm segment in the contralateral ear, but was instead mapped into a segment of 2.2 mm. In other words, complete adaptation would have required a major shift and expansion of the frequency map from the short insertion ear to the standard insertion ear. Subject 1 was only partly successful in terms of the frequency shift and quite unsuccessful in terms of the expansion. Taken together, these results support the incomplete adaptation hypothesis. Figure 6 shows similar results from subject 2. In this case the amount of required adaptation was between 6 and 14 mm of displacement along the cochlea. A greater shift was required for more apical electrodes, again resulting in a requirement for expansion of the frequency map from the short insertion ear to the standard insertion ear. Just like subject 1, subject 2 showed clear evidence of adaptation (supporting the adaptation hypothesis), such adaptation was not complete (supporting the incomplete adaptation hypothesis), and there was more success in terms of a shift in the frequency map than in terms of the expansion that was required.
FIGURE 5.
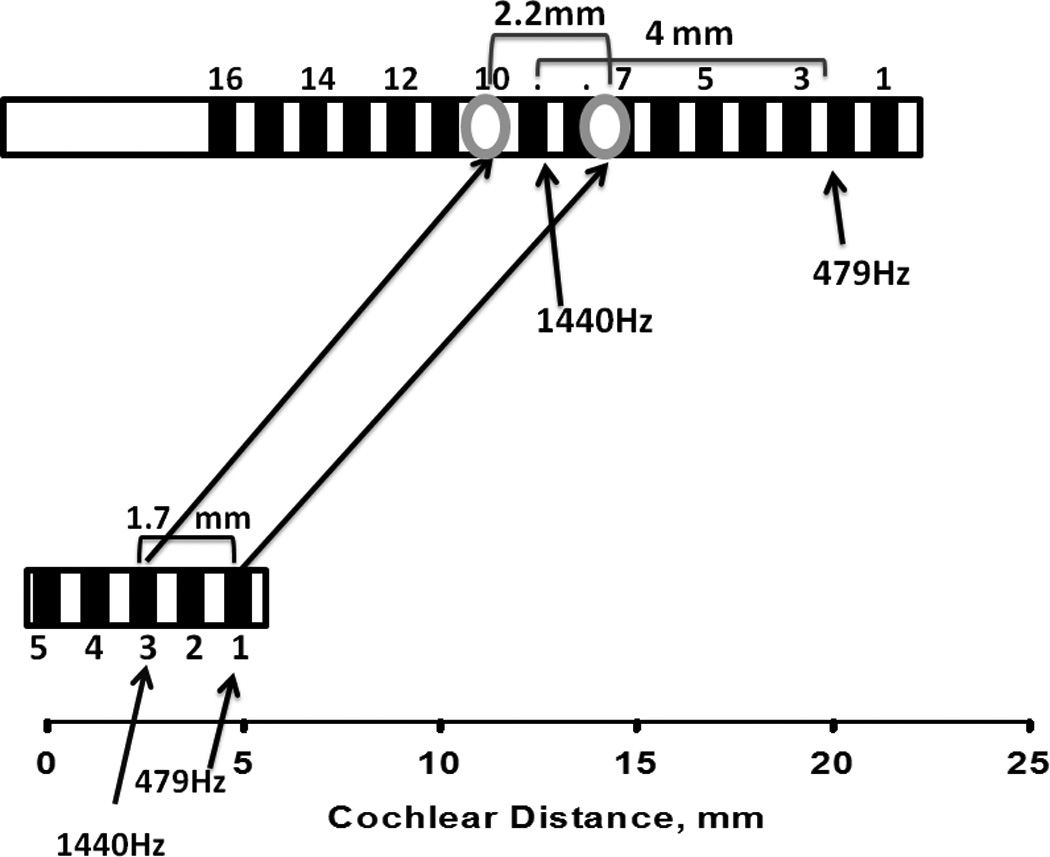
Approximate location of electrodes in the short- and standard—insertion ears for subject 1. The long arrows connecting both arrays show pitch matching results. Short arrows indicate locations corresponding to 479 Hz and 1440 Hz in each ear’s electrode array.
FIGURE 6.
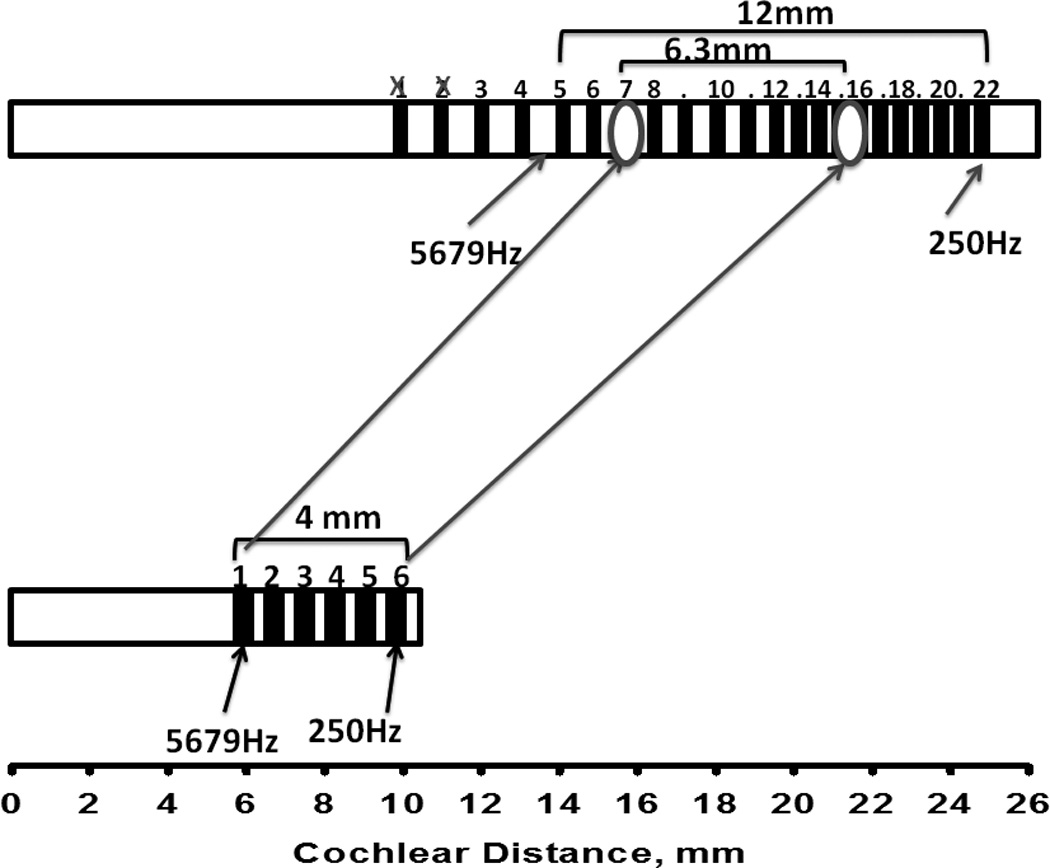
Approximate location of electrodes in the short- and standard—insertion ears for subject 2. The long arrows connecting both arrays show pitch matching results. Short arrows indicate locations corresponding to 250 Hz and 5679 Hz in each ear’s electrode array.
Method 2: Listener-driven selection of the most intelligible FAT in the short insertion ear
FATs deemed “most intelligible” were selected by subject 2 for two different HINT sentences as well as for the series of nonsense words “fa-sa-sha”. Taken together, her selections indicated a clear preference for FATs whose frequency limits were higher than the standard range of 188–7,938 Hz (see columns 2 and 3 in Table 2). After taking into account all her responses, a “self-selected” frequency range of 688–7938 Hz was chosen. Consistent with the results observed with Method 1, subject 2’s selections when using the listener-driven selection procedure are consistent with the incomplete adaptation hypothesis. Complete adaptation should have resulted in selecting the 188–7,938 Hz FAT she had been using in the short insertion ear for many years.
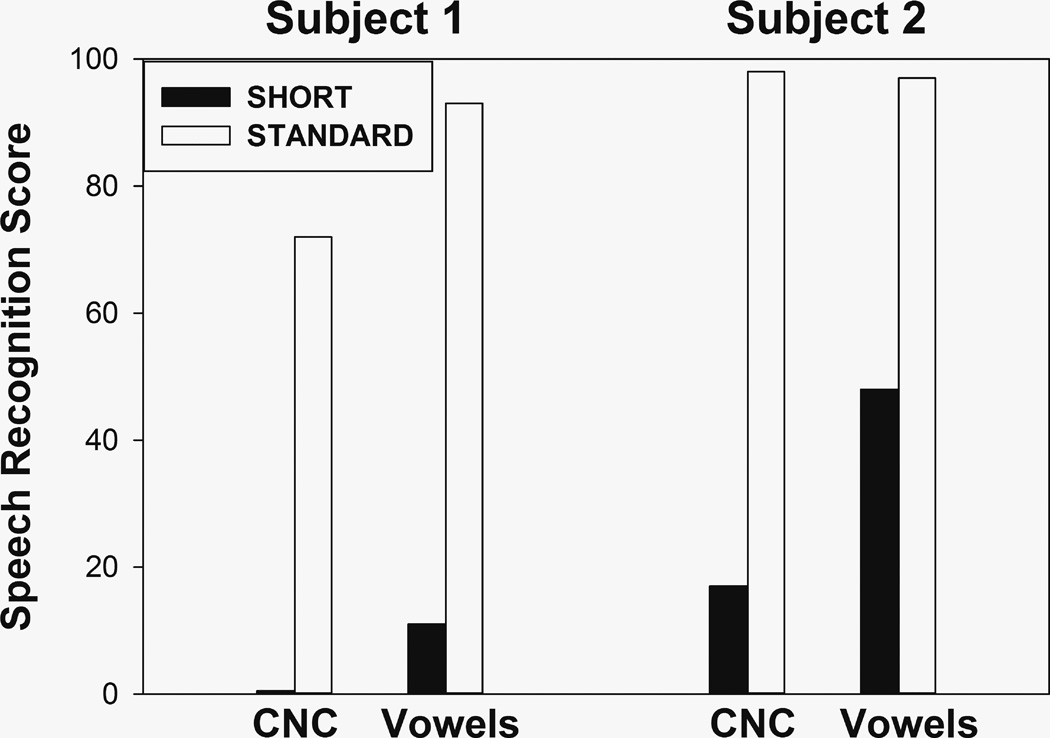
Method 3: Speech perception scores obtained from each ear
Vowel and word identification scores are shown for both subjects, separately for each ear, in Figure 7. It is quite apparent that scores are much higher in the standard insertion ear than in the short insertion ear for both subjects, and all these differences are significant (p<0.001, binomial test). Of course, the differences might well be influenced by factors other than frequency mismatch and perhaps the most obvious factor is the number of channels. It is therefore interesting to examine studies that compared speech perception when using different numbers of channels in the same CI listeners. Fishman et al. [15] tested eleven postlingually deaf adults at least six months post CI activation and found average word identification scores of approximately 21% with four channels and 46% with 20 channels. Scores in an 8-vowel identification test averaged about 53% with four channels and 78% with 20 channels. Consistent results were found by Zeng and Galvin [16] with four subjects who averaged 49% correct in a 12 vowel identification test when using four channels and 78% when using 20 channels. The differences found in the present study were much more pronounced: 0% vs. 72% and 17% vs. 98% for words, and 11% vs. 93%, and 48% vs. 97% for vowels. The main difference between the studies cited above and the present one is that in the former, the conditions with fewer channels were implemented with electrodes that were in the same general region of the cochlea as the conditions that used all channels. Taken together, these results suggest that using four channels instead of twenty results in a drop of speech perception scores. A further drop may be associated with the use of four-channel maps where the stimulated electrodes are in more basal locations of the cochlea. Without being conclusive, these speech scores are consistent with the possibility that the adaptation to the FAT in the short insertion electrode had not been complete for either subject, and thus support the incomplete adaptation hypothesis. Remember, however, that there has to be a reason why insertion was incomplete in the case of Subject 1 (e.g., fibrotic growth, ossification) and that pathology within the cochlea requires that results be interpreted with caution.
FIGURE 7.
Word and vowel identification scores in the short—insertion and the standard—insertion ears.
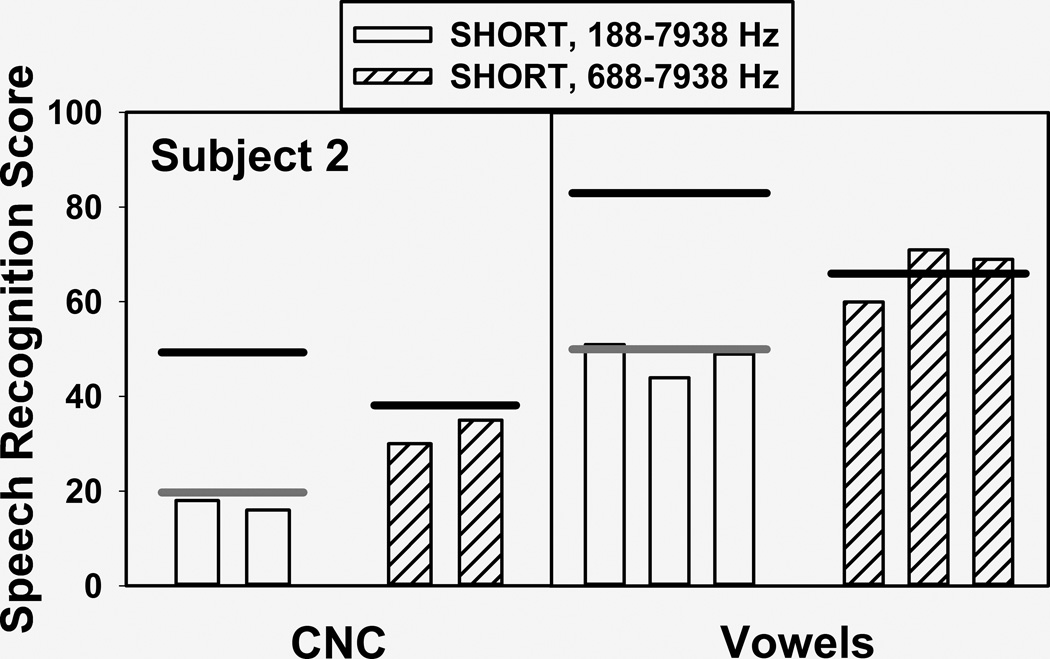
Figure 8 shows vowel and word identification scores obtained from subject 2 with the standard FAT (188–7,938 Hz) and the self-selected FAT (688–7,938 Hz) in the short insertion ear. Even though at the time of testing she had had extensive experience with the standard FAT and very limited exposure to the self-selected FAT, scores were significantly higher with the latter (p<0.01 for both vowels and word, binomial test). Not shown in the figure are word scores obtained in later sessions after she had a few months of everyday experience with the self-selected FAT, where the advantage for this map increased from 32% vs. 17% (which are the average CNC word scores obtained with each FAT, as shown in Figure 8) to 39% vs. 18%, and 29% vs. 9% when using a more difficult word identification test.
FIGURE 8.
Word and vowel identification scores obtained from subject 2 with the standard FAT (188–7,938 Hz) and the self-selected FAT (688–7,938 Hz).
Mathematical modeling
The horizontal black and gray lines in Figure 8 summarize the results of the mathematical modeling. The black lines on top of the hashed bars represent model output for the self-selected FAT, assuming complete adaptation (in other words, zero response bias) to that particular FAT. This was obtained with a JND value of 0.07 (measured as a fraction of the distance between two adjacent electrodes) for the F1 and F2 dimensions. The match between predicted and observed values was reasonably good but not necessarily remarkable. More interesting are the predictions for the standard FAT, represented by the black band on top of the white bars in Figure 8. These were obtained with zero degrees of freedom, using the same parameters that were used for predicting the scores with the self-selected FAT and assuming complete adaptation to the standard FAT. As can be observed, the predicted scores are a gross overestimate of the actual data (for example, 83% vs. 48% in the case of vowel identification). In fact, speech perception scores were predicted to be significantly higher for the standard FAT than for the self-selected FAT under conditions of complete adaptation. However, this is clearly not what happened. In order to obtain a reasonable fit for the standard FAT scores it was necessary to assume a response bias of 0.2 (measured as a fraction of the distance between two adjacent electrodes). This nonzero value of bias supports the incomplete adaptation hypothesis.
DISCUSSION
Taken together, these results show that the human frequency-to-place map is not completely hardwired and may be modified by experience, even in adult listeners, and even in the case of extreme tonotopic mismatches. In particular the pitch matching results provide strong support for the adaptation hypothesis. This is consistent with previous results, most notably the body of work by Reiss and colleagues and in particular a case study that was conducted with subject 2 prior to her participation in the present study [17].
However, such plasticity seems to have limitations and these are consistent with the incomplete adaptation hypothesis. Both subjects were able to adapt in order to reduce spectral discrepancies among ears, but in both cases such adaptation was incomplete. The data suggest that when the required remapping involves both a shift along the cochlea as well as an expansion/compression of one of the cochlear maps, some listeners may be more successful with the shift than with the expansion and even the relatively successful shifts do not result in perfect matches to the CI frequency allocations.
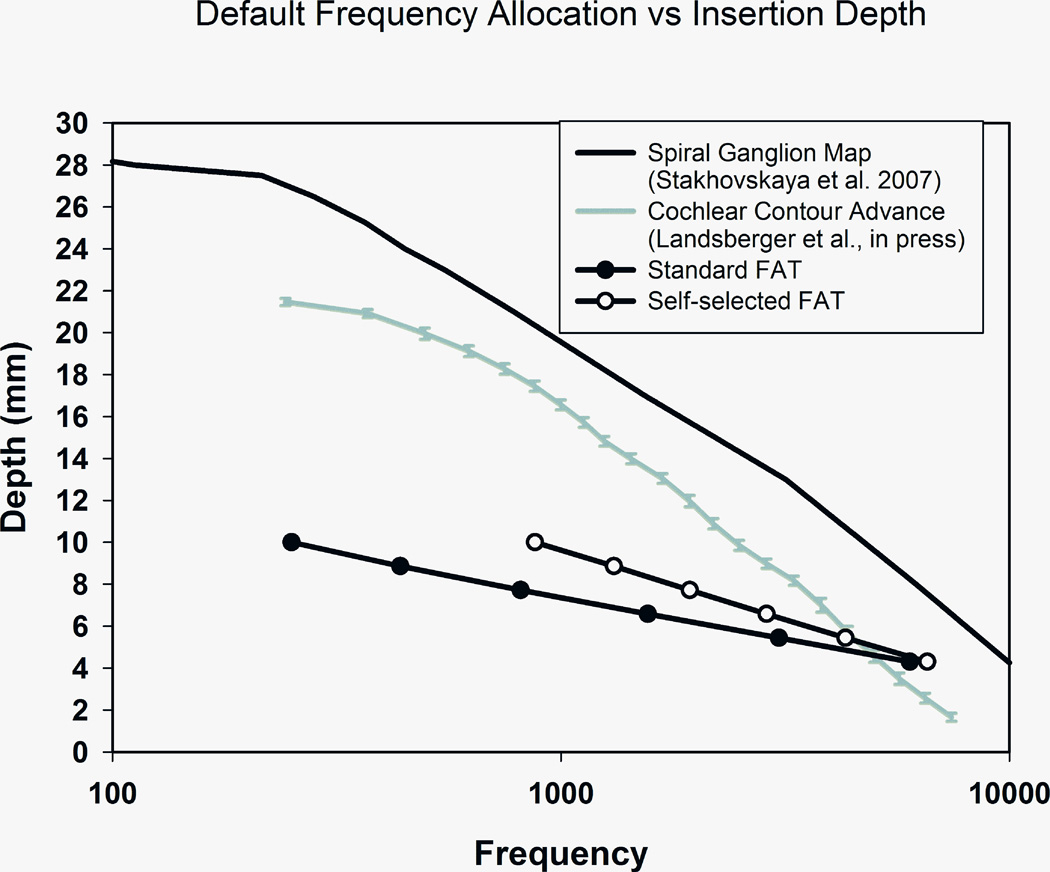
It is particularly interesting to examine in more detail the results that subject 2 obtained with the standard and self-selected FATs. It may be surprising that the self-selected FAT, which excluded an important part of the speech frequency range (188–688 Hz), resulted in improved speech perception. A possible explanation is graphically described in Figure 9. The black line on top of the graph was derived from Stakhovskaya et al. [18] and it shows a frequency-to-place map in the human cochlea. The×-axis is an estimate of the characteristic frequency of the spiral ganglion cells that would be stimulated by an electrode located in a given position along the basilar membrane, indicated in the y –axis as mm of distance from the round window. The gray line shows the frequency-place curve for the average insertion of a Contour Advance electrode array when using the standard FAT [19]. As can be seen, this line represents a more basal location than the spiral ganglion map curve and lets us appreciate the few millimeters of mismatch that CI users with standard electrode insertions and FATs may have to overcome. The line at the bottom is a similar curve for the short insertion ear when using the standard FAT. The black circles represent the estimated location and the center frequency associated with each electrode. In this case the mismatch is much greater than in the case of a standard electrode array. Lastly, the curve with white circles shows that frequency mismatch is somewhat reduced in the short insertion ear when using the self-selected FAT. This factor may underlie the significant improvement in speech perception that was observed with this FAT.
FIGURE 9.
Cochlear distance vs. frequency curves for stimulation of the human spiral ganglion (black curve), the average location of Contour Advance electrodes using the standard FAT (gray curve), and the location of subject 2’s electrodes in the short—insertion ear using the standard FAT (black circles) and the self—selected FAT (white circles).
As discussed above, both the adaptation hypothesis and the incomplete adaptation hypothesis received substantial support by the battery of tests and analysis methods employed in the present study. This may have clinical implications for cases of bilateral cochlear implantation where there is a certain amount of frequency mismatch across ears, whether due to differences in electrode location, cochlear size, or neural survival across ears. It seems likely that small or moderate amounts of frequency mismatch may be overcome by auditory plasticity and may not require any departures from current clinical practice. On the other hand, greater amounts of mismatch may exceed a patient’s abilty to adapt and may require additional measures. One such measure, suggested by the present results, is the use of a self-selected FAT than may help minimize frequency mismatch. Another possible measure may be the reimplantation of the short insertion ear with a longer electrode, if that is surgically feasible.
If both hypotheses were true there may be possible implications for unilateral CI users as well. Patients with a hybrid CI who lose all residual hearing may have their speech processor reprogrammed with a standard FAT and rely on adaptation to improve their speech perception. To the extent that adaptation to frequency mismatch may be incomplete, these patients might also benefit from FAT self-selection of from reimplantation using a longer array [20].
In summary, a multi-pronged examination of pitch and speech perception in two unique cases helped shed light on the extent and the limitations of human auditory plasticity. In turn, this knowledge has implications for clinical practice and may help guide the search for optimal parameter settings in users of auditory prostheses.
ACKNOWLEDGMENTS
This work was supported by NIH grants R01—DC03937 (PI: Svirsky) and R00-DC05093 (PI: Fitzgerald), as well as by Cochlear Americas (which covered expenses for subject 2). We appreciate Aaron Parkinson’s help with subject recruitment and Mahan Azadpour and Annette Zeman’s help with manuscript preparation, as well as Ben Guo's help with data collection.
Contributor Information
Mario A. Svirsky, New York University School of Medicine, Department of Otolaryngology-HNS
Matthew B. Fitzgerald, New York University School of Medicine, Department of Otolaryngology-HNS
Elad Sagi, New York University School of Medicine, Department of Otolaryngology-HNS.
E. Katelyn Glassman, New York University School of Medicine, Department of Otolaryngology-HNS.
LIST OF REFERENCES
- 1.Harnsberger JD, Svirsky MA, Kaiser AR, Pisoni DB, Wright R, Meyer TA. Perceptual “vowel spaces” of cochlear implant users: Implications for the study of auditory adaptation to spectral shift. J Acoust Soc Am. 2001;109:2135–2145. doi: 10.1121/1.1350403. [DOI] [PMC free article] [PubMed] [Google Scholar]
- 2.McDermott H, Sucher C, Simpson A. Electro-acoustic stimulation. Audiol Neurootol. 2009;14:2–7. doi: 10.1159/000206489. [DOI] [PubMed] [Google Scholar]
- 3.Carlyon RP, Macherey O, Frijns JH, Axon PR, Kalkman RK, Boyle P, et al. Pitch comparisons between electrical stimulation of a cochlear implant and acoustic stimuli presented to a normal-hearing contralateral ear. J Assoc Res Otolaryngol. 2010;11:625–640. doi: 10.1007/s10162-010-0222-7. [DOI] [PMC free article] [PubMed] [Google Scholar]
- 4.Zeng FG, Tang Q, Lu T. Abnormal Pitch Perception Produced by Cochlear Implant Stimulation. PloS One. 2014;9:e88662. doi: 10.1371/journal.pone.0088662. [DOI] [PMC free article] [PubMed] [Google Scholar]
- 5.Svirsky MA, Silveira A, Suarez H, Neuburger H, Lai TT, Simmons PM. Auditory learning and adaptation after cochlear implantation: a preliminary study of discrimination and labeling of vowel sounds by cochlear implant users. Acta Otolaryngol. 2001;121:262–265. doi: 10.1080/000164801300043767. [DOI] [PubMed] [Google Scholar]
- 6.Svirsky MA, Silveira A, Neuburger H, Teoh SW, Suarez H. Long-term auditory adaptation to a modified peripheral frequency map. Acta Otolaryngol. 2004;124:381–386. [PubMed] [Google Scholar]
- 7.Reiss LA, Turner CW, Erenberg SR, Gantz BJ. Changes in pitch with a cochlear implant over time. J Assoc Res Otolaryngol. 2007;8:241–257. doi: 10.1007/s10162-007-0077-8. [DOI] [PMC free article] [PubMed] [Google Scholar]
- 8.Reiss LAJ, Turner CW, Karsten SA, Gantz BJ. Plasticity in human pitch perception induced by tonotopically mismatched electro-acoustic stimulation. Neuroscience. 2014;256:43–52. doi: 10.1016/j.neuroscience.2013.10.024. [DOI] [PMC free article] [PubMed] [Google Scholar]
- 9.Jethanamest D, Tan C-T, Fitzgerald MB, Svirsky MA. A new software tool to optimize frequency table selection for cochlear implants. Otol Neurotol. 2010;31:1242–1247. doi: 10.1097/MAO.0b013e3181f2063e. [DOI] [PMC free article] [PubMed] [Google Scholar]
- 10.Svirsky MA. Mathematical modeling of vowel perception by users of analog multichannel cochlear implants: Temporal and channel-amplitude cues. J Acoust Soc Am. 2000;107:1521–1529. doi: 10.1121/1.428459. [DOI] [PubMed] [Google Scholar]
- 11.Sagi E, Meyer TA, Kaiser AR, Teoh S-W, Svirsky MA. A mathematical model of vowel identification by users of cochlear implants. J Acoust Soc Am. 2010;127:1069–1083. doi: 10.1121/1.3277215. [DOI] [PMC free article] [PubMed] [Google Scholar]
- 12.Sagi E, Fu Q-J, Galvin JJ, Svirsky MA. A model of incomplete adaptation to a severely shifted frequency-to-electrode mapping by cochlear implant users. J Assoc Res Otolaryngol. 2010;11:69–78. doi: 10.1007/s10162-009-0187-6. [DOI] [PMC free article] [PubMed] [Google Scholar]
- 13.Svirsky MA, Sagi E, Meyer TA, Kaiser AR, Teoh S-W. A mathematical model of medial consonant identification by cochlear implant users. J Acoust Soc Am. 2011;129:2191–2200. doi: 10.1121/1.3531806. [DOI] [PMC free article] [PubMed] [Google Scholar]
- 14.Rabinowitz WM, Eddington DK, Delhorne LA, Cuneo PA. Relations among different measures of speech reception in subjects using a cochlear implant. J Acoust Soc Am. 1992;92:1869–1881. doi: 10.1121/1.405252. [DOI] [PubMed] [Google Scholar]
- 15.Fishman KE, Shannon RV, Slattery WH. Speech recognition as a function of the number of electrodes used in the SPEAK cochlear implant speech processor. J Speech Lang Hear Res. 1997;40:1201–1215. doi: 10.1044/jslhr.4005.1201. [DOI] [PubMed] [Google Scholar]
- 16.Zeng FG, Galvin JJ. Amplitude mapping and phoneme recognition in cochlear implant listeners. Ear Hear. 1999;20:60–74. doi: 10.1097/00003446-199902000-00006. [DOI] [PubMed] [Google Scholar]
- 17.Reiss LA, Lowder MW, Karsten SA, Turner CW, Gantz BJ. Effects of extreme tonotopic mismatches between bilateral cochlear implants on electric pitch perception: A case study. Ear Hear. 2011;32:536. doi: 10.1097/AUD.0b013e31820c81b0. [DOI] [PMC free article] [PubMed] [Google Scholar]
- 18.Stakhovskaya O, Sridhar D, Bonham BH, Leake PA. Frequency map for the human cochlear spiral ganglion: Implications for cochlear implants. J Assoc Res Otolaryngol. 2007;8:220–233. doi: 10.1007/s10162-007-0076-9. [DOI] [PMC free article] [PubMed] [Google Scholar]
- 19.Landsberger D, Svrakic M, Roland JT, Svirsky M. The Relationship between insertion angles, default frequency allocations, and spiral ganglion place pitch in cochlear implants. Ear Hearing. doi: 10.1097/AUD.0000000000000163. in press. [DOI] [PMC free article] [PubMed] [Google Scholar]
- 20.Fitzgerald MB, Sagi E, Jackson M, Shapiro WH, Roland JT, Jr, Waltzman SB, Svirsky MA. Reimplantation of hybrid cochlear implant users with a full-length electrode after loss of residual hearing. Otol Neurotol. 2008;29(2):168–173. doi: 10.1097/mao.0b013e31815c4875. [DOI] [PubMed] [Google Scholar]


