Abstract
Calcium (Ca2+) waves provide a complement to neuronal electrical signaling, forming a key part of a neuron’s second messenger system. We developed a reaction-diffusion model of an apical dendrite with diffusible inositol triphosphate (IP3), diffusible Ca2+, IP3 receptors (IP3Rs), endoplasmic reticulum (ER) Ca2+ leak, and ER pump (SERCA) on ER. Ca2+ is released from ER stores via IP3Rs upon binding of IP3 and Ca2+. This results in Ca2+-induced-Ca2+-release (CICR) and increases Ca2+ spread. At least two modes of Ca2+ wave spread have been suggested: a continuous mode based on presumed relative homogeneity of ER within the cell; and a pseudo-saltatory model where Ca2+ regeneration occurs at discrete points with diffusion between them. We compared the effects of three patterns of hypothesized IP3R distribution: 1. continuous homogeneous ER, 2. hotspots with increased IP3R density (IP3R hotspots), 3. areas of increased ER density (ER stacks). All three modes produced Ca2+ waves with velocities similar to those measured in vitro (~50–90µm /sec). Continuous ER showed high sensitivity to IP3R density increases, with time to onset reduced and speed increased. Increases in SERCA density resulted in opposite effects. The measures were sensitive to changes in density and spacing of IP3R hotspots and stacks. Increasing the apparent diffusion coefficient of Ca2+ substantially increased wave speed. An extended electrochemical model, including voltage gated calcium channels and AMPA synapses, demonstrated that membrane priming via AMPA stimulation enhances subsequent Ca2+ wave amplitude and duration. Our modeling suggests that pharmacological targeting of IP3Rs and SERCA could allow modulation of Ca2+ wave propagation in diseases where Ca2+ dysregulation has been implicated.
Keywords: Calcium waves, computer model, SERCA, IP3 receptor, reaction-diffusion, calcium, electrochemical
1 Introduction
Calcium (Ca2+) is an important second messenger signal in many cell types, with diverse roles, from fertilization (Busa and Nuccitelli, 1985; Kretsinger, 1980) to regulating gene expression (West et al., 2001). Ca2+ is involved in triggering destructive processes including apoptosis (Orrenius et al., 2003) and ischemia (Lipton, 1999). Cells, including neurons, therefore regulate cytosolic Ca2+ concentration via buffers (Stern, 1992) and sequestration into mitochondria (Gunter et al., 2004) or endoplasmic reticulum (ER) (Berridge, 1998). In neurons, sequestration is modulated by neuronal activity (Pozzo-Miller et al., 1997), and elevated Ca2+ opens certain ion channels. There is therefore a bidirectional interaction between chemical signaling and electrophysiology (Blackwell, 2013; De Schutter and Smolen, 1998; De Schutter, 2008).
Ca2+ is heavily buffered but travels long distances (>100 µm) to reach its targets. This poses a temporal problem if relying purely on diffusion. Ca2+ waves increase the rapidity of Ca2+ spread via Ca2+-induced-Ca2+-release (CICR). CICR occurs in neurons and requires stores of Ca2+ held in the ER. ER is distributed throughout the cytosol in a connected way, through the dendrites and dendritic spines (Harris, 1994; Spacek and Harris, 1997). The ER SERCA pump pushes Ca2+ from the cytosol into the ER. When triggered by IP3 and Ca2+, the ER IP3 receptors (IP3Rs) open and release some of the ER’s Ca2+ into the cytosol. Regions of elevated Ca2+ then spread throughout portions of the dendritic tree (Ross et al., 2005).
Understanding Ca2+ wave modulation is difficult since cytosolic Ca2+ changes over time and passes between different intracellular compartments and extracellular space (Fall et al., 2004; Wagner et al., 2004). Adding to this complexity is the nonuniform distribution of IP3Rs, with clusters forming where local variations in IP3R or ER is heightened (Fitzpatrick et al., 2009).
At least two modes of Ca2+ wave spread have been identified: a continuous model that depends on continuous underlying substrate of regenerative potential, and a pseudosaltatory model where Ca2+ regeneration occurs at discrete points with diffusion between them. (We call it pseudo-saltatory here to distinguish from classical saltatory conduction in myelinated fibers, involving capacitative effects in addition to electrodiffusion.) It has been hypothesized that these two modes produce downstream functional differences in dendrites, where many mechanisms are responsive to the level of Ca2+, for example Ih (Winograd et al., 2008; Neymotin et al., 2013, 2014) and synaptic plasticity (Kotaleski and Blackwell, 2010).
To investigate Ca2+ waves in a spatiotemporal context relevant for neurons, we developed a model of Ca2+ waves which includes cytosol and ER. Baseline cytosolic Ca2+ and IP3 concentration are set to low values. The model includes ER SERCA pumps (pump Ca2+ from cytosol into ER), leak channels (Ca2+ leaks out of ER), and IP3Rs. Our model generates Ca2+ waves with realistic physiological properties. We use our model to investigate how IP3R density and clustering, alterations in SERCA density, alterations in ER stacking, and Ca2+ diffusibility alter waves. An additional complexity arises when we consider coupling to plasma membrane calcium channels which will contribute additional calcium flux triggered by rapidly-spreading regenerative voltage changes on the membrane. We have therefore also assessed our results in an extended electrochemical model, which included a variety of ion channels (leak, voltage-dependent calcium channels: VGCC, potassium, sodium) with synaptic activation. We used this model to demonstrate how priming due to AMPA-mediated membrane depolarization would enhance subsequent Ca2+ wave amplitude and duration.
2 Materials and methods
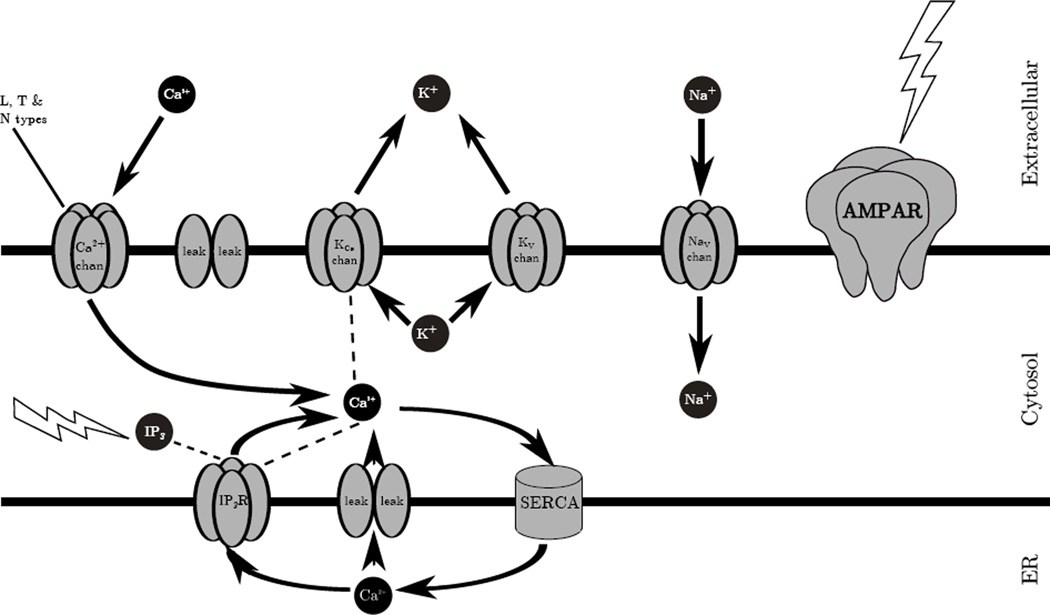
All simulations were run in the NEURON (version 7.3) simulation environment (Carnevale and Hines, 2006). NEURON has traditionally supported electrical modeling but has recently been extended to support reaction-diffusion (R×D) modeling as well (McDougal et al., 2013a,b). The full 1D R×D calcium wave model of the neuronal dendrite (depicted in Fig. 1) and the data analysis source-code is available on ModelDB (Peterson et al., 1996; Hines et al., 2004) (http://senselab.med.yale.edu/modeldb).
Figure 1.
Schematic of the dendrite model (1000 µm length; 1 µm diameter) showing the extracellular space, cytosol and endoplasmic reticulum (ER). Thick black lines represent the plasma and ER membranes. The extracellular space provides a source and sink for multiple molecules. Ca2+, Na+, K+, and IP3 are depicted as black circles. These molecules enter and exit the dendrite and its sub-compartments via the channels/receptors (gray pores) in directions indicated by arrows. SERCA pump moves cytosolic Ca2+ into the ER. Lightning symbols represent stimulus locations (AMPA-mediated depolarization; mGluR-mediated IP3 augmentation). Dotted lines between molecules and receptors indicate the receptor is modulated by the molecule (e.g., Ca2+ activates KCa and IP3R).
Our Ca2+ dynamics are derived from Wagner et al. (2004), a spatial variant of Li and Rinzel (1994). Parameters are as in Table 1. We modeled a one-dimensional R×D system of intracellular neuronal Ca2+ waves in an unbranched apical dendrite of a hippocampal pyramidal neuron (length of 1000 µm and diameter of 1 µm). Within the dendrite, we modeled cytosolic and endoplasmic reticulum (ER) compartments by using a fractional volume for each: suppose that for a given cell volume, fER denotes the fraction occupied by the ER (0.17), and fcyt denotes the fraction occupied by the cytosol (0.83). Necessarily fcyt + fER ≤ 1. The inequality is strict if other structures are present, such as mitochondria.
Table 1.
Baseline parameters for the Ca2+ wave model.
| fcyt = 0.83 | |
| fER = 0.17 | |
| p̄IP3R = 120400.0 molecules/mM/ms | |
| kIP3 = 0.00013 mM | |
| kact = 0.0004 mM | |
| kinh = 0.0019 mM | |
| p̄leakER = 18.06 molecules/mM/ms | |
| p̄serca = 1.9565 molecules/ms | |
| kserca = 0.0001 mM | |
| τIP3R = 400 ms | |
| dIP3 = 1.415 μm2/ms |
ER-based calcium dynamics were previously modeled (De Young and Keizer, 1992). This previous work showed by a time-scale analysis that the qualitative dynamics of IP3 receptors (IP3Rs) could be represented by only considering the slow Ca2+ inactivation binding site state (Li and Rinzel, 1994). This work formed the basis of much subsequent work in intracellular Ca2+ dynamics (Fall and Rinzel, 2006; Fall et al., 2004; Hartsfield, 2005; Peercy, 2008; Wagner et al., 2004). The model presented here is a variant that neglects dynamic IP3 production (Wagner et al., 2004).
The ER Ca2+ model involves IP3Rs and SERCA pumps. As with the plasma membrane model, we combine the net effects of all other channels on the ER into a leak channel. We denote by JIP3R, JSERCA, and JleakER the mass flux per unit volume due to the IP3R, SERCA pump, and leak channels, respectively. Dividing the mass flux by the volume fraction gives the change in concentration.
State Variables
Cytosolic Ca2+ concentration, ER Ca2+ concentration, IP3 concentration, and IP3R gating are denoted by , IP3, and hIP3R, respectively.
| (1) |
| (2) |
| (3) |
| (4) |
where cionic denotes the net flux into the cytosol due to ion channels on the cell membrane and depends on both space and time. The first terms of the right hand sides is the contribution from diffusion. IP3 diffusion within the cytosol is passive. Equation (1) allows for the coupling between Ca2+ that enters the cytosol via the ion channels on the cell membrane and the intracellular Ca2+ which is shuttled into ER via SERCA pumps.
Fluxes
Flux from the IP3R, SERCA pump, and leak channels are denoted by JIP3R, JSERCA, and JleakER, respectively.
| (5) |
| (6) |
| (7) |
Here, Ξ = NA/1018 ≈ 602214.129, and is the number of molecules in a cubic micron at a concentration of 1 mM, where NA is the Avogadro constant. The SERCA pump is a pump rather than a channel and so is modeled with Hill-type dynamics. The form of the fluxes JIP3R and JleakER parallels the forms for ion channels in the Hodgkin-Huxley equations. Leak is ungated whereas JIP3R is gated: mIP3R and nIP3R are fast gating variables depending on IP3 and Ca2+, and hIP3R is the slow Ca2+ inactivation gating variable.
| (8) |
| (9) |
| (10) |
Initial values of , CAVG, IP3, and hIP3R were set to 0.0001 mM, 0.0017 mM, 0.1 mM, and 0.8, respectively. was then adjusted based on the cytosolic and ER fractional volumes according to:
This model supports both bistable and excitable waves. Both types of waves have been observed in the Xenopus oocyte (Fontanilla and Nuccitelli, 1998; Lechleiter et al., 1991), although not clearly defined in neurons.
Electrical dynamics
Electrical dynamics were utilized for the subset of simulations described in the final figure. Electrical dynamics in the dendrite followed the standard parallel conductance model. Ion channels were based on a prior model of a hippocampal pyramidal cell (Safiulina et al., 2010) (http://senselab.med.yale.edu/modeldb/ShowModel.asp?model=126814) and included L-, N-, and T-type Ca2+ channels, which allowed extracellular calcium to enter the dendrite at different voltage levels (McCormick and Huguenard, 1992; Kay and Wong, 1987). The equations for the ion channels follow, leak, Na+ and K+ currents were represented by the conductance approximation: Iion = gion · (V − Eion) (g conductance; E reversal potential) using ENa = 50 mV; Ek = −77 mV; Eleak= −64 mV; (gleak = 39.4 · 10−6 S/cm2), while the Goldman-Hodgkin-Katz (GHK) flux equation was used for Ca2+ currents: ICa = pCa · GHKCa (p permeability). Channel dynamics were corrected for temperature by a Q10 using the factor of with T=37°Celsius and 25° was taken to be the temperature at which the experiment was done. Conductances and activation curves were not corrected for temperature (Iftinca et al., 2006). Voltage sensitive channels largely followed variants on the Hodgkin-Huxley formalism, whereby using steady-state value: , the τx forms either
were where x is m or n for an activation variable and h for an inactivation variable. F is Faraday’s constant; R is the gas constant. Variations on this scheme are noted below.
L-type Ca2+ channel: with p̄L = 10−6cm/s; hL (inactivation) was Ca2+ dependent: with ki = 0.001 mM; ; β∞ = 0.29 · exp(−V/10.86); τEQN2 with ατ = exp(0.0378 · 2 · (V − 4)), βτ = exp(0.0378 · 2 · 0.1 · (V − 4)); a0=0.1; Q10=5.
T-type Ca2+ channel: with p̄T = 10−6cm/s; ; β∞ = 0.009 · exp(−V/22.03); τEQN2 with ατ = exp(0.0378 · 2 · (V − (−28))); βτ = exp(0.0378 · 2 · 0.1 · (V − (−28))); hT: α∞ = 10−6 · exp(−V/16.26); ; τEQN2 with ατ = exp(0.0378 · 3.5 · (V − (−75))); βτ = exp(0.0378 · 3.5 · 0.6 · (V − (−75))); a0=0.04; Q10=5.
N-type Ca2+ channel: with p̄N = 10−6cm/s; mN used α∞ = 0.1967 · (−V +19.88)/(exp((−V +19.88)/10.0)−1.0); β∞ = 0.046 · exp(−V/20.73); τEQN2 with ατ = exp(0.0378 · 2 · (V − (−14))); βτ = exp(0.0378 · 2 · 0.1 · (V − (−14))); hN following: α∞ = 1.6 · 10−4 · exp(−V/48.4); β∞ = 1/(exp((−V +39.0)/10)+1); constant τh = 80; with ; a0=0.03, Q10=5.
The model also contained: a transient sodium channel INa and a delayed rectifier channel IK−DR to allow for action potential generation; a calcium-dependent potassium channel which hyperpolarized the cell after calcium influx; and an A-type potassium channel for rapid inactivation. Equations for these channels follow.
Na channel: with ḡNa = 0.11 S/cm2; mNa using τEQN1 with: α = 0.4 · (V −(−30+6))/(1−exp(−(V −(−30+6)/7.2))); β = 0.124 · (−V − (30 − 6))/(1 − exp(−(V − (30 − 6)))/7.2) hNa with special form and using τEQN1 with ατ = 0.03 · (V −(−45+6))/(1−exp(−(V −(−45+6))/1.5)) and βτ = 0.01·(V −(45−6))/(1− exp(−(V − (45 − 6))/1.5)); Q10=2. sNa: s∞(V) = 1; τEQN2 with ατ = exp(10−3 · 12 · (V + 54) · 9.648 · 104/(8.315 · (273.16 + T))) and βτ = exp(10−3 · 12 · 0.2 · (V + 54) · 9.648 · 104/(8.315 · (273.16 + T))).
Delayed rectifier K channel: gK−DR = ḡK−DR · nK−DR where ḡK−DR = 0.01 S/cm2; nK−DR following an atypical steady-state: with α = exp(10−3 · −3 · (V − 19) · 9.648·104/(8.315 · (273.16+T))) using the same α in τEQN1 with β = exp(10−3 · −3 · 0.7 · (V − 19) · 9.648 · 104/(8.315 · (273.16 + T))); a0=0.02; Q10=1.
BK-type Ca2+dependent potassium channel (KCa): gKCa = ḡKCa · oKCa with ḡKCa = 0.009 S/cm2; oKCa: ; with k1 = 0.48·10−3; k2 = 0.13·10−6; using τEQN1.
A-type potassium channel, KA: gA = ḡA · nA · lA where ḡA = 0.02 S/cm2; nA with τEQN2 and an atypical steady-state value: with α = exp(10−3·ζ (V) · (V − 17) · 9.648 · 104/(8.315 · (273.16 + T))); βn(V) = exp(10−3 · ζ(V) · 0.55 · (V − 17) · 9.648 · 104/(8.315 · (273.16+T))); ζ(V) = −1.5+(−1/(1+exp((V +34)/5))); a0=0.05; Q10=5. lA: with steady-state: ; α = exp(10−3 · 3 · (V + 50) · 9.648 · 104/(8.315 · (273.16 + T))); time-constant: τ = 0.26 · (V + 44) · qt; Q10=1.
Synapses
The AMPA receptor was modeled with a double-exponential mechanism: rise 0.05 ms, decay 5.3 ms, EAMPA 0 mV. A single AMPA synapse was placed at 500 µm – midway on the dendrite; synaptic weight = 0.5 µS. The metabotropic synapse was not modeled in detail but was given as a local 12.5× increase in IP3 (1.25 µM) in a 4 micron segment at the same location.
Simulation variations
In one set of simulations, we changed the density of IP3R and SERCA, by scaling p̄IP3R and p̄serca, respectively. IP3R hotspots were modeled by scaling p̄IP3R at discrete locations, while keeping IP3R density in between the hotspots at 0.8× baseline IP3R density. ER stacks were simulated by scaling p̄IP3R, p̄serca, and p̄leakER simultaneously, while keeping ER density in between the stacks at 0.8× baseline density. Changes in Ca2+ buffering were simulated by scaling the Ca2+ diffusion coefficients, and , in equal amounts. We also modulated dIP3 in a set of simulations. The range of parameter values examined were constrained to generate Ca2+ waves with wave features (onset, speed, duration, amplitude) that were around ranges for experimentally-observed limits in neurons (Nakamura et al., 1999; Ross et al., 2005; Fitzpatrick et al., 2009).
Electrochemical simulation variations
One set of simulations (Fig. 11) was run with the electrical dynamics (see Electrical dynamics above) to determine how AMPA-ergic stimulation’s alteration of membrane potential prior to an IP3 stimulus impacts the subsequent Ca2+ waves. Simulations were run for 12 s. Background IP3 concentration in these simulations was set between 0–0.01 mM to prevent spontaneous oscillations. AMPA activations (150 spikes with interspike interval of 25 ms) finished 250 ms prior to IP3 stimulus (amplitude: 2.5 mM).
Figure 11.
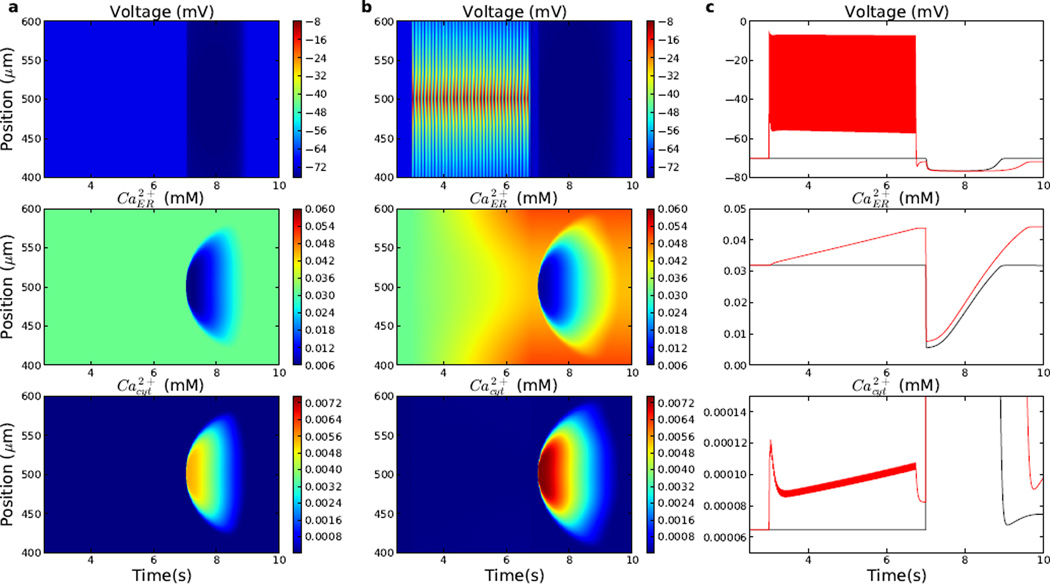
Electrical stimulation with increased number of AMPA activations enhances Ca2+ waves induced by IP3 (2.5 mM at 7 s). (a) Control simulation: Ca2+ wave with no AMPA inputs prior to the IP3 stimulus. (b) Ca2+ wave with train of 150 AMPA inputs (onset: 3 s; interspike interval: 25 ms) prior to the IP3 stimulus. (c) Comparison of voltage (top), ER Ca2+ (middle), and cytosolic Ca2+ (bottom) in control (black) and simulation with 150 AMPA inputs (red).
Data analysis
Ca2+ and IP3 concentrations were recorded in a 3D array using temporal and spatial resolution of 5 ms and 1 µm. Cytosolic Ca2+ wave features were extracted by thresholding the array using an amplitude threshold of 2× baseline cytosolic Ca2+ concentration (2.5× for the electrical simulations). Wave onset was defined as the delay after IP3 stimulus until the Ca2+ passed threshold. Amplitude was maximum Ca2+ concentration. Speed was calculated using onset time at stimulation location and final onset time at location of wave termination (note that use of final onset time leads to artifactual lowering of wave speed in pathological condition of multiple Ca2+ waves). Duration was calculated as median at each position from wave onset to offset (going below threshold).
3 Results
This study involved over 4800 15–30 second simulations, testing how variations in levels of IP3R density, SERCA density, IP3 hotspots, and ER stacks, altered wave initiation, amplitude, speed, and duration. An additional set of 32 twelve-second simulations were run, testing how the number of AMPA inputs prior to an IP3 stimulus impacted the calcium waves. Simulations were run using the NEURON simulator on Linux on a 2.27 GHz quad-core Intel XEON CPU. Thirty seconds of simulation ran in 1.5–2 minutes, depending on simulation type.
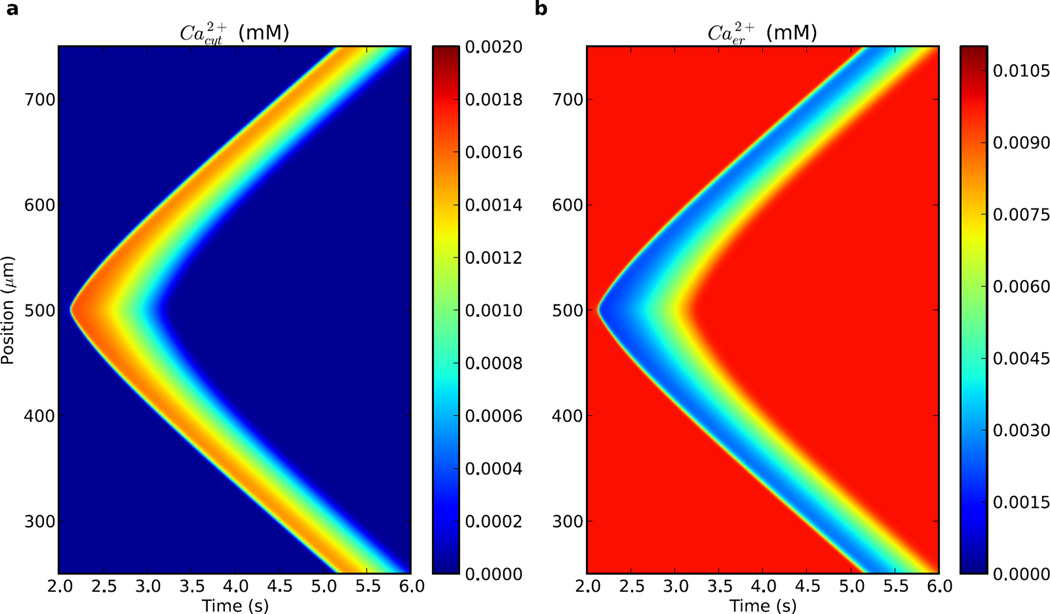
We simulated the arrival of IP3 from a metabotropic receptor activation cascade as an instantaneous augmentation of IP3 concentration to 1.25 µM IP3 (12.5× background) in a 4 micron segment in mid-dendrite (Fig. 2). IP3 then spread gradually along the dendrite, providing a permissive effect for Ca2+ activation of the IP3 receptors (IP3Rs). Activation of IP3Rs permitted release of Ca2+ from the endoplasmic reticulum (ER) stores into the cytosol (Fig. 2a). The elevation in cytosolic Ca2+ was mirrored by a depression in ER Ca2+ as the wave passed (Fig. 2b). The cytosolic Ca2+ wave started once adequate Ca2+ had built up to spillover and activate neighboring IP3Rs and initiate sustained positive feedback of Ca2+ induced-Ca2+-release (CICR). The wave then spread bidirectionally, as Ca2+ and IP3 simultaneously diffused laterally. Ca2+ waves were not able to reverse direction and propagate back towards their source due to an IP3R refractory period provided by inactivation gating. Parameters including dIP3 (1.415 µm2/ms), , p̄IP3R (120400.0 molecules/mM/ms), p̄serca (1.9565 molecules/ms), and p̄leakER (18.06 molecules/mM/ms) were adjusted from modeling (Wagner et al., 2004) and experiments (Allbritton et al., 1992), to produce a wave speed of 77 µm/s, which is comparable to neuronal Ca2+ wave speeds measured experimentally (68±22 µm/s in Nakamura et al. (1999)). These parameters provided our baseline simulation for further parameter explorations. Median Ca2+ elevation lasted ~ 1 s and peaked at 1.6 µM, both also comparable with experimental results (Ross et al., 2005; Fitzpatrick et al., 2009).
Figure 2.
Ca2+ wave propagation with baseline parameters. Elevated IP3 stimulus placed at mid-dendrite (500 µm on y-axis) after 2 s past start of simulation. (a) cytosolic [Ca2+] shows a wave of increased concentration (b) ER [Ca2+] shows a mirror image wave of decreased concentration as Ca2+ is released to cytosol.
3.1 IP3R density modulates excitability
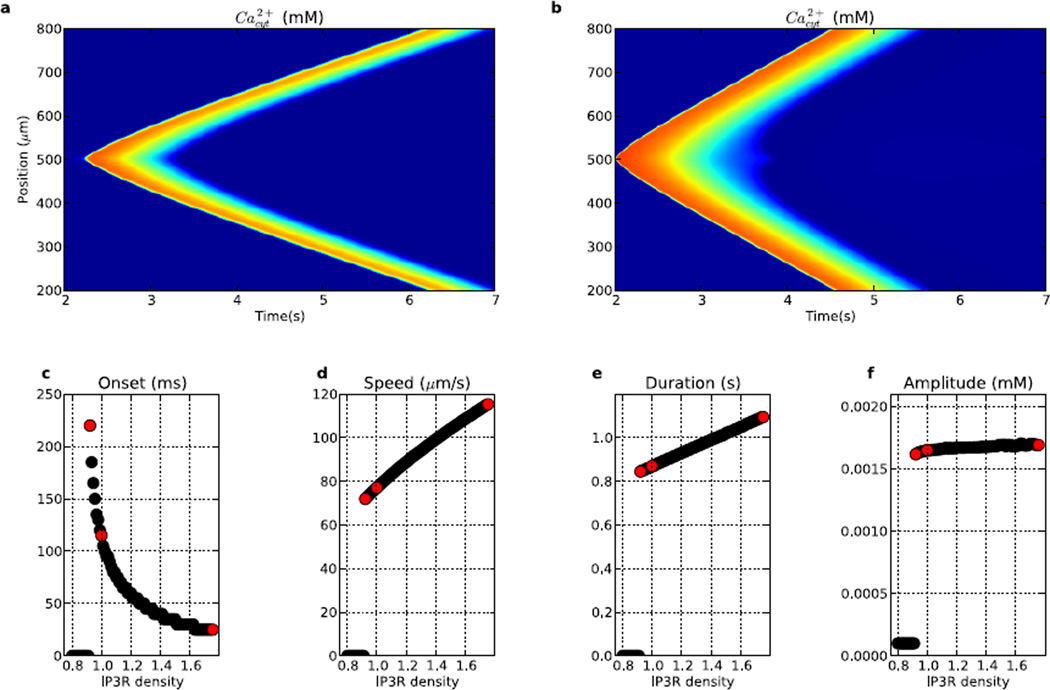
IP3R was necessary for wave generation (Fig. 3). Ca2+ waves did not begin below IP3R density of 92.2% of baseline, when the first wave was obtained (Fig. 3a and left red dots on c,d,e,f). This wave had initiation delays ~100 ms longer compared to the baseline wave (Fig. 2a and middle red dot on Fig. 3c), with only a slightly lowered amplitude, lower speed, and lower duration. The major effect, time to onset, was strongly dependent on IP3R due to the need to gradually source a sufficient amount of Ca2+ to produce enough lateral spillover to initiate a positive feedback cycle, as the lower IP3R density produced a lower total Ca2+ flux from ER to cytosol. ER Ca2+ must also be sourced at a rate that exceeds the reuptake governed by SERCA pumping. With increased density, time to onset decreased rapidly to a low of 25 ms.
Figure 3.
Ca2+ wave propagation is sensitive to the density of IP3R. From left to right, the three red dots in c–f correspond to features of the following Ca2+ waves: (a) low IP3R density (0.9× baseline); baseline IP3R density (Fig. 2); (b) high IP3R density (1.8× baseline). (c) time to wave onset (0 indicates no wave), (d) wave propagation speed, (e) duration (2× Ca2+ elevation; median duration across dendritic locations) (f) peak amplitude. (c–f each show 91 different equally spaced parameter values) (Colorscale in (a) and (b) same as in Fig. 2.)
Speed increased proportionately with increased IP3R (Fig. 3d). At the lowest value, wave speed was 72 µm/s. Speed depended on both the rate of ER sourcing at each point of wave regeneration, and the rate of diffusion required to reach the next set of IP3Rs laterally. Proportionate increase in speed with density was due to the reduced requirement for additional Ca2+ for positive feedback, since less Ca2+ is needed to trigger the release of Ca2+. At each location, IP3R must source adequate Ca2+ not only for positive feedback and spillover, but also to exceed the local sink back into ER provided by the SERCA pump. Ca2+ wave duration and amplitude both had a small positive association with increases in IP3R (Fig. 3e,f), due to the higher density of IP3Rs liberating more Ca2+ for the wave, which then remained elevated longer.
3.2 SERCA opposes IP3R effects
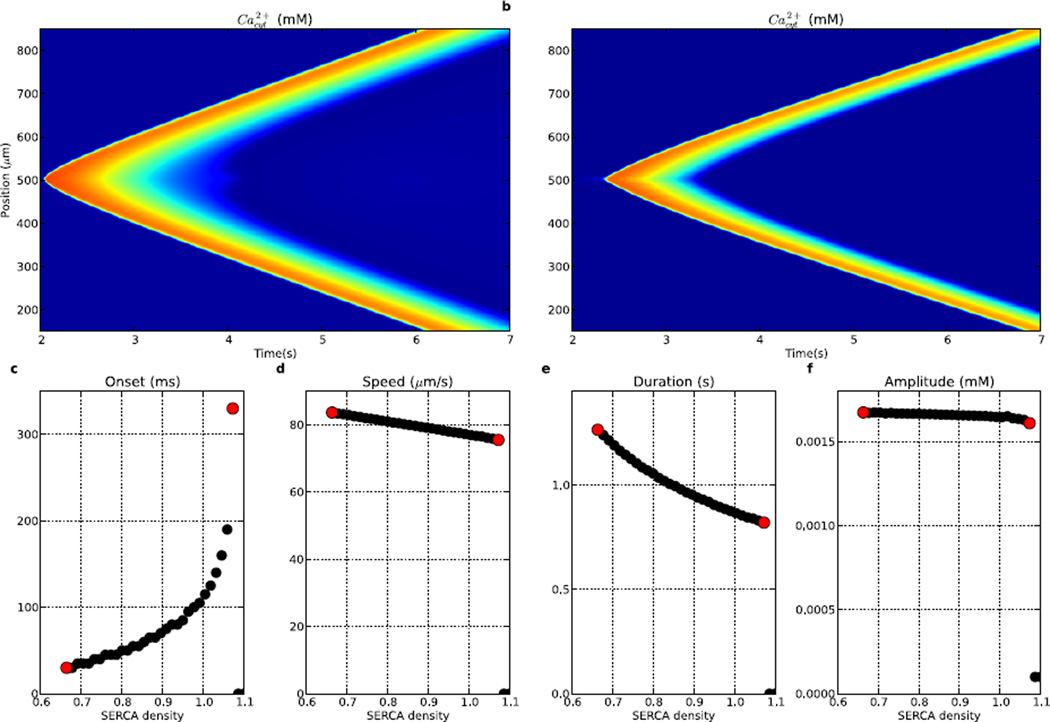
The SERCA pump returns Ca2+ back into the ER, opposing the release from IP3R conductance. Therefore, the parameter dependence of measures was generally opposite to that seen with IP3R density (Fig. 4). The least excitable wave was produced at the highest SERCA density tested (Fig. 4b). The most excitable wave shown here, at 0.66× baseline SERCA (Fig. 4a), was caused by diminished Ca2+ reuptake after release. Further reduction in SERCA resulted first in spontaneous Ca2+ waves and then in simultaneous release from all ER sites at once due to regenerative responses starting from baseline levels (not shown).
Figure 4.
Ca2+ wave propagation is sensitive to the density of SERCA. Tested by varying SERCA density relative to baseline (n = 45). (a) hyper-excitable Ca2+ wave produced with 0.66× baseline SERCA, (b) diminished Ca2+ wave produced with 1.03× baseline SERCA, (c) time to Ca2+ wave onset (0 indicates no wave at the SERCA level), (d) speed, (e) duration (median duration of Ca2+ elevation across dendritic locations), (f) peak amplitude. Left (right) red dots in c–f corresponds to activity shown in (a) ((b)). (Colorscale in (a) and (b) same as in Fig. 2.)
Patterns of wave measures were similar to, but reversed from, those seen with IP3R increase. Onset to the first wave varied from 30 to 330 ms. Shorter onset times were produced by faster Ca2+ accumulation with less reuptake. Similarly, the most excitable wave had a faster propagation speed (84 µm/s) and longer duration due to longer-lasting Ca2+ supporting faster spread. Amplitude showed a slight inverse relationship with increasing SERCA density, due to the higher SERCA reuptake of Ca2+ into ER stores diminishing Ca2+ availability for the wave (Fig. 4f).
At the maximal SERCA consistent with wave propagation, 1.07× baseline, onset to wave initiation was increased dramatically (330 ms), wave speed decreased to ~75 µm/s, and duration decreased to 0.82 s (Fig. 4b). Ca2+ waves were no longer able to initiate at higher levels, as Ca2+ was sucked back into the ER before a Ca2+ wave could ignite.
3.3 IP3R / SERCA balance regulates wave induction
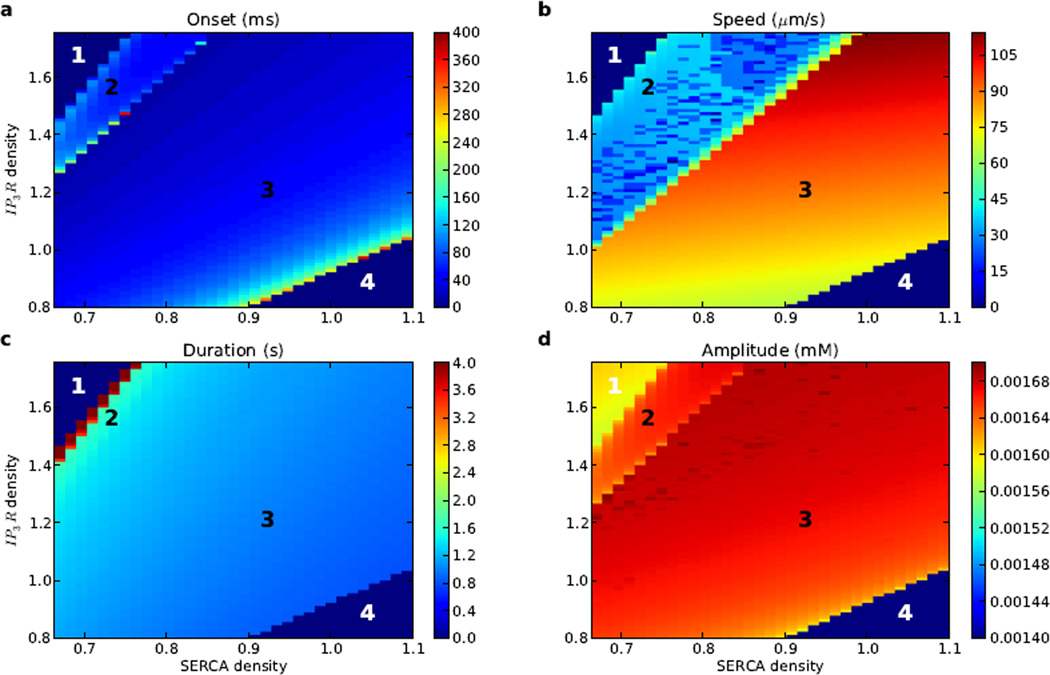
The balance between IP3R and SERCA density determined whether Ca2+ waves could be elicited via IP3 stimulation (Fig. 5). Excessive Ca2+ or insufficient IP3R would not allow a wave (regions 1,4). Maximum Ca2+ level in region 1 was low compared to regions 2 and 3, since ER Ca2+ had already partially leaked out of the ER prior to the IP3 stimulus, and then diffused within the dendrite, preventing the large, localized rise in cytosolic Ca2+ which formed a Ca2+ wave.
Figure 5.
Ca2+ wave propagation is sensitive to density of IP3Rand SERCA. 2838 simulations varying IP3R (86 levels) and SERCA density (33 levels) relative to baseline shows different dynamics: region 1: sustained Ca2+ elevation precluded IP3-evoked wave; region 2: multiple Ca2+ waves; region 3: single Ca2+ wave; region 4: insufficient IP3R to source Ca2+ wave. (a) time to Ca2+ wave onset where present, (b) speed where wave present, (c) duration where wave present (median duration of Ca2+ elevation across dendritic locations), (d) maximum calcium level.
Moving from region 1 towards region 2, IP3R density decreased and SERCA density increased, both of which reduced cytosolic Ca2+, which was no longer sustained above threshold throughout the simulation. This allowed the IP3 stimulus to elicit distinct waves. However, the high levels of IP3R produced multiple waves without return to a subthreshold state. These repetitive waves caused an artifactual lowering of measured wave speed (see Methods for details of calculation). Ca2+ amplitude was higher than in region 1 due to repeated higher elevations of cytosolic Ca2+ compared to balanced fluxes in region 1.
In region 3, there was a match across IP3R and SERCA density, allowing for a single wave to be elicited from the IP3 stimulus. Within this region, for any given SERCA density, an increase in IP3 density increased Ca2+ flux from ER to cytosol, reducing time to onset, and increasing speed, duration, and amplitude. In region 4, SERCA dominated the dynamics, shuttling Ca2+ back into the ER too quickly to allow IP3 stimulation to initiate a Ca2+ wave.
3.4 IP3 diffusibility regulates wave onset and speed
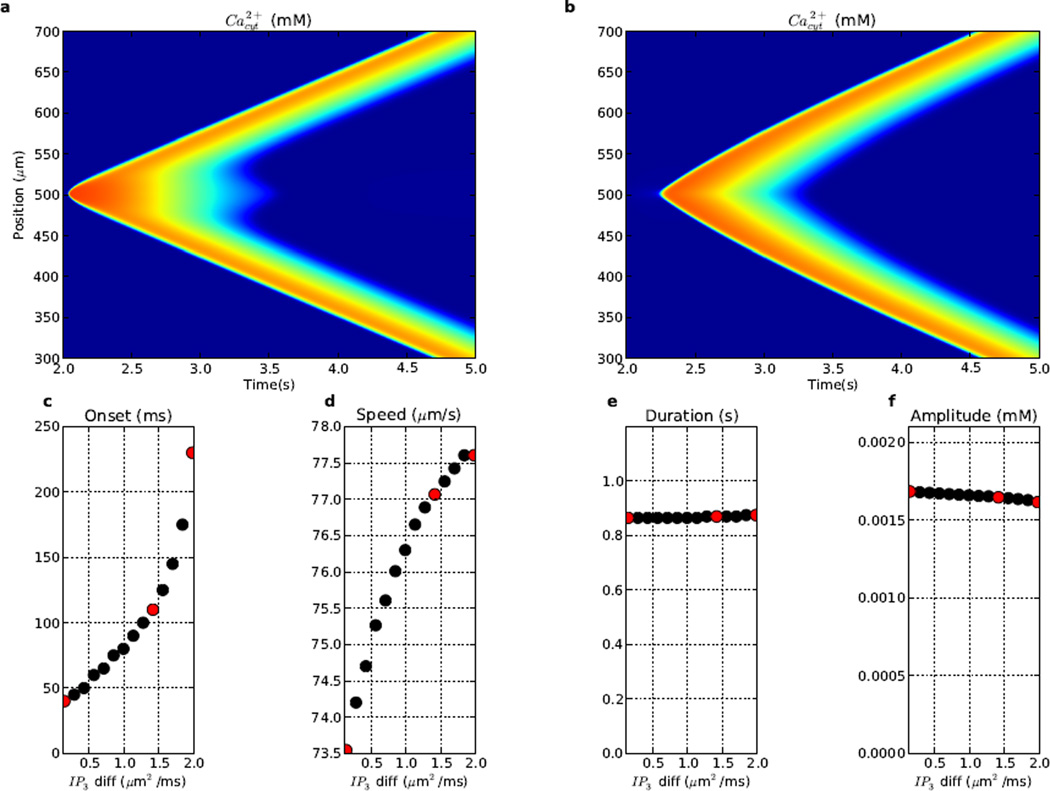
Altering the IP3 diffusion constant (dIP3) had a pronounced effect on Ca2+ wave initiation (Fig. 6). With low dIP3 (0.1415 µm2/ms), the IP3 stimulus remained localized in the central stimulus region (~500 µm), producing a high prolonged local elevation with more rapid activation of local IP3Rs and shorter wave onset time (40 ms). Ca2+ near the stimulus then remained elevated longer than at other dendritic locations. Since the IP3 stimulus spread to neighboring dendritic locations more slowly, Ca2+ wave speed was slightly reduced (73.5 µm/s).
Figure 6.
Ca2+ wave propagation is sensitive to IP3 diffusion coefficient (dIP3). From left to right, red dots in c–f correspond to features of Ca2+ waves with (a) low (0.1415 µm2/ms); baseline (1.415 µm2/ms; Fig. 2); (b) high (1.981 µm2/ms) dIP3. (c) time to wave onset, (d) wave propagation speed, (e) duration (2× Ca2+ elevation; median duration across dendritic locations) (f) peak amplitude. (Colorscale in (a) and (b) same as in Fig. 2.)
High dIP3 (1.981 µm2/ms) significantly delayed the onset of the Ca2+ wave (230 ms; Fig. 6b), due to IP3 diffusing quickly away, producing less local IP3R stimulation and increasing the time required to trigger the wave. However, once the wave was initiated, it spread slightly faster (77.6 µm/s), the pre-arriving IP3 giving a slight boost at subsequent locations along the dendrite. Amplitude had a minimal inverse relationship with increasing dIP3 (Fig. 6f) because local IP3 spread out more quickly, reducing local IP3R activation. At dIP3 values larger than 1.981 µm2/ms, IP3 was so diffuse, that it could not elicit the Ca2+ wave.
Overall, increasing dIP3 caused delayed onet (Fig. 6c), a minor increase in speed (Fig. 6d), and no appreciable change in duration or amplitude (Fig. 6ef).
3.5 Pseudo-saltatory waves via IP3R hotspots
The prior simulations were performed using uniform density of ER mechanisms at all locations. However, there is evidence of inhomogeneities, for example at dendritic branch-points, where elevations in local IP3R density (IP3R hotspots) might contribute to assisted propagation of Ca2+ waves at these sites of potential failure (Fitzpatrick et al., 2009). In neurons, hotspots have average center-to-center spacing of approximately 20 µm (edge-to-edge spacing of 10 µm) but show considerable variability in the spacing (Fitzpatrick et al., 2009). In the following simulations, we varied hotspot IP3R density while keeping the inter-hotspot IP3R density at 80% of baseline.
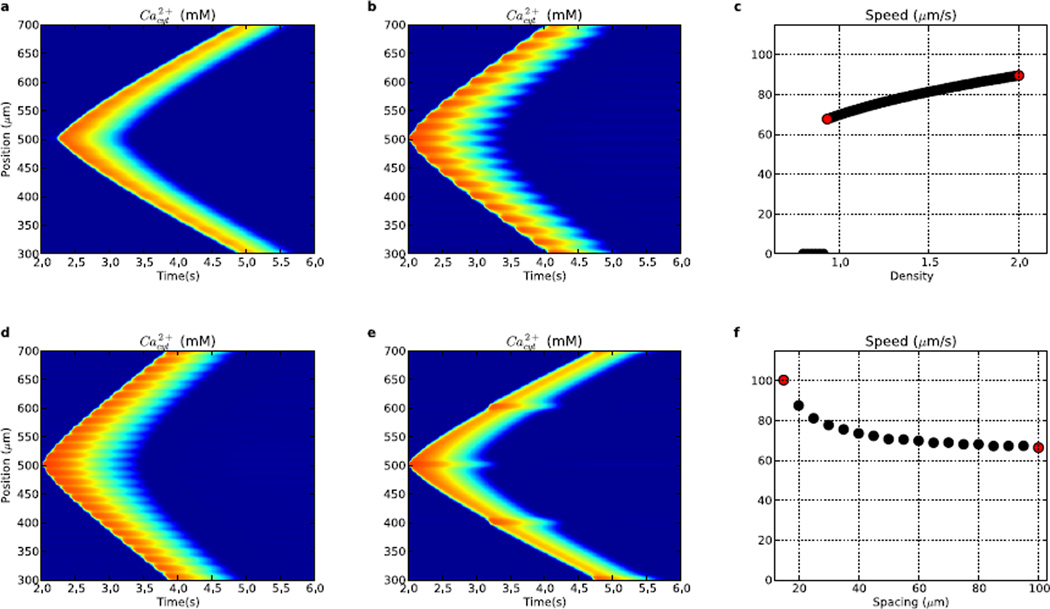
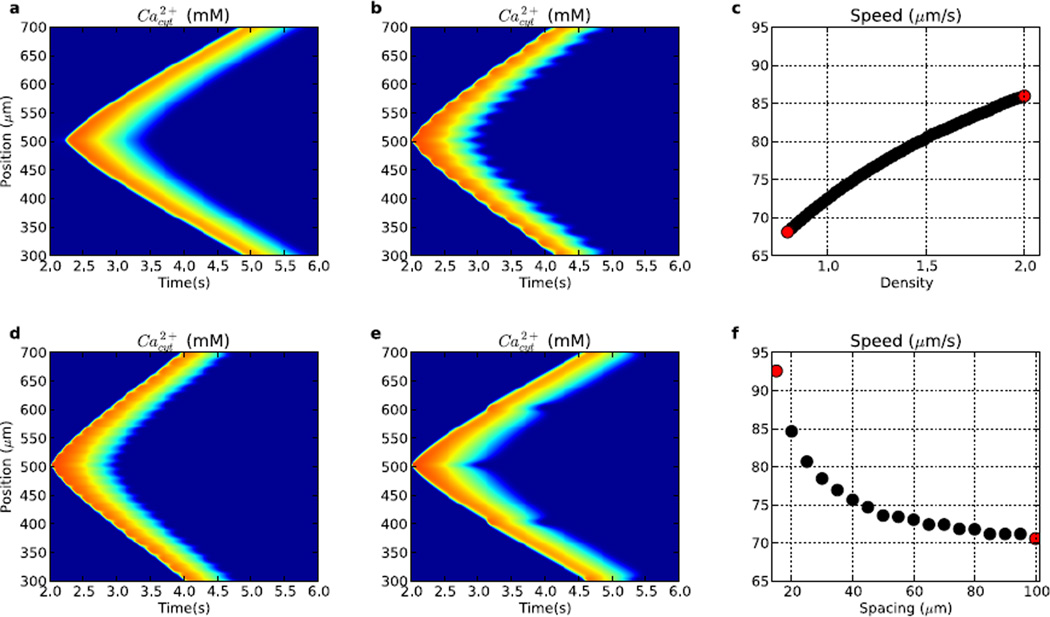
Both IP3R hotspot strength and spacing altered Ca2+ wave speeds (Fig. 7). We started with a 20% reduction in density between hotspots (Fig. 7a), with the hotspots having 93% of the IP3R density used in Fig. 2. This alteration reduced wave speed from 77 to 68 µm/s. However, the propagation pattern differed qualitatively, with its saltatory nature readily seen as spots of high Ca2+ concentration which occur at the locations of IP3R hotspots. Local velocity parallels amplitude in showing an increase at the hotspots, where activation produces a local highly varying gradient (peaked high second spatial derivative) leading to a higher immediate diffusion speed. Slower wave progression occurs between hotspots where lower IP3R concentration only slightly boosts the wave progression from diffusion. Increased IP3R density at hotspots increased wave speed further to 90 µm/s (2.0× baseline; Fig. 7b). Further augmentation provided an approximately linear increase in speed due to faster and larger release of Ca2+ from the ER stores at the hotspots (Fig. 7c). Below ~93% of hotspot IP3R density, the waves did not initiate, since there was insufficient Ca2+ release to trigger waves (0 speeds at left of Fig. 7c). Wave propagation also did not occur in the absence of IP3R between hotspots, with the threshold for Ca2+ wave initiation having inter-hotspot and hotspot IP3R densities of ~0.66 and ~0.93× baseline, respectively.
Figure 7.
Comparison of waves (and wave speeds) generated from varying IP3R hotspot density (a–c) and separation (d–f). (a) 20 µm spacing; 0.93× density. (b) 20 µm spacing; 2× density. (c) wave speed as a function of IP3R hotspot density, (d) 15 µm spacing; 1.87× density. (e) 100 µm spacing; 1.87× density. (f) wave speed as a function of IP3R hotspot spacing. (Colorscale in a,b,d,e same as in Fig. 2.) Red points in (c) ((f)) are from waves in (a),(b) ((d),(e)).
Hotspot spacing also modulated Ca2+ wave speeds, with larger spacing producing slowing as Ca2+ and IP3 had to travel further via mildly-boosted diffusion between hotspots before being fully reboosted. At 1.87× baseline IP3R density with a spacing of 15 µm, the wave had a speed of 100 µm/s (Fig. 7d). Increasing center-to-center spacing between hotspots to 100 µm resulted in reduction of wave propagation speed to 66 µm/s. At the densities shown, hotspot spacing had a larger impact on wave speed (~66–100 µm/s) than IP3R density (~68–90 µm/s).
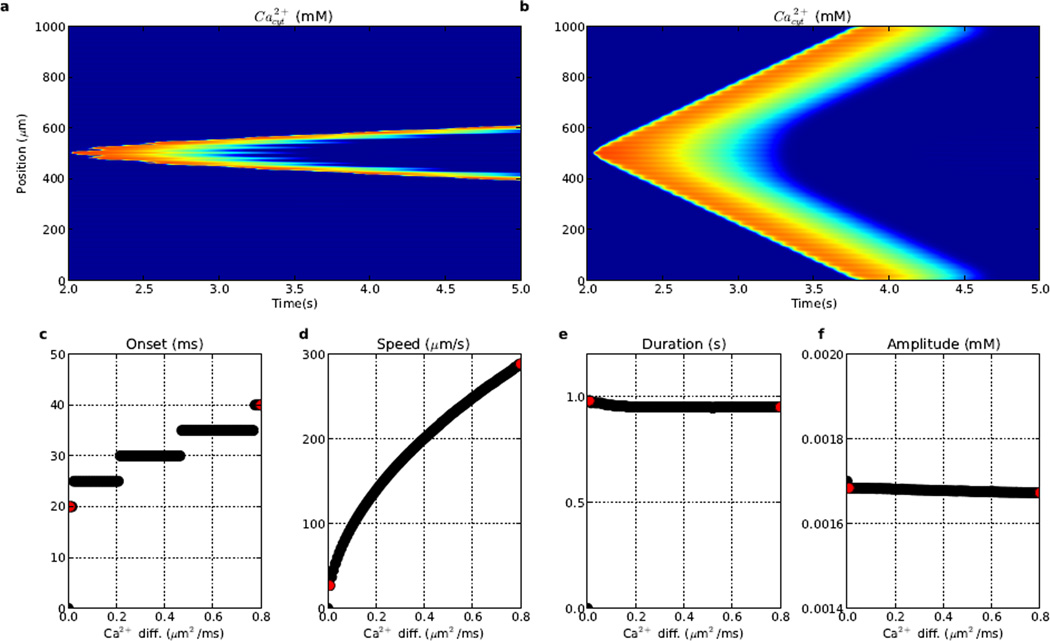
Intracellular Ca2+ concentration is heavily regulated via buffering mechanisms, in part presumed to provide careful regulation of Ca2+-triggered signaling cascades. Ca2+ buffering also modulates Ca2+ diffusion efficacy and apparent Ca2+ diffusion coefficient (DCa(App)). Because we were not modeling buffering directly in these simulations, we altered DCa(App) instead. Changing DCa(App) dramatically altered propagation speed over a wide range (Fig. 8). With diminished DCa(App), wave speed was substantially reduced to 25 µm/s (Fig. 8a). The converse of this was that Ca2+ was relatively immobile, with duration at one location slightly increased (Fig. 8e). This heightened local Ca2+ elevation also allowed for a shorter onset to wave initiation (20 ms; Fig. 8c). Increasing DCa(App) above baseline level had opposite effects: wave speed was augmented (288 µm/s) but time to onset was delayed (40 ms), both due to faster spread of Ca2+. We also note that while onset varied nearly linearly, speed showed much greater alteration.
Figure 8.
Comparison of waves generated from varying DCa(App) in the presence of IP3R hotspots. Ca2+ waves generated when using a Ca2+ diffusion coefficient of (a) 0.008 µm2/ms and (b) 0.8 µm2/ms. (c) time to Ca2+ wave onset (0 indicates no wave at the Ca2+ diffusion level), (d) speed, (e) duration (median duration of Ca2+ elevation across dendritic locations), (f) peak amplitude. Left (right) red dots in c–f corresponds to activity shown in (a) ((b)). (Colorscale in (a) and (b) same as in Fig. 2.)
3.6 Pseudo-saltatory waves via ER stacks
There are at least two ways that hotspots could occur in dendrites: Type 1. increased density of IP3R at particular locations on homogeneous distribution of ER; Type 2. increased “density” (accumulation) of ER at particular locations. The former case was explored in the prior section. The latter case has been identified as locations of ER lamellar specialization that are sometimes described as ER stacks. We next explored such stacks as an alternative type of hotspot, noting that this increase in local ER provides increased density of SERCA and leak as well as IP3R at the hotspot locations. In these simulations, the ER density between stacks was at 0.8× baseline, consistent with continuous ER throughout the dendrite (Martone et al., 1993; Terasaki et al., 1994).
Increasing ER stack density from ~0.8× (Fig. 9a) to ~2× baseline (Fig. 9b), increased wave speed from 68 µm/s to 86 µm/s (Fig. 9c). This is due to more release of Ca2+ from the leak and IP3R channels, which was opposed by heightened SERCA activity. The duration of Ca2+ amplitude elevation was reduced at the ER stacks. In addition, as the ER stack density increased, the onset to wave initiation shortened (220 to 30 ms), due to heightened leak and IP3R extrusion of Ca2+ into cytosol. However, Ca2+ elevation duration decreased as the ER stack density increased (965 to 795 ms), due to heightened SERCA pumping.
Figure 9.
Comparison of Ca2+ waves generated from varying ER stack properties. Simulations were run by varying density and spacing of ER stacks. ER density in between stacks was set at 0.8× baseline. (a) Ca2+ wave from 0.8× ER stack density with 20 µm spacing, (b) Ca2+ wave from 2.0× ER stack density with 20 µm spacing, (c) Ca2+ wave speed as a function of ER stack density (fixed 20 µm spacing), (d) Ca2+ wave from 15 µm ER stack spacing with ~1.87× density, (e) Ca2+ wave from 100 µm ER stack spacing with ~1.87× density, and (f) wave speed as a function of ER stack spacing. Note the bumps in Ca2+ release around ER stacks. (Colorscale in a,b,d,e same as in Fig. 2.) Red points in (c) ((f)) are from waves in (a),(b) ((d),(e)).
Increasing the center-to-center spacing of ER stacks, while maintaining a fixed ER density of 1.86× baseline (Fig. 9d–f), tended to decrease wave speed (93 to 71 µm/s). This was due to lower overall availability of ER for releasing Ca2+ and spreading the wave. Interestingly, with heightened center-to-center spacing (15 and 100 µm) of ER stacks, the duration of heightened Ca2+ elevation was increased (755 to 960 ms), due to lower overall presence of SERCA pumps.
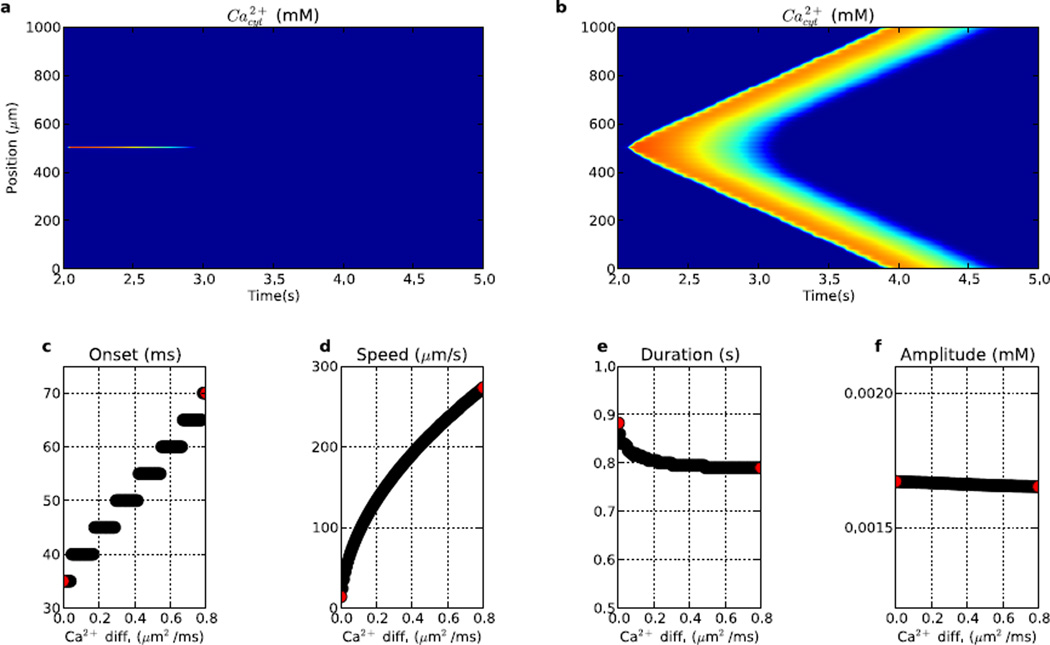
Waves could not initiate below a minimum of 0.8× ER stack density due to insufficient Ca2+ sourcing. Effects of density and spacing of stacks were generally similar to those seen with IP3R hotspots. Onset time depended primarily on ER stack density. Variation of DCa(App) with ER stacks (Fig. 10), produced results very similar to those seen with Type 1 hotspots (Fig. 8), except that the effects on time to onset were more pronounced. With ER stacks, the onsets were significantly larger (35–70 ms) compared to those for IP3R hotspots (20–40 ms). These heightened onset times with ER stacks were due to the higher SERCA activity, which reduces cytosolic Ca2+ availability.
Figure 10.
Comparison of waves generated from varying DCa(App) in the presence of ER stacks. (a) Local Ca2+ event generated with Ca2+ diffusion coefficient of 0.0 µm2/ms. (b) Ca2+ waves generated when using a Ca2+ diffusion coefficient of 0.8 µm2/ms. (c) time to Ca2+ wave onset, (d) speed, (e) duration (median duration of Ca2+ elevation across dendritic locations), (f) peak amplitude. Left (right) red dots in c–f corresponds to activity shown in (a) ((b)). (Colorscale in (a) and (b) same as in Fig. 2.)
3.7 Electrical priming enhances Ca2+ waves
Adding electrical dynamics (voltage-gated calcium channels – VGCCs, Na+ and K+ channels, AMPA synapses) to the dendrite allowed for a more complex set of interactions (Fig. 11). VGCCs admitted extracellular calcium into the cytosol, which was then taken up into the ER via SERCA pumps. Compared to the prior simulations, this increased ER steady-state calcium concentration (0.03 mM), allowing for larger contributions to Ca2+ waves. Cytosolic calcium equilibrated to 65 nM, due to a balance between SERCA uptake and VGCC calcium influx. In these simulations, the background IP3 level was set to 0 mM to prevent spontaneous oscillations due to ongoing activation of IP3R. Calcium waves were more localized due to this absence of background IP3.
Activation by a 2.5 mM IP3 stimulus at 7 s combined with the higher background cytosolic calcium levels to trigger IP3Rs to release calcium from the ER. ER calcium efflux then triggered a localized calcium wave (Fig. 11a middle,bottom), which spread approximately 150 µm, consistent with experimental data (Fitzpatrick et al., 2009; Hong and Ross, 2007; Ross et al., 2005). The spreading calcium wave produced electrical effects, by contributing to the opening of calcium-dependent potassium channels, which hyperpolarized the membrane to −77 mV. Once the calcium wave had passed, the voltage recovered to baseline.
Prior AMPAergic stimulation (150 pulses; 25 ms interspike interval; 3000–6750 ms) produced spikes and further supplemented the ER calcium stores via a sequence of electrochemical interactions (Fig. 11b,c top): Ca2+ entry through VGCCs augmented cytosolic Ca2+ (early rise of 65–120 nM at center), augmenting ER Ca2+ via uptake (Fig. 11b center). This gradually increased Ca2+ throughout the dendrite (0.03–0.045 mM at center), priming the ER. Subsequent IP3 activation was then able to liberate more ER calcium, inducing a higher-amplitude (7.5 µM) calcium wave (Fig. 11b,c bottom). The larger amount of calcium liberated allowed the wave to spread 50 µm further, and produced a longer duration (2 s), compared to the wave produced without synaptic priming. The heightened availability of Ca2+ also enhanced the electrical effects, producing greater voltage suppression due to activation of the hyperpolarizing Ca2+-dependent potassium channels.
Increasing the number of AMPA stimuli between 0–150 (interspike interval of 25 ms; AMPA activation at 3 s; IP3 activation at 7 s) produced nearly linear increases in the IP3-induced calcium wave amplitude (5.5–7.5µM) and duration (1.6–2.0 s) (not shown). Wave speeds tended to decrease slightly (57–63 µm/s). There was no significant impact of AMPA stimulation on the wave onset, which was relatively fast for all simulations, at 5 ms past the IP3 stimulation. Using increased background IP3 (0.01 mM) and increasing the number of AMPA stimuli similarly produced higher amplitude, faster Ca2+ waves with IP3 stimulation (not shown).
4 Discussion
We have developed a reaction-diffusion (R×D) model of neuronal Ca2+ waves with multiple compartments (ER and cytosol), multiple diffusing species (Ca2+ and IP3), and multiple ER membrane mechanisms (IP3 receptors, SERCA pumps, and ER leak). IP3Rs opened in response to a cytosolic Ca2+ and IP3 stimulus, admitting more Ca2+ into the cytosol. Ca2+ and IP3 then diffused and bound to neighboring IP3Rs, triggering further release of Ca2+ and initiating the process of Ca2+-induced-Ca2+-release (CICR). The Ca2+ waves had properties matching those observed in vitro (Ross et al., 2005), including wave speed (~50–90 µm/s), amplitude (2 µM), and duration (~1 s; Fig. 2). We used our model to compare wave propagation in 3 scenarios: continuous IP3R distribution, IP3R hotspots, and ER stacks.
Because the cytosolic Ca2+ required for CICR depended on a supply from ER stores via the action of IP3Rs, the Ca2+ waves demonstrated primary sensitivity to IP3R density, such that wave initiation required a minimal level of IP3R. IP3R density correlated negatively with onset, and positively with amplitude, speed, and duration of Ca2+ waves (Fig. 3). SERCA pumps were responsible for setting the pace of reuptake of cytosolic Ca2+ into the ER and had a large impact on the properties of Ca2+ waves (Fig. 4). Low SERCA triggered the generation of hyper-excitable and spontaneous waves. High SERCA diminished wave spread and speed, while increasing onset to wave initiation.
We compared two hypothesized mechanisms for saltatory waves: 1. heightened density of IP3R (IP3R hotspots), and 2. heightened density of ER (ER stacks), where ER stacks heighten local leak and SERCA, as well as IP3R. IP3R hotspots were more effective in setting the pace of wave propagation and onset, whereas ER stack augmentation of Ca2+ waves was less pronounced due to the opposing effects of SERCA (leak and IP3R increased excitability, while SERCA decreased excitability). We hypothesize that IP3R hotspots will predominate since they are the more effective mechanism for boosting Ca2+ waves.
Intracellular Ca2+ concentration is heavily buffered. Although our model did not contain an explicit representation of buffering mechanisms, we used our model to test the effects of alterations in buffering capacity by modulating the apparent Ca2+ diffusion constant (DCa(App)). We found that DCa(App) had potent effects on Ca2+ wave speed and propagation efficacy. Effects were similar for both IP3R hotspots (Fig. 8) and ER stacks (Fig. 10). Interestingly, at high Ca2+ diffusibility, there were competing effects on excitability: higher speed but longer duration to wave initiation (Fig. 8c & d and Fig. 10c & d).
Finally, we extended our chemical signaling model with electrical components, including a set of calcium and voltage-dependent ion channels and synapses. We used this extended model to demonstrate that electrical activation via AMPA synapses and voltage-gated calcium channels primes ER calcium stores, and contributes to enhanced Ca2+ waves on subsequent IP3 stimulation (Fig. 11).
4.1 Predictions
Our model allows us to make the following experimentally-testable predictions.
Lowering apparent IP3R densities will lead to reduced spread of Ca2+ waves. This is testable by using IP3R antagonists (Taylor and Tovey, 2010).
Reductions in SERCA with antagonist (e.g., thapsigargin) will lead to hyperexcitability with multiple or spontaneous Ca2+ waves.
Dendritic branch-point hotspots will be IP3R hotspots rather than ER stacks, allowing optimal boosting at locations where the wave might otherwise fail. Testable by using immunohistochemistry to look for IP3Rs and correlating with electron microscopy evaluation of stacking/ER concentration.
Increased buffering with added diffusible buffers provided via whole cell patch will reduce Ca2+ wave velocity. This is testable by modulating buffering properties and effectiveness via supply ofMg2++ (for parvalbumin modulation), BAPTA (for calbindin modulation), or EGTA (ethylene glycol tetraacetic acid) (Storm, 1987). Additionally, the use of dye indicators, used to follow wave progression, will alter velocity and other wave properties.
4.2 Roles of ER and of Ca2+ waves
Since neuronal dendritic trees are very large (hundreds of microns), diffusion alone would make it impossible for dendritic Ca2+ to reach presumed targets in the soma and other dendritic locations for use in modulation of physiological processes including: synaptic plasticity, transcription regulation, and membrane current regulation (e.g., Ih). Our modeling emphasizes that Ca2+ waves can have large variability in speed and distance of propagation, which will have major effects on how Ca2+ is distributed and which targets are hit at what concentrations. However, we note that an entirely different role for ER has been proposed by Shemer et al. (2008). Instead of a role for ER in enhancing Ca2+ waves, they suggested that the ER forms a “cable-within-a-cable” which is electrically active and would provide more rapid distal to proximal communication via electrical signaling comparable to that of the plasma membrane.
Pathologically, Ca2+ dysregulation may occur via multiple pathways, including heightened IP3R density, lowered SERCA density, or altered buffering. Dysregulation of Ca2+ homeostasis has been implicated in Alzheimer’s disease (Lytton et al., 2014; Rowan and Neymotin, 2013; Rowan et al., 2014) and in ischemia, where Ca2+ signaling is an important element in the triggering of apoptosis (Green and LaFerla, 2008; LaFerla, 2002; Stutzmann, 2005; Thibault et al., 1998; Zündorf and Reiser, 2011; Taxin et al., 2014).
Acknowledgments
Research supported by NIH grant R01 MH086638 and NIH grant T15 LM007056. The authors would like to thank Larry Eberle (SUNY Downstate) for Neurosim lab support, Tom Morse (Yale) for ModelDB support, and Herman Moreno (SUNY Downstate) & the Shepherd lab (Yale) for helpful comments. The authors declare no competing financial interests.
References
- Allbritton NL, Meyer T, Stryer L. Range of messenger action of calcium ion and inositol 1, 4, 5-trisphosphate. Science. 1992;258(5089):1812–1815. doi: 10.1126/science.1465619. [DOI] [PubMed] [Google Scholar]
- Berridge M. Neuronal calcium signaling review. Neuron. 1998;21:13–26. doi: 10.1016/s0896-6273(00)80510-3. [DOI] [PubMed] [Google Scholar]
- Blackwell K. Approaches and tools for modeling signaling pathways and calcium dynamics in neurons. J Neurosci Methods. 2013 doi: 10.1016/j.jneumeth.2013.05.008. in press. [DOI] [PMC free article] [PubMed] [Google Scholar]
- Busa W, Nuccitelli R. An elevated free cytosolic Ca2+ wave follows fertilization in eggs of the frog, Xenopus laevis. The Journal of cell biology. 1985;100(4):1325. doi: 10.1083/jcb.100.4.1325. [DOI] [PMC free article] [PubMed] [Google Scholar]
- Carnevale N, Hines M. The NEURON Book. New York: Cambridge University Press; 2006. [Google Scholar]
- De Schutter E. Why are computational neuroscience and systems biology so separate? PLoS Comput Biol. 2008;4(5):e1000078. doi: 10.1371/journal.pcbi.1000078. [DOI] [PMC free article] [PubMed] [Google Scholar]
- De Schutter E, Smolen P. Calcium dynamics in large neuronal models. Methods in neuronal modeling: from ions to networks. 1998;2 [Google Scholar]
- De Young G, Keizer J. A single-pool inositol 1, 4, 5-trisphosphate-receptor-based model for agonist-stimulated oscillations in Ca2+ concentration. Proceedings of the National Academy of Sciences of the United States of America. 1992;89(20):9895. doi: 10.1073/pnas.89.20.9895. [DOI] [PMC free article] [PubMed] [Google Scholar]
- Fall C, Rinzel J. An intracellular Ca2+ subsystem as a biologically plausible source of intrinsic conditional bistability in a network model of working memory. Journal of Computational Neuroscience. 2006;20(1):97–107. doi: 10.1007/s10827-006-4791-8. [DOI] [PubMed] [Google Scholar]
- Fall C, Wagner J, Loew L, Nuccitelli R. Cortically restricted production of ip3 leads to propagation of the fertilization ca2+ wave along the cell surface in a model of the xenopus egg. Journal of theoretical biology. 2004;231(4):487–496. doi: 10.1016/j.jtbi.2004.06.019. [DOI] [PubMed] [Google Scholar]
- Fitzpatrick J, Hagenston A, Hertle D, Gipson K, Bertetto-D’Angelo L, Yeckel M. Inositol-1,4,5-trisphosphate receptor-mediated ca2+ waves in pyramidal neuron dendrites propagate through hot spots and cold spots. J Physiol. 2009;587(7):1439–1459. doi: 10.1113/jphysiol.2009.168930. [DOI] [PMC free article] [PubMed] [Google Scholar]
- Fontanilla R, Nuccitelli R. Characterization of the sperm-induced calcium wave in xenopus eggs using confocal microscopy. Biophysical journal. 1998;75(4):2079–2087. doi: 10.1016/S0006-3495(98)77650-7. [DOI] [PMC free article] [PubMed] [Google Scholar]
- Green K, LaFerla F. Linking calcium to Aβ and Alzheimer’s disease. Neuron. 2008;59(2):190–194. doi: 10.1016/j.neuron.2008.07.013. [DOI] [PubMed] [Google Scholar]
- Gunter T, Yule D, Gunter K, Eliseev R, Salter J. Calcium and mitochondria. FEBS letters. 2004;567(1):96–102. doi: 10.1016/j.febslet.2004.03.071. [DOI] [PubMed] [Google Scholar]
- Harris K. Dendritic spines. Wiley Online Library. 1994 [Google Scholar]
- Hartsfield J. PhD thesis. Baylor College of Medicine; 2005. A quantitative study of neuronal calcium signaling. [Google Scholar]
- Hines M, Morse T, Migliore M, Carnevale N, Shepherd G. ModelDB: a database to support computational neuroscience. J Comput Neurosci. 2004;17(1):7–11. doi: 10.1023/B:JCNS.0000023869.22017.2e. [DOI] [PMC free article] [PubMed] [Google Scholar]
- Hong M, Ross W. Priming of intracellular calcium stores in rat ca1 pyramidal neurons. The Journal of Physiology. 2007;584(1):75. doi: 10.1113/jphysiol.2007.137661. [DOI] [PMC free article] [PubMed] [Google Scholar]
- Iftinca M, McKay B, Snutch T, McRory J, Turner R, Zamponi G. Temperature dependence of T-type calcium channel gating. Neuroscience. 2006;142:1031–1042. doi: 10.1016/j.neuroscience.2006.07.010. [DOI] [PubMed] [Google Scholar]
- Kay A, Wong R. Calcium current activation kinetics in isolated pyramidal neurones of the CA1 region of the mature guinea-pig hippocampus. J Physiol (Lond) 1987;392:603–616. doi: 10.1113/jphysiol.1987.sp016799. [DOI] [PMC free article] [PubMed] [Google Scholar]
- Kotaleski J, Blackwell K. Modelling the molecular mechanisms of synaptic plasticity using systems biology approaches. Nat Rev Neurosci. 2010;11(4):239–251. doi: 10.1038/nrn2807. [DOI] [PMC free article] [PubMed] [Google Scholar]
- Kretsinger R. Structure and evolution of calcium-modulated proteins. CRC critical reviews in biochemistry. 1980;8(2):119. doi: 10.3109/10409238009105467. [DOI] [PubMed] [Google Scholar]
- LaFerla F. Calcium dyshomeostasis and intracellular signalling in Alzheimer’s disease. Nature Rev Neurosci. 2002;3(11):862–872. doi: 10.1038/nrn960. [DOI] [PubMed] [Google Scholar]
- Lechleiter J, Girard S, Peralta E, Clapham D. Spiral calcium wave propagation and annihilation in xenopus laevis oocytes. Science. 1991;252(5002):123. doi: 10.1126/science.2011747. [DOI] [PubMed] [Google Scholar]
- Li Y, Rinzel J. Equations for InsP3 receptor-mediated [Ca2+]i oscillations derived from a detailed kinetic model: a Hodgkin-Huxley like formalism. Journal of theoretical biology. 1994;166(4):461–473. doi: 10.1006/jtbi.1994.1041. [DOI] [PubMed] [Google Scholar]
- Lipton P. Ischemic cell death in brain neurons. Physiol Rev. 1999;79(4):1431–1568. doi: 10.1152/physrev.1999.79.4.1431. [DOI] [PubMed] [Google Scholar]
- Lytton W, Neymotin S, Kerr C. Multiscale modeling for clinical translation in neuropsychiatric disease. J Comput Surgery. 2014;1(1):7. doi: 10.1186/2194-3990-1-7. [DOI] [PMC free article] [PubMed] [Google Scholar]
- Martone M, Zhang Y, Simpliciano V, Carragher B, Ellisman M. Three-dimensional visualization of the smooth endoplasmic reticulum in purkinje cell dendrites. J Neurosci. 1993;13(11):4636–4646. doi: 10.1523/JNEUROSCI.13-11-04636.1993. [DOI] [PMC free article] [PubMed] [Google Scholar]
- McCormick D, Huguenard J. A model of the electrophysiological properties of thalamocortical relay neurons. J Neurophysiol. 1992;68:1384–1400. doi: 10.1152/jn.1992.68.4.1384. [DOI] [PubMed] [Google Scholar]
- McDougal R, Hines M, Lytton W. Reaction-diffusion in the NEURON simulator. Front Neuroinform. 2013a;7:28. doi: 10.3389/fninf.2013.00028. [DOI] [PMC free article] [PubMed] [Google Scholar]
- McDougal RA, Hines ML, Lytton WW. Water-tight membranes from neuronal morphology files. Journal of neuroscience methods. 2013b;220(2):167–178. doi: 10.1016/j.jneumeth.2013.09.011. [DOI] [PMC free article] [PubMed] [Google Scholar]
- Nakamura T, Barbara J, Nakamura K, Ross W. Synergistic release of Ca2+ from IP3-sensitive stores evoked by synaptic activation of mGluRs paired with backpropagating action potentials. Neuron. 1999;24(3):727–737. doi: 10.1016/s0896-6273(00)81125-3. [DOI] [PubMed] [Google Scholar]
- Neymotin S, Hilscher M, Moulin T, Skolnick Y, Lazarewicz M, Lytton W. Ih tunes theta/gamma oscillations and cross-frequency coupling in an in silico CA3 model. PLoS One. 2013;8:e76285. doi: 10.1371/journal.pone.0076285. [DOI] [PMC free article] [PubMed] [Google Scholar]
- Neymotin S, McDougal R, Hines M, Lytton W. Calcium regulation of HCN supports persistent activity associated with working memory: a multiscale model of prefrontal cortex. BMC Neuroscience. 2014;15(Suppl 1):P108. doi: 10.1016/j.neuroscience.2015.12.043. [DOI] [PMC free article] [PubMed] [Google Scholar]
- Orrenius S, Zhivotovsky B, Nicotera P. Regulation of cell death: the calcium–apoptosis link. Nature Reviews Molecular Cell Biology. 2003;4(7):552–565. doi: 10.1038/nrm1150. [DOI] [PubMed] [Google Scholar]
- Peercy B. Initiation and propagation of a neuronal intracellular calcium wave. J Comput Neurosci. 2008;25(2):334–348. doi: 10.1007/s10827-008-0082-x. [DOI] [PubMed] [Google Scholar]
- Peterson B, Healy M, Nadkarni P, Miller P, Shepherd G. ModelDB: an environment for running and storing computational models and their results applied to neuroscience. J Am Med Inform Assoc. 1996;3(6):389–398. doi: 10.1136/jamia.1996.97084512. [DOI] [PMC free article] [PubMed] [Google Scholar]
- Pozzo-Miller L, Pivovarova N, Leapman R, Buchanan R, Reese T, Andrews S. Activity-dependent calcium sequestration in dendrites of hippocampal neurons in brain slices. The Journal of neuroscience. 1997;17(22):8729. doi: 10.1523/JNEUROSCI.17-22-08729.1997. [DOI] [PMC free article] [PubMed] [Google Scholar]
- Ross WN, Nakamura T, Watanabe S, Larkum M, Lasser-Ross N. Synaptically activated Ca2+ release from internal stores in CNS neurons. Cell Mol Neurobiol. 2005;25(2):283–295. doi: 10.1007/s10571-005-3060-0. [DOI] [PMC free article] [PubMed] [Google Scholar]
- Rowan M, Neymotin S. Synaptic scaling balances learning in a spiking model of neocortex. Springer LNCS. 2013;7824:20–29. [Google Scholar]
- Rowan M, Neymotin S, Lytton W. Electrostimulation to reduce synaptic scaling driven progression of alzheimer’s disease. Front Comput Neurosci. 2014;8:39. doi: 10.3389/fncom.2014.00039. [DOI] [PMC free article] [PubMed] [Google Scholar]
- Safiulina VF, Caiati MD, Sivakumaran S, Bisson G, Migliore M, Cherubini E. Control of gaba release at single mossy fiber-ca3 connections in the developing hippocampus. Frontiers in Synaptic Neuroscience. 2010;2(1) doi: 10.3389/neuro.19.001.2010. modeldb reference number: 126814. [DOI] [PMC free article] [PubMed] [Google Scholar]
- Shemer I, Brinne B, Tegnér J, Grillner S. Electrotonic Signals along Intracellular Membranes May Interconnect Dendritic Spines and Nucleus. PLoS Computational Biology. 2008;4(3):e1000036. doi: 10.1371/journal.pcbi.1000036. [DOI] [PMC free article] [PubMed] [Google Scholar]
- Spacek J, Harris K. Three-dimensional organization of smooth endoplasmic reticulum in hippocampal ca1 dendrites and dendritic spines of the immature and mature rat. The Journal of neuroscience. 1997;17(1):190. doi: 10.1523/JNEUROSCI.17-01-00190.1997. [DOI] [PMC free article] [PubMed] [Google Scholar]
- Stern M. Buffering of calcium in the vicinity of a channel pore. Cell Calcium. 1992;13(3):183–192. doi: 10.1016/0143-4160(92)90046-u. [DOI] [PubMed] [Google Scholar]
- Storm J. Intracellular injection of a ca2+ chelator inhibits spike repolarization in hippocampal neurons. Brain Res. 1987;435(1):387–392. doi: 10.1016/0006-8993(87)91631-3. [DOI] [PubMed] [Google Scholar]
- Stutzmann G. Calcium dysregulation, IP3 signaling, and Alzheimers disease. Neuroscientist. 2005;11(2):110–115. doi: 10.1177/1073858404270899. [DOI] [PubMed] [Google Scholar]
- Taxin Z, Neymotin S, Mohan A, Lipton P, Lytton W. Modeling molecular pathways of neuronal ischemia. Prog Mol Biol Transl Sci. 2014;123:249–275. doi: 10.1016/B978-0-12-397897-4.00014-0. [DOI] [PMC free article] [PubMed] [Google Scholar]
- Taylor C, Tovey S. IP3 receptors: toward understanding their activation. Cold Spring Harb Perspect Biol. 2010;2(12) doi: 10.1101/cshperspect.a004010. [DOI] [PMC free article] [PubMed] [Google Scholar]
- Terasaki M, Slater N, Fein A, Schmidek A, Reese T. Continuous network of endoplasmic reticulum in cerebellar purkinje neurons. Proc Nat Acad Sci. 1994;91(16):7510–7514. doi: 10.1073/pnas.91.16.7510. [DOI] [PMC free article] [PubMed] [Google Scholar]
- Thibault O, Porter N, Chen K, Blalock E, Kaminker P, Clodfelter G, Brewer L, Landfield P. Calcium dysregulation in neuronal aging and alzheimer’s disease: history and new directions. Cell Calcium. 1998;24(5–6):417–433. doi: 10.1016/s0143-4160(98)90064-1. [DOI] [PubMed] [Google Scholar]
- Wagner J, Fall CP, Hong F, Sims CE, Allbritton NL, Fontanilla RA, Moraru II, Loew LM, Nuccitelli R. A wave of IP3 production accompanies the fertilization Ca2+ wave in the egg of the frog, Xenopus laevis: theoretical and experimental support. Cell Calcium. 2004;35(5):433–447. doi: 10.1016/j.ceca.2003.10.009. [DOI] [PubMed] [Google Scholar]
- West A, Chen W, Dalva M, Dolmetsch R, Kornhauser J, Shaywitz A, Takasu M, Tao X, Greenberg M. Calcium regulation of neuronal gene expression. Proceedings of the National Academy of Sciences of the United States of America. 2001;98(20):11024. doi: 10.1073/pnas.191352298. [DOI] [PMC free article] [PubMed] [Google Scholar]
- Winograd M, Destexhe A, Sanchez-Vives M. Hyperpolarization-activated graded persistent activity in the prefrontal cortex. Proc Natl Acad Sci USA. 2008;105(20):7298–7303. doi: 10.1073/pnas.0800360105. [DOI] [PMC free article] [PubMed] [Google Scholar]
- Zündorf G, Reiser G. Calcium dysregulation and homeostasis of neural calcium in the molecular mechanisms of neurodegenerative diseases provide multiple targets for neuroprotection. Antioxid Redox Signal. 2011;14(7):1275–1288. doi: 10.1089/ars.2010.3359. [DOI] [PMC free article] [PubMed] [Google Scholar]


