Abstract
The aim of this work was to design and evaluate effervescent floating gastro-retentive drug delivery matrix tablets with sustained-release behavior using a binary mixture of hydroxyethyl cellulose and sodium alginate. Pentoxifylline was used as a highly water-soluble, short half-life model drug with a high density. The floating capacity, swelling, and drug release behaviors of drug-loaded matrix tablets were evaluated in 0.1 N HCl (pH 1.2) at 37°C±0.5°C. Release data were analyzed by fitting the power law model of Korsmeyer–Peppas. The effect of different formulation variables was investigated, such as wet granulation, sodium bicarbonate gas-forming agent level, and tablet hardness properties. Statistical analysis was applied by paired sample t-test and one-way analysis of variance depending on the type of data to determine significant effect of different parameters. All prepared tablets through wet granulation showed acceptable physicochemical properties and their drug release profiles followed non-Fickian diffusion. They could float on the surface of dissolution medium and sustain drug release over 24 hours. Tablets prepared with 20% w/w sodium bicarbonate at 50–54 N hardness were promising with respect to their floating lag time, floating duration, swelling ability, and sustained drug release profile.
Keywords: floating tablets, sodium alginate, pentoxifylline, dissolution, swelling, effervescent
Introduction
Poor bioavailability has been recorded for some drugs formulated in sustained-release dosage forms. Their narrow absorption window, lower solubility at high pH values, or enzymatic degradation in the intestinal or colonic environments was the reason of decreased bioavailability.1–5 For this, it has been a challenge to develop the oral sustained-release dosage form because it is difficult to keep drugs at the targeted area inside the gastrointestinal tract.6 Gastro retentive drug delivery systems provide dosage forms with longer residence time in the stomach and sustained-release behavior, which can improve bioavailability as well as acting locally on the stomach.7,8 Increasing gastric residence time can be achieved either by floating systems that cause buoyancy above gastric fluid,9 high-density systems that sink to the bottom of the stomach,10 bioadhesive systems that adhere to mucosal surfaces,11 or by expandable systems that have limited emptying through the stomach pylorus due to swelling or unfolding to a larger size.12
The floating drug delivery systems were described in the literature as early as 1968.13 These systems are designed to have a bulk density lower than the gastric fluid so they can remain buoyant for prolonged periods of time without affecting the gastric emptying rate.3,14,15 Floating drug delivery systems can be classified as noneffervescent systems or effervescent systems.16
Noneffervescent floating drug delivery systems swell in gastric fluid and maintain a relative stability of shape and bulk density less than the density of the gastric fluid, which assists the floating process of these dosage forms.17 However, effervescent floating drug delivery systems based on effervescent components will liberate carbon dioxide due to the acidity of the gastric fluid. Liberated gas bubbles will be entrapped in the gel layer formed by hydrocolloids that produce an upward motion of the dosage form and maintain its buoyancy.18
The aim of this work was to design and evaluate effervescent floating tablets loaded with short half-life, 1–2 hours,19 pentoxifylline model drug, with high density,2 and water solubility at 37°C of 191 mg/mL,20 using a mixture of hydroxyethyl cellulose and sodium alginate gel-forming polymers. The effects of different variables have been investigated during the study such as wet granulation, ratio of sodium bicarbonate gas-forming agent, and tablet hardness.
Materials and methods
Materials
Pentoxifylline, sodium alginate (15–20 cP), and sodium bicarbonate were obtained from Sigma-Aldrich (UK), silicified microcrystalline cellulose (Prosolv® 90) was obtained from JRS Pharma (Germany), and hydroxyethy cellulose (Natrosol 250-HHX) was generously provided by Ashland (USA). Magnesium stearate was supplied by MEDEX (UK).
Methods
Granulation
Powder mixture was prepared as shown in Table 1, based on hydroxyethyl cellulose and sodium alginate gel–forming agents, Prosolv® 90 as filler to enhance compression process, and sodium bicarbonate was added as a gas-forming agent in 10% or 20% w/w concentration. Pentoxifylline was used as a hydrophilic model drug. All powders were passed through 180 μm to remove any powder aggregations. However, sodium alginate was used in particle size cut of ≤350 μm to overcome the compression problem that was faced by using 180-μm-size cut.
Table 1.
Composition of prepared floating tablets
| Ingredients | F1 (mg) | F2 (mg) |
|---|---|---|
| Pentoxifylline | 60 | 60 |
| Hydroxyethyl cellulose | 70 | 70 |
| Sodium alginate | 70 | 70 |
| Prosolv® 90 | 50 | 50 |
| Sodium bicarbonate | 27.5 | 62.5 |
| Magnesium stearate (0.5%) | 1.4 | 1.6 |
| Total weight | 278.89a | 314.06a |
Note:
Difference in weight due to raising sodium bicarbonate content from 10% to 20% w/w.
Mixing was done using a turbula mixer (Glen Creston Ltd, UK) at a rotation speed of 60 rpm for 10 minutes. The powder blends were poor flowable as shown in Table 2, and it was impossible to press them automatically by using tableting machine.
Table 2.
Moisture content and Carr’s index with statistical analysis (P-value) results of F1 and F2 formulations before and after granulation
| Formulation | Test | Origin of prepared tablets
|
P-value | |
|---|---|---|---|---|
| Powder mixture | Granules | |||
| Fl | Moisture content (%) | 5.37±0.06 | 4.13±0.17 | 0.005 |
| Carr’s Index | 27.74±0.46 | 16.87±0.33 | 0.001 | |
| F2 | Moisture content (%) | 4.76±0.08 | 3.49±0.14 | 0.003 |
| Carr’s Index | 28.53±2.81 | 17.65±0.64 | 0.016 | |
Note: The data represent mean ± SD of three determinations.
Wet granulation was used to enhance powder flowability where powder mixtures were wetted with 0.5% w/w water and mixed for 10 minutes using Kenwood ChefKneader (Thorn Domestic Appliances Ltd, UK) then passed through a 1,000 μm sieve. The granules were dried by using drying oven (SciQuio Ltd, UK) at 60°C overnight.21 Dried granules with particle size cut ≤853 μm were collected.
Powder mixtures and granules evaluation
Both powder mixtures and prepared granules were evaluated.
Moisture content
Mettler Toledo HG53 Halogen Moisture Analyzer (Switzerland) was used to measure moisture content in 1 g powder mixture before and after granulation. Measurements were done in triplicate and mean values ± standard deviation (SD) were presented.
Carr’s index
Bulk and tapped volumes of 50 g sample were measured by the tapping apparatus Copley JV1000 (UK). Bulk and tapped densities were calculated as the ratio of the powder weight to related powder volume. The Carr’s index (CI) was calculated using the following equation (1)22:
| (1) |
Measurements were done in triplicate and mean values ± SD were presented.
Differential scanning calorimetry study
Differential scanning calorimetry (DSC) thermograms of F1 and F2 formulations (prepared originally from powder mixtures or granules) and pentoxifylline were obtained with the DSC Refrigerated Cooling System (Model Q1000, TA Instruments, UK). Samples of pure materials (2–6 mg) were weighed and transferred into the equipment for analysis in sealed standard aluminum pans. The enthalpy readings were automatically calculated using Q1000, TA software for each peak. Thermal behavior of the samples was investigated at a scanning rate of 10°C/min, from 0°C to 300°C. These conditions were based on a study by Suliman et al.23
Fourier-transform infrared spectroscopy
Infrared spectra of F1 and F2 formulations (prepared originally from powder mixtures or granules) and pentoxifylline were achieved using Perkin Elmer FT-IR system Spectrum BX series (UK), in the frequency range of 4,000–620 cm−1 at 4 cm−1 resolution. A few milligrams of each sample were placed on the middle of the sample stage using a microspatula. The sample was then compressed by twisting the top of the arm of sample stage clockwise.23 The data were obtained by Spectrum BX series software version 5.3.1.
Tablets preparation
Pentoxifylline matrix tablets were automatically pressed by a single-punch tableting machine (Type 3, Manesty Machines Ltd, UK) equipped with flat-faced punches (9.60 mm) to evaluate the effect of tablet hardness as well as gassing agent level on apparent density, floating capacity, swelling, erosion, and dissolution behavior.
In addition, to evaluate the possible effect of the wet granulation process on the tablets’ apparent density, floating capacity, and dissolution behavior, a second group of manually pressed tablets were prepared. These tablets were pressed from powder blends before granulation where the required powder mixture was weighed, and fed manually into the die of the single-punch tableting machine to produce the desired tablets.
Moreover, the hardness of the prepared tablets was adjusted at three levels: A (50–54 N), B (54–59 N), and C (59–64 N) using a hardness tester (Model 2E/205, Schleuniger & Co., Switzerland). A third group of tablets with 0% w/w sodium bicarbonate was prepared automatically after wet granulation at hardness level (A) to evaluate the effect of effervescence and floating processes on swelling, erosion, and drug release behavior.
Evaluation of tablets
Tablets pressed automatically by the tableting machine were evaluated for tablet hardness, friability, weight uniformity, drug content uniformity, apparent density, floating capacity, swelling, erosion, dissolution, as well as release data modeling. However, manually pressed tablets were evaluated only for apparent density, floating capacity, dissolution, and release data modeling.
Quality control tests
The following tablet quality control tests were conducted in accordance to pharmacopoeia specifications.24
Tablet hardness
Ten tablets were randomly selected, their hardness was examined using the tablet hardness tester, and mean values ± SD were presented.
Tablet friability
Twenty tablets were randomly selected; initial weight was recorded (w1) and tablets were placed in the drum of the friability test apparatus (Copley FRV 1000, UK).
The drum rotation was adjusted to be 25 rpm. The tablets were removed, de-dusted, and accurately weighed (w2). The percentage of weight loss (F) was calculated by equation (2)24:
| (2) |
Tablet weight uniformity
Twenty tablets were randomly selected and accurately weighed individually, and mean weight of all tablets and percentage deviation from the mean for each tablet were presented.
Drug content uniformity
Ten tablets were randomly selected; each individual tablet was weighed then crushed using mortar and pestle. A suitable quantity of powder was extracted with 100 mL, 0.1 N HCl using shaking water bath (Model SS40-D, Grant Instruments Ltd, Cambridge, UK) at 37°C±0.5°C. The solution was filtered through a cellulose acetate membrane (0.45 μm). The drug content was determined by UV/Vis spectrophotometer (Model M501, Camspec Ltd, Cambridge, UK) at 274 nm using the calibration curve presented in Figure 1 after suitable dilution with 0.1 N HCl and percentages of individual drug content were calculated against the average drug content according to the specifications.
Figure 1.
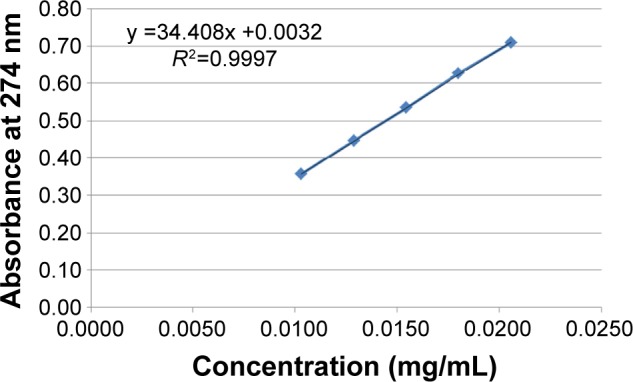
Calibration curve of pentoxifylline in 0.1 N HCl.
Notes: The data represent mean ± SD of three determinations. Error bars cannot be seen on the graph as SD values are very small.
Tablet apparent density
Tablet height (h) and diameter (m) were measured by caliper scale (Moore and Wright Sheffield England Metric, UK). Tablet weight (w) and (π) the circular constant were also used to calculate the tablet apparent density (D) by the following equation (3)25:
| (3) |
Mean values ± SD were presented.
Tablet porosity
Tablet porosity ε, was calculated using the following equation (4)26:
| (4) |
where ρtablet is the tablet apparent density and ρtrue is the true density of the powder mixture or granule samples measured by multipycnometer (MVP-D160-E, Quantach-rome Instruments, USA). Five replicate measurements of almost 1.8 g sample were used, helium pressure was set to be 17 psi, and the difference in helium pressure before and after sample loading was recorded to determine the true volume of the samples. Mean values ± SD were presented.
Tablet floating capacity
The time taken by the tested tablets to appear on dissolution medium surface (floating lag time) and the period of time that the tablets constantly floated on the dissolution medium surface (floating duration) were determined visually throughout the drug release studies,27 and mean values ± SD were presented.
Swelling and erosion studies
Primarily, the initial weights of three tablets were recorded. Dissolution medium uptake (DMU) and mass loss (ML) percentage of the tablets were determined using USP dissolution apparatus II (Erweka GmbH, Germany) under the same conditions of drug release study. Tablets were carefully withdrawn from the medium at 0.5, 1, 2, 4, 6, 8, 12, and 24 hours. Excess liquid on tablet surfaces was removed by a filter paper and the tablets were weighed and then dried in drying oven at 60°C until a constant dry weight was achieved. Swelling rate and mass loss rate were calculated by equations (5) and (6)28:
| (5) |
| (6) |
where Wi is the initial weight of the tablet, Ww is the wet weight of the tablet, and Wd is the dry weight of the tablet and mean values ± SD were presented.
In vitro drug release studies
Drug release studies of the prepared floating tablets were carried out in USP dissolution apparatus II (Erweka GmbH, Germany) at 37°C±0.5°C, and paddle rotation was 50 rpm.24 Tablets were placed in 900 mL of 0.1 N HCl solution (pH 1.2), and as mentioned earlier, pentoxifylline water solubility at 37°C is 191 mg/mL; therefore, dissolution of 60 mg in 900 mL at 37°C is considered under sink conditions. Suitable sample volumes were withdrawn from the dissolution vessels by cannula fitted with filters at 0.5, 1, 2, 4, 6, 8, 12, and 24 hours. Withdrawn volumes were replaced with fresh medium, and drug content was determined by UV spectroscopy at 274 nm, and the cumulative drug release percentage was calculated. Each determination at each time point was performed in triplicate and mean values ± SD were presented.
Release data modeling and analysis
In order to characterize pentoxifylline release mechanism, the power law model of Korsmeyer–Peppas (equation 7) was fitted to the first 60% release data.29
| (7) |
where Qt/Q∞ represents the fractional drug released at time t, Kp is the release rate constant, and n is the release exponent.
Statistical analysis
The statistical software of SPSS 21 (SPSS Inc., Chicago, USA) was used to perform statistical analysis by applying paired-sample t-test, and one-way analysis of variance depending on the type of data. Post hoc multiple comparisons were applied when necessary. A P-value of <0.05 was considered significant.
Results and discussion
Moisture content and CI values
Table 2 shows the results of moisture content and CI values of F1 and F2 formulations before and after granulation. It is clear that the percentage of moisture content decreased significantly (P<0.05) after granulation from 5.37% and 4.76% to 4.13% and 3.49% in F1 and F2 formulations, respectively. In addition, flow characteristics of both formulations have been enhanced significantly (P<0.05) according to CI values from poor to fair level.30
It is known that packing studies of powder and granules can be used to predict their rheological properties. These studies can be carried out with a tapping apparatus where powder or granules specific volume before and after tapping is measured and divided by the used masses to calculate bulk and tapped apparent densities to give information about sample rheological properties.31 It has been argued that a small change in apparent density before and after tapping indicates good flow properties.32
Moreover granulation process is one of the agglomeration techniques where fine solid particles are converted into larger ones by mixing them in the presence of binding liquid using suitable equipment.33 It has been reported that the formed granules can improve powder flowability and mechanical strength and can also narrow bulk density and porosity values.34,35
Differential scanning calorimetry
The compatibility of pentoxifylline model drug with excipients in F1 and F2 formulations before and after granulation was studied using DSC. Figure 2 represent DSC thermograms of pure pentoxifylline, F1 powder mixture, and F1 granules. Although pure pentoxifylline shows a sharp endothermic peak at 104.80°C, a shift to lower temperature and a decrease in peak intensity are noted in F1 granules and F1 powder with endothermic peaks at 94.64°C and 91.84°C, respectively. In addition, as shown in Figure 3, there is also a shift to a lower temperature and a decrease in peak intensity in F2 granules and F2 powder with endothermic peaks at 94.10°C and 90.27°C, respectively. This might indicate a certain loss of drug crystallinity,36 which means part of the pentoxifylline crystals has been converted into the amorphous form during the preparation of both powder mixture as well as granules. Although these observations reflect the existence of interactions between the model drug and other components, as no other thermal event occurred, these interactions do not necessarily indicate incompatibility.37
Figure 2.
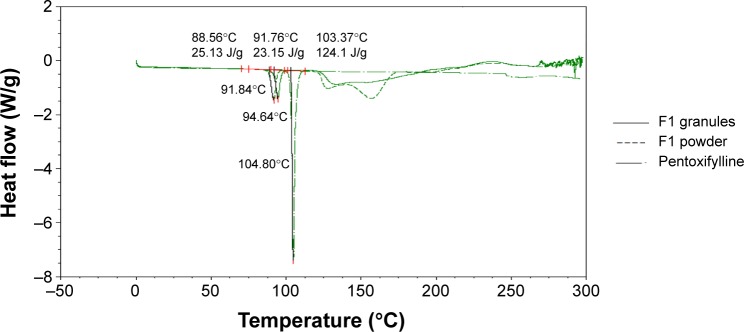
Differential scanning calorimetry thermograms (Exo up) of pure pentoxifylline, F1 powder mixture, and F1 granules.
Abbreviation: Exo up, exothermic transitions up.
Figure 3.
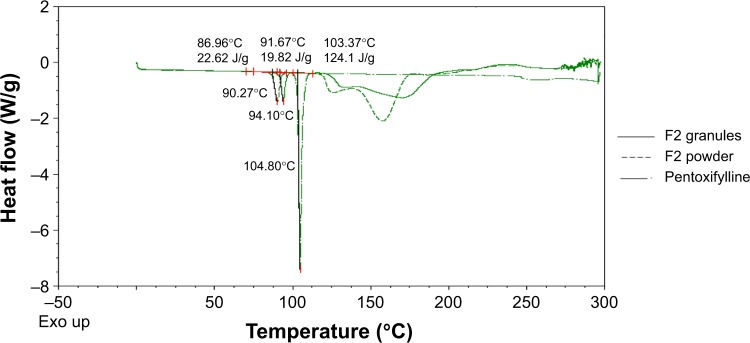
Differential scanning calorimetry thermograms (Exo up) of pure pentoxifylline, F2 powder mixture, and F2 granules.
Abbreviation: Exo up, exothermic transitions up.
Fourier-transform infrared spectroscopy
Fourier-transform infrared spectroscopy was used to study the compatibility of the pentoxifylline model drug with excipients in F1 and F2 formulations before and after granulation. Figure 4 represents the IR spectra of pure pentoxifylline, F1 powder mixture, and F1 granules, while F2 powder mixture and F2 granules are shown in Figure 5. The spectrum of pentoxifylline exhibited characteristic bands at 2,945, 1,701, and 1,658 cm−1 for –CH, –CO, and amide –CO stretching mode. In addition bands were present at 1,433 cm−1 for –CH3 deformation and at 752 cm−1 for –(CH2)n–skeletal vibration.38 The peaks of the model drug are also present almost at the same wave numbers in the spectra of drug-loaded powder mixture and granules of both F1 and F2 formulations, which indicates the absence of incompatibility between the model drug and the formulation excipients.
Figure 4.
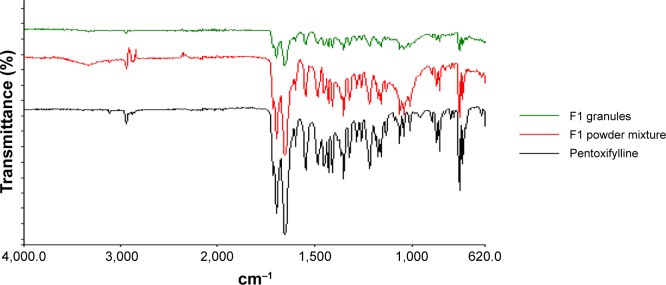
Fourier-transform infrared spectra of pure pentoxifylline, F1 powder mixture, and F1 granules.
Figure 5.
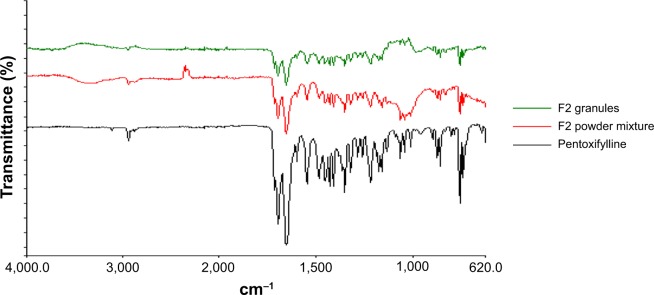
Fourier-transform infrared spectra of pure pentoxifylline, F2 powder mixture, and F2 granules.
Evaluation of tablets
Tablet hardness
After granulation, tablets of F1 and F2 formulations were prepared successfully at level A (50–54 N), and level B (54–59 N) of targeted hardness as presented in Table 3. Both the formulations could not be prepared at the hardness level of 59–64 N; however, this level of hardness was achieved with tablets prepared from the powder mixture.
Table 3.
Properties of pentoxifylline floating tablets of F1 and F2 granule formulations
| Formulation | Hardness level | Hardness (kg)a | Friability (%) | Tablet weight (g)b | Drug content (mg)a |
|---|---|---|---|---|---|
| F1 | (A) | 5.2±0.27 | 0.80 | 0.290±0.00 | 57.82±1.63 |
| (B) | 5.7±0.33 | 0.60 | 0.292±0.00 | 57.13±0.64 | |
| (C) | NA | NA | NA | NA | |
| F2 | (A) | 5.0±0.24 | 0.88 | 0.318±0.01 | 56.63±0.97 |
| (B) | 5.9±0.31 | 0.66 | 0.306±0.00 | 53.43±1.45 | |
| (C) | NA | NA | NA | NA |
Notes:
The data represent mean ± SD of 10 determinations.
The data represent mean ± SD of 20 determinations. The hardness of the prepared tablets was adjusted at three levels: A (50–54 N), B (54–59 N), and C (59–64 N) using a hardness tester (Model 2E/205, Schleuniger & Co., Switzerland).
It has been reported that the chemical composition of alginates affects their compression behavior, where alginates with low guluronic acid content behave more elastically than alginates with low mannuronic acid content. In addition, the plasticity of potassium alginates is higher than that of sodium alginates. However, alginates deform elastically.39 Generally, the granulation process might enhance elastic recovery of alginate molecules after compression, which could explain the inability to prepare tablets of both F1 and F2 formulations at level (C) of hardness after granulation. For this reason, the floating capacity, swelling, and drug release behaviors of drug-loaded matrix tablets were evaluated at two hardness levels (A and B) instead of three.
Tablet friability, weight, and drug content uniformity
Results of friability (%), average weight (g), and average drug content (mg) of prepared matrix tablets of both F1 and F2 formulations are presented in Table 3. For friability test, there were no signs of cracked, split, or broken tablets at the end of the test. Additionally, all results are between 0.60% and 0.88%, which fit British Pharmacopoeia (BP) limits, where tablets had friability values less than 1%.24 In addition, as tablet hardness level increases, mass loss percentage decreases.
All prepared tablets of F1 and F2 formulations (Table 3) complied with BP specification24 with respect to weight uniformity test.
For content uniformity test, Table 3, results are in the acceptable range, indicating that all matrix tablets fit to (BP) criteria in which each tablet drug content was between 85% and 115% of related average content.24
Tablet apparent density
Apparent densities of the prepared tablets of F1 and F2 formulations are calculated by equation (3) and the results are shown in Table 4. Generally, increasing tablet hardness level increases significantly (P<0.001) the apparent density of all prepared tablets as shown in Table 4. This might be justified by the reduction in measured tablet thicknesses as particles become more adjacent to each other by increasing the compression force as shown in Table 4.
Table 4.
Apparent density of F1 and F2 formulations before and after granulation
| Formulation | Hardness level | Origin of prepared tablets
|
|||
|---|---|---|---|---|---|
| Powder mixture
|
Granules
|
||||
| Tablet apparent density (g/cm3) | Tablet thickness (cm) | Tablet apparent density (g/cm3) | Tablet thickness (cm) | ||
| F1 | (A) | 1.30±0.00 | 0.294±0.01 | 1.26±0.00 | 0.303±0.01 |
| (B) | 1.32±0.01 | 0.298±0.01 | 1.29±0.01 | 0.298±0.02 | |
| F2 | (A) | 1.34±0.00 | 0.322±0.01 | 1.32±0.00 | 0.327±0.00 |
| (B) | 1.36±0.01 | 0.316±0.01 | 1.36±0.01 | 0.318±0.02 | |
Notes: The data represent mean ± SD of three determinations. The hardness of the prepared tablets was adjusted at three levels: A (50–54 N), B (54–59 N), and C (59–64 N) using a hardness tester (Model 2E/205, Schleuniger & Co., Switzerland).
Furthermore, Table 5 shows the statistical effect of the granulation process on apparent density of F1 and F2 formulations at both hardness levels. It is obvious that the granulation process causes a significant (P<0.05) decrease in tablet apparent densities of F1 formulation at both hardness levels. In addition, a significant (P=0.001) decrease is noted in tablet apparent density results of F2 formulation prepared at hardness level (A); however, a nonsignificant (P=0.363) decrease is noted at level (B) of hardness.
Table 5.
Statistical analysis (P-value) results of effect of granulation process on apparent density results of F1 and F2 formulations at different hardness levels
| Formulation | Hardness level | P-value |
|---|---|---|
| F1 | (A) | <0.001 |
| (B) | 0.001 | |
| F2 | (A) | 0.001 |
| (B) | 0.363 |
Note: The hardness of the prepared tablets was adjusted at three levels: A (50–54 N), B (54–59 N), and C (59–64 N) using a hardness tester (Model 2E/205, Schleuniger & Co., Switzerland).
It was noted that the elastic recovery of sodium alginate (after granulation process) effect is reduced when sodium bicarbonate level is increased up to 20% w/w (in F2 formulation) at hardness level (B). This might be explained by the high true density value of sodium bicarbonate,40 which is 2.173 g/cm3. This high true density value in addition to the high compression pressure of level (B) might inverse the elastic recovery effect of the granulation process on the apparent density results of F2 formulation at hardness level (B) (Table 4).
Tablet porosity
Tablet porosity percentage of F1 and F2 formulations are presented in Figure 6. Generally, increasing tablet hardness level significantly (P<0.05) decreases the porosity percentages. This complies with the tablet thickness results presented in Table 4, where increasing the tablet hardness from level (A) to level (B) reduces the measured tablet thicknesses as particles become more adjacent to each other.
Figure 6.
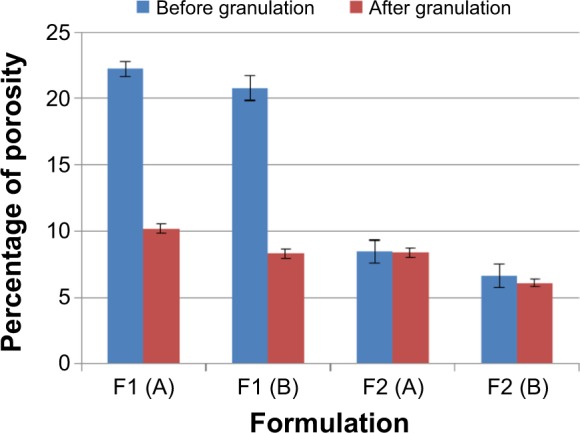
Porosity percentage of F1 and F2 formulations before and after granulation. Note: The hardness of the prepared tablets was adjusted at three levels: A (50–54 N), B (54–59 N), and C (59–64 N) using a hardness tester (Model 2E/205, Schleuniger & Co., Switzerland).
Furthermore, the granulation process decreases the tablet porosity significantly (P<0.05) for F1 formulation where P<0.001 at both hardness levels, and nonsignificantly (P>0.05) for F2 formulation at hardness level (A) and (B). The effect of different treatment conditions on the production of cross-linked drug alginate granules has been reported by a previous study.41 This study demonstrated that increasing the water binder volume decreases porosity during the wet massing stage, and this reduction in porosity can delay dissolution media entrapment through the matrix at an early stage of the dissolution test. This might justify the significant (P<0.05) reduction of porosity results of F1 formulation at both hardness levels. However, the nonsignificant effect of granulation process in F2 formulation can be justified by their higher content of sodium bicarbonate; as shown in Figure 6, increasing the level of sodium bicarbonate from 10% (in F1 formulation) to 20% w/w (in F2 formulation) significantly (P<0.05) decreases all tablet porosity results. For this, the tablet porosity results might reach a level after which no significant effect of the granulation process can be noted in F2 formulation.
Tablet floating capacity
Sodium bicarbonate enhances the floating behavior of tablets due to the release of carbon dioxide gas, which will be entrapped in the formed gel layer around the tablets and results in reducing tablet density to facilitate the floating process. Table 6 represents all prepared tablet floating capacity results.
Table 6.
Floating lag time and floating duration of F1 and F2 formulations at different hardness levels
| Formulation | Hardness level | Floating lag time (min)
|
Total floating duration (h)
|
||
|---|---|---|---|---|---|
| Origin of prepared tablet
|
Origin of prepared tablets
|
||||
| Powder mixturea | Granulesa | Powder mixture | Granules | ||
| F1 | (A) | 0.84±0.08 | 6.54±1.19 | >12 | >8 |
| (B) | 1.81±0.25 | 9.78±1.77 | >12 | >8 | |
| F2 | (A) | 0.44±0.03 | 4.13±0.35 | >24 | >24 |
| (B) | 0.92±0.05 | 4.48±0.67 | >24 | >24 | |
Notes:
The data represent mean ± SD of three determinations. The hardness of the prepared tablets was adjusted at three levels: A (50–54 N), B (54–59 N), and C (59–64 N) using a hardness tester (Model 2E/205, Schleuniger & Co., Switzerland).
Statistical analysis (P-value) of changing hardness level on tablet floating lag time of F1 and F2 formulations originally prepared from powder mixture or granules revealed that changing the hardness level in both formulations prepared from the powder mixture causes a significant (P<0.05) increase in the floating lag time (Table 6) where P=0.003 and P<0.001 for F1 and F2, respectively. These results are in agreement with porosity data where increasing hardness level leads to decreasing tablet porosity. For this penetration of acidic medium into the matrix to react with sodium bicarbonate will take time, which will delay the tablet floating process.
Furthermore, there is also an increase in the lag time measurements in formulations originally prepared from the granules due to changing the hardness level (Table 6). However, the delay in the floating lag time is not significant (P>0.05) where P=0.057 and P=0.461 for F1 and F2 formulations, respectively. This can be justified by the high elastic recovery of sodium alginate due to the granulation process. This means that the formed granules can show higher resistance to changing the hardness from level (A) to level (B), which results in a nonsignificant (P>0.05) effect on the floating lag time.
Moreover, the granulation process causes a significant (P<0.05) increase in the tablet floating lag time compared to that of tablets prepared from powder mixtures before granulation (Table 6). This can be related to the decrease in the porosity level after the granulation process, which agrees with the study by Mukhopadhyay et al.41 For this, the penetration of acidic medium into the tablet matrix will be delayed and sodium bicarbonate will take a longer time to start generation of sufficient carbon dioxide bubbles to initiate floating process.
Furthermore, changing sodium bicarbonate concentration from 10% to 20% w/w leads to a significant (P<0.05) decrease in lag time records of tablets prepared originally from powder mixture at both hardness levels, where P=0.008 and P=0.017 for level (A) and level (B), respectively. Increasing sodium bicarbonate content available for acidic medium will enhance the rate as well as the efficiency of the effervescence reaction, which is represented by the shorter floating lag time results. However, the reduction in lag time values is not significant (P>0.05) in tablets prepared originally from granules at levels (A) and (B) of hardness. This complies with what has been mentioned earlier about the effect of the granulation process on the porosity level. The granulation procedure can reduce porosity during the wet massing stage, which will make it more difficult for the acidic medium to penetrate into the matrix structure to start effervescence reaction. From this, it could be indicated that the granulation process effect on the floating lag time results is more predominant than that of changing the tablet hardness or the gassing agent levels.
For floating duration, although, F1 tablets prepared originally from the powder mixture at both hardness levels floated for >12 hours, but there is 4 hours reduction in their floating duration after the granulation process. In addition, there is no difference in floating duration of F2 formulations before and after granulation at both hardness levels, where they floated for >24 hours. It is clear that 20% w/w concentration is more effective than 10% w/w concentration to keep tablets on the surface of the dissolution medium for a longer duration of time.
Swelling and erosion studies
Swelling and erosion studies of sodium alginate, hydroxyethyl cellulose binary mixture based matrix tablets were used to make a correlation with drug release profiles and release mechanism. Nonfloating tablets with 0% w/w sodium bicarbonate concentration were used in this study beside 10% and 20% w/w concentration to clarify the effect of the effervescence process as well as the gassing agent concentration on swelling, erosion, and drug release results.
In addition, only tablets prepared from granules were subjected to swelling and erosion study because of their good flow properties that facilitate their automatic pressing (this is supported by Javaheri et al study,42 for liquisolid tablet formulations) by the single-punch tableting machine.
Figure 7 shows the percentage of DMU, for all prepared tablets, in 0.1 N HCl medium, where all records show continuous increase in swelling rate until 12 hours of the experiment.
Figure 7.
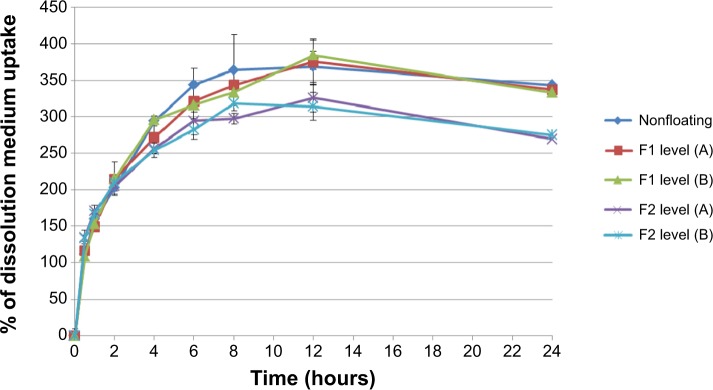
Percentage of medium uptake for nonfloating tablets, and F1 and F2 formulations of floating tablets pressed at level (A) and (B) of hardness in 0.1 N HCl medium.
Notes: The data represent mean ± SD of three determinations. The hardness of the prepared tablets was adjusted at three levels: A (50–54 N), B (54–59 N), and C (59–64 N) using a hardness tester (Model 2E/205, Schleuniger & Co., Switzerland).
Increasing tablet hardness from level (A) to (B) in both F1 and F2 formulations does not cause a significant (P>0.05) effect in the swelling rate results. Tablets (from F2 formulations) prepared at both hardness levels show a significant (P<0.05) increase in DMU (compared to tablets prepared from F1 formulations).
When a tablet floats on the dissolution medium, its upper surface will not come in contact with the medium, while other surfaces will be placed under the dissolution medium surface. However, if it sinks after a period of time, all surfaces of this tablet will become completely available for the DMU. For this, the surface area available for water uptake and the floating duration can explain the lower swelling rate of F2 formulation in comparison with F1 formulation (Figure 7). As mentioned previously, F2 formulation floats for >24 hours while F1 formulations float for only >8 hours and then sink for the rest of the experiment time. This means that the upper tablet surface of F1 formulation becomes available for the DMU after sinking and the tablet shows higher swelling rate by the end of the experiment.
In addition, nonfloating tablets that stay under the surface of the dissolution medium for all the experiment time show an almost similar swelling rate profile of those of F1 formulations as presented in Figure 7 and the difference is not significant (P>0.05). However, F2 formulation tablets show significant (P<0.001) lower swelling rate results than those of nonfloating tablets. Figure 8 represents the percentage of mass loss of all prepared tablets where all tablets show gradual loss in their masses up to almost half of their original weight at the end of 24 hours. Moreover, increasing hardness levels do not show a significant (P>0.05) effect on mass loss values. However, changing sodium bicarbonate concentration from 10% w/w (F1 formulations) to 20% w/w (F2 formulations) increases significantly (P<0.05) the mass loss in F2 formulations for the hardness level (A) and level (B). This can be explained by a higher effervescence effect due to higher gassing agent level, which will liberate more carbon dioxide bubbles. This means more mass loss from the tablet matrix due to the effervescence process. Furthermore, nonfloating tablets generally show the lowest mass loss percentage profile as shown in Figure 8 and their results are significantly (P<0.05) lower than F1 and F2 formulations.
Figure 8.
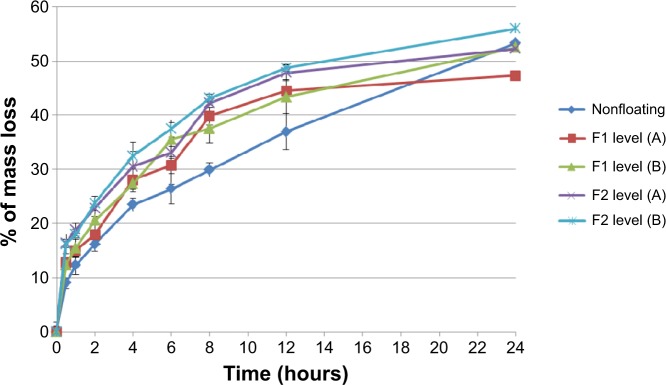
Percentage of mass loss for nonfloating tablets, and F1 and F2 formulations of floating tablets pressed at levels (A) and (B) of hardness in 0.1 N HCl medium.
Notes: The data represent mean ± SD of three determinations. The hardness of the prepared tablets was adjusted at three levels: A (50–54 N), B (54–59 N), and C (59–64 N) using a hardness tester (Model 2E/205, Schleuniger & Co., Switzerland).
In vitro drug release studies
Dissolution profiles of both F1 and F2 formulations at different hardness levels before and after granulation are shown in Figures 9 and 10. Generally, increasing the tablet hardness level causes a decrease in the drug release profiles of the tablets prepared originally from the powder mixture as well as from the granules. Statistically, the tablets prepared from the powder mixture show a significant (P<0.05) decrease in their drug release profiles when their hardness level increases from level (A) to level (B).
Figure 9.
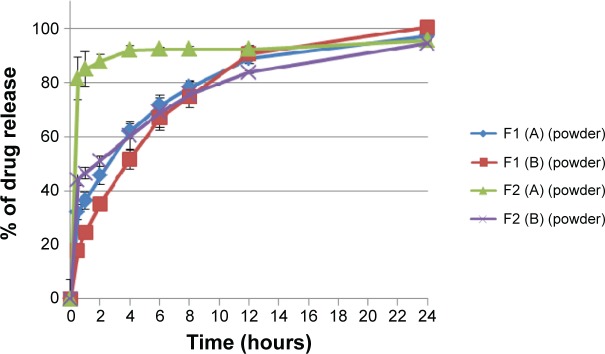
Percentage of drug release of F1 and F2 formulations floating tablets pressed at level (A) and (B) of hardness in 0.1 N HCl medium before granulation.
Notes: The data represent mean ± SD of three determinations. The hardness of the prepared tablets was adjusted at three levels: A (50–54 N), B (54–59 N), and C (59–64 N) using a hardness tester (Model 2E/205, Schleuniger & Co., Switzerland).
Figure 10.
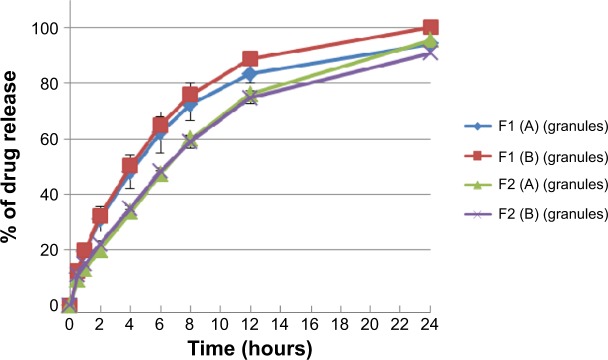
Percentage of drug release of F1 and F2 formulations floating tablets pressed at level (A) and (B) of hardness in 0.1 N HCl medium after granulation.
Notes: The data represent mean ± SD of three determinations. The hardness of the prepared tablets was adjusted at three levels: A (50–54 N), B (54–59 N), and C (59–64 N) using a hardness tester (Model 2E/205, Schleuniger & Co., Switzerland).
Although Liew et al43 argued that both gel layer generation around a matrix tablet as well as its porosity will control the drug release process, but not the dry matrix porosity; however, Sanchita et al44 reported a significant difference in drug release from highly compressed tablets, indicating that there is a limit of hardness above which the porosity of a dry matrix will affect the penetration of the dissolution medium inside the tablet. Additionally, this complies with results of the present study for the porosity, where increasing the compression force makes powder mixture particles more close to each other and reduces the porosity percentage significantly (P<0.05). For this, the penetration of the dissolution medium into the matrix to dissolve pentoxifylline model drug is more difficult, which delays the drug release process.
Moreover, increasing the hardness level does not cause a significant (P>0.05) decrease in the drug release profiles of the tablets prepared from the granules where P=0.399 and P=0.250 for F1 and F2 formulations, respectively. These findings fit the results described earlier of the effect of changing the hardness level on the lag time of the tablets prepared originally from the granules. This means that sodium alginate high elastic recovery resists the effect of increasing the hardness level on the drug release profiles. Additionally, Ebube and Jones45 reported a minimal effect of compression force on acetaminophen release behavior from either hydroxypropyl methylcellulose or hydroxypropyl cellulose matrix tablets prepared with granulation.
The effect of the granulation process on drug release behavior from F1 and F2 formulations at different hardness levels reveals that granulation process reduces drug release profile of all prepared tablets. A significant (P<0.05) decrease is noted in the release profiles at level (A) of hardness in both F1 and F2 formulations, where P=0.009 and P<0.001, respectively, and at level (B) of hardness in F2 formulation, where P<0.001. However, the effect of the granulation process on the drug release process at level (B) of hardness in F1 formulation is not significant (P>0.05). Totally, this complies with the Mukhopadhyay et al study41 where increasing the water binder volume will decrease the porosity during the wet massing stage, and this reduction can delay the dissolution media entrapment through the matrix at an early stage of the dissolution test, which totally decreases the drug release process.
There is a significant (P<0.05) effect of raising sodium bicarbonate level on the rate of drug release of all prepared formulations as shown in Figure 9, where increasing the gassing agent concentration from 10% to 20% w/w increases the drug release rates of formulations prepared originally from powder mixture at level (A) and level (B) of hardness. Increasing the gassing agent level from 10% to 20% w/w increases pore formation in wet matrix tablets due to the effervescence process and the liberation of more carbon dioxide bubbles, which leads to higher drug release profiles.
On the contrary, as shown in Figure 10, increasing sodium bicarbonate concentration decreases significantly (P<0.05) the rate of the drug release from formulations prepared originally from granules at level (A) and level (B) of hardness. This complies with the swelling study results, where the swelling rate of F1 formulation is higher than that of F2 (refer to Figure 7). Accordingly, a higher swelling rate indicates more dissolution medium entrapment in matrix tablets body, which can dissolve and release more drug molecules. Moreover, as shown in Figure 11, nonfloating tablets show a drug release profile (P>0.05) almost similar to that of the F1 formulation. However, F2 formulation tablets show a significant (P<0.001) lower dissolution rate than those of nonfloating tablets.
Figure 11.
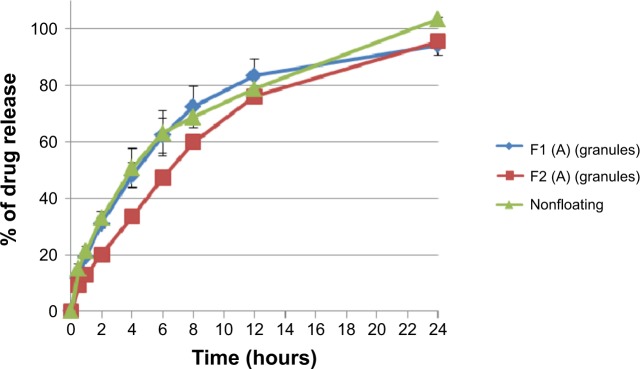
Percentage of drug release of floating and nonfloating tablets pressed at level (A) of hardness in 0.1 N HCl medium after granulation.
Notes: The data represent mean ± SD of three determinations. The hardness of the prepared tablets was adjusted at three levels: A (50–54 N), B (54–59 N), and C (59–64 N) using a hardness tester (Model 2E/205, Schleuniger & Co., Switzerland).
Release data modeling and analysis
In order to evaluate the effect of different variables such as tablet hardness, granulation process, and gassing agent concentration on the drug release mechanism from prepared tablet formulations, the drug release data were fitted to Korsmeyer–Peppas equation (equation 7), which describes drug release from polymeric systems. It has been reported that a drug release mechanism can be predicted from values of exponent (n), where for cylindrical tablet, a value of n≤0.45 indicates Case I transport or Fickian release (release by diffusion), 0.45<n<0.89 indicates anomalous or non-Fickian release (release by diffusion and polymer relaxation), n=0.89 indicates Case II transport (release by polymer erosion and zero-order kinetics), and n>0.89 indicates Super Case II transport (release by polymer erosion).37
As shown in Table 7, drug release results fit Korsmeyer–Peppas equation as correlation coefficients (R2) greater than 0.98 are obtained in most cases except for those tablets prepared originally from powder mixture of F1 formulation at hardness level (A), and of F2 formulation at hardness level (B), where (R2) values are 0.9710 and 0.9459, respectively. Additionally, there are insufficient data points on the release profile ≤60% drug release to provide accurate values for tablets prepared originally from powder mixture of F2 formulation at level (A) of hardness. As shown in Table 7, increasing tablet hardness in F1 formulations prepared originally from powder mixture from level (A) to level (B) of hardness, change the release exponent (n) values from 0.2532 to 0.5057, which indicates a change in the mechanism of the drug release from Fickian to non-Fickian, which means involvement of polymer swelling or relaxation in the release process beside drug diffusion. However, the results of F2 formulation are not clear due to insufficient data points at level (A) of hardness. Furthermore, it has generally been noted that increasing the hardness from level (A) to (B) in tablets originally prepared from the powder mixture decreases the release rate constant (Kp). This complies with in vitro drug release studies, where increasing the compression force makes powder mixture particles more close to each and reduces porosity percentage values. This also delays penetration of the dissolution medium into the matrix to dissolve the model drug, which decreases the drug release rates.
Table 7.
Korsmeyer–Peppas kinetic parameters of different pentoxifylline tablet formulations
| Formulation | Origin of prepared tablets | Hardness level | Korsmeyer–Peppas
|
||
|---|---|---|---|---|---|
| R2 | n | Kp | |||
| Nonfloating | Granules | (A) | 0.9974 | 0.5871 | 0.2212 |
| F1 | Powder | (A) | 0.9710 | 0.2532 | 0.3759 |
| (B) | 0.9969 | 0.5057 | 0.2512 | ||
| Granules | (A) | 0.9989 | 0.5799 | 0.1907 | |
| (B) | 0.9990 | 0.6690 | 0.1990 | ||
| F2 | Powder | (A) | NA | NA | NA |
| (B) | 0.9459 | 0.1503 | 0.4747 | ||
| Granules | (A) | 0.9921 | 0.6822 | 0.1359 | |
| (B) | 0.9907 | 0.6113 | 0.1566 | ||
Notes: NA: There are insufficient data points on the release profiles ≤60% drug release to provide accurate values. The hardness of the prepared tablets was adjusted at three levels: A (50–54 N), B (54–59 N), and C (59–64 N) using a hardness tester (Model 2E/205, Schleuniger & Co., Switzerland).
However, changing the hardness level in tablets prepared originally from granules slightly changes the exponent (n) values in both F1 and F2 formulations, where values are in the range of 0.5799–0.6822, which indicates anomalous or non-Fickian release mechanism. In addition, the release rate constant (Kp) slightly changes by increasing the hardness level. This complies with in vitro drug release studies, where increasing the compression force does not cause a significant decrease in the rate of drug release.
Generally, as presented in Table 7, the granulation process changes the exponent (n) values for both F1 and F2 formulations at both hardness levels from Fickian to a non-Fickian release mechanism, which indicates the involvement of polymer relaxation in the release process in addition to drug diffusion. An exception is noted in F1 formulation prepared at hardness level (B) (Table 7). Moreover, release rate constant (Kp) has been decreased by granulation process. This complies with previous discussion of effect of granulation process on drug release process, where granulation decreases porosity during wet massing stage, and this reduction can delay dissolution media entrapment through the matrix at an early stage of dissolution test, which totally decreases the drug release rate.
In addition, Table 7 shows that the release mechanism of all tablets prepared originally from granules with and without sodium bicarbonate are predominantly controlled by diffusion and polymer relaxation where exponent (n) values are in a range of 0.5871–0.6822. Moreover, the addition of the gassing agent slightly increases the exponent (n) values, which indicates a little more contribution of polymer relaxation and erosion to release mechanism.46 This might be related to the movement of generated carbon dioxide bubbles from internal to peripheral sides of floating tablets, which increases the mass loss or polymer erosion behavior.
Furthermore, it has been noted that as sodium bicarbonate concentration is increased from 0% up to 20% w/w, drug release rate (Kp) is decreased in all tablets prepared originally from granules. This complies with the drug release profiles discussed earlier where increasing sodium bicarbonate concentration makes floating duration longer, which decreases the available surface area of tablets for DMU. In addition, a lower swelling rate is obtained, which means less dissolution medium entrapment in matrix tablet bodies, which is presented by a reduction in drug release rate. Furthermore, the effect of increasing sodium bicarbonate concentration on tablets prepared originally from powder mixture is not clear due to insufficient data points.
Conclusion
In this work, effervescent floating tablets of pentoxifylline were successfully prepared by using sodium bicarbonate as a gas-forming agent and a mixture of hydroxyethyl cellulose and sodium alginate as polymeric matrix. The tablets could float on the surface of dissolution medium and sustain drug release over 24 hours. Tablets prepared with 20% w/w sodium bicarbonate at 50–54 N hardness showed satisfactory results with respect to floating lag time, total floating duration, swelling ability, and sustained drug release profile.
Footnotes
Disclosure
The authors report no conflicts of interest in this work.
References
- 1.Hoffman A. Pharmacodynamic aspects of sustained release preparations. Adv Drug Deliv Rev. 1998;33:185–199. doi: 10.1016/s0169-409x(98)00027-1. [DOI] [PubMed] [Google Scholar]
- 2.Baumgartner S, Kristl J, Vrecer F, Vodopivec P, Zorko B. Optimisation of floating matrix tablets and evaluation of their gastric residence time. Int J Pharm. 2000;195:125–135. doi: 10.1016/s0378-5173(99)00378-6. [DOI] [PubMed] [Google Scholar]
- 3.Singh BN, Kim KH. Floating drug delivery systems: an approach to oral controlled drug delivery via gastric retention. J Control Release. 2000;63(3):235–259. doi: 10.1016/s0168-3659(99)00204-7. [DOI] [PubMed] [Google Scholar]
- 4.Streubel A, Siepmann J, Bodmeier R. Drug delivery to the upper small intestine window using gastroretentive technologies. Curr Opin Pharmacol. 2006;6:501–508. doi: 10.1016/j.coph.2006.04.007. [DOI] [PubMed] [Google Scholar]
- 5.Nayak AK, Maji R, Das B. Gastroretentive drug delivery systems: a review. Asian J Pharm Clin Res. 2010;3:2–10. [Google Scholar]
- 6.Lee TW, Robinson JR. Controlled release drug delivery systems. In: Gennaro AR, editor. The Science and Practice of Pharmacy. 20th ed. I. Remington: Mack Publishing Company; 2000. pp. 1676–1693. [Google Scholar]
- 7.Kagan L, Lapidot N, Afargan M, et al. Gastroretentive accordion pill: enhancement of riboflavin bioavailability in humans. J Control Release. 2006;113:208–215. doi: 10.1016/j.jconrel.2006.03.022. [DOI] [PubMed] [Google Scholar]
- 8.Murphy CS, Pillay V, Choonara YE, Du Toit LC. Gastroretentive drug delivery systems: current developments in novel system design and evaluation. Curr Drug Deliv. 2009;6:451–460. doi: 10.2174/156720109789941687. [DOI] [PubMed] [Google Scholar]
- 9.Xiaoqiang X, Minjie S, Feng Z, Yiqiao H. Floating matrix dosage form for phenoporlamine hydrochloride based on gas forming agent: in vitro and in vivo evaluation in healthy volunteers. Int J Pharm. 2006;310:139–145. doi: 10.1016/j.ijpharm.2005.12.003. [DOI] [PubMed] [Google Scholar]
- 10.Hwang SJ, Park H, Park K. Gastric retentive drug-delivery systems. Crit Rev Ther Drug Carrier Syst. 1998;15(3):243–284. [PubMed] [Google Scholar]
- 11.Chavanpatil MD, Jain P, Chaudhari S, Shear R, Vavia RR. Novel sustained release, swellable and bioadhesive gastroretentive drug delivery system for ofloxacin. Int J Pharm. 2006;316(1–2):86–92. doi: 10.1016/j.ijpharm.2006.02.038. [DOI] [PubMed] [Google Scholar]
- 12.Deshpande AA, Shah NH, Rhodes CT, Malick W. Development of a novel controlled release system for gastric retention. Pharm Res. 1997;14:815–819. doi: 10.1023/a:1012171010492. [DOI] [PubMed] [Google Scholar]
- 13.Davis DW. Method of swallowing a pill. US Patent. 1968;3(418):999. [Google Scholar]
- 14.Rouge N, Buri P, Doelker E. Drug absorption sites in the gastrointestinal tract and dosage forms for site-specific delivery. Int J Pharm. 1996;136:117–139. [Google Scholar]
- 15.Brahma N, Kwon HK. Floating drug delivery systems: an approach to oral controlled drug delivery via gastric retention. J Controlled Release. 2000;63:235–259. doi: 10.1016/s0168-3659(99)00204-7. [DOI] [PubMed] [Google Scholar]
- 16.Seth PR, Tossounian J. The hydrodynamically balanced system, a novel drug delivery system for oral use. Drug Dev Ind Pharm. 1984;10:313–339. [Google Scholar]
- 17.Hilton AK, Deasy PB. In vitro and in vivo evaluation of an oral sustained-release floating dosage form of amoxycillin trihydrate. Int J Pharm. 1992;86(1):79–88. [Google Scholar]
- 18.Rubinstein A, Friend DR. Specific delivery to the gastrointestinal tract. In: Domb AJ, editor. Polymeric Site-Specific Pharmacotherapy. Chichester: Wiley; 1994. pp. 282–283. [Google Scholar]
- 19.Pokrajac M, Miljkovic B, Simic D, Brzakovic B, Galetin A. Pharmacokinetics and bioavailability of pentoxifylline in healthy volunteers – a comparative study of three oral formulations. Eur J Pharm Biopharm. 1997;43:193–196. [Google Scholar]
- 20.Mikac U, Sepe A, Kristl J, Baumgartner S. A new approach combining different MRI methods to provide detailed view on swelling dynamics of xanthan tablets influencing drug release at different pH and ionic strength. J Control Release. 2010;145:247–256. doi: 10.1016/j.jconrel.2010.04.018. [DOI] [PubMed] [Google Scholar]
- 21.Larsson A, Vogt Morten H, Herder J, Luukkonen P. Novel mechanistic description of the water granulation process for hydrophilic polymers. Powder Technol. 2008;188:139–146. [Google Scholar]
- 22.Carr RL. Classifying flow properties of solids. Chem Eng. 1965;72:69–72. [Google Scholar]
- 23.Suliman AS, Anderson RJ, Elkordy AA. Norfloxacin as a model hydrophobic drug with unique release from liquisolid formulations prepared with PEG200 and Synperonic PE/L-61 non-volatile liquid vehicles. Powder Technol. 2014;257:156–167. [Google Scholar]
- 24.British Pharmacopoeia. London, UK: British Pharmacopoeia commission office; 2013. [Google Scholar]
- 25.Ali J, Arora S, Ahuja A, et al. Formulation and development of hydrodynamically balanced system for metformin: In vitro and in vivo evaluation. Eur J Pharm Biopharm. 2007;67:196–201. doi: 10.1016/j.ejpb.2006.12.015. [DOI] [PubMed] [Google Scholar]
- 26.Sun CC. A material-sparing method for simultaneous determination of true density and powder compaction properties – aspartame as an example. Int J Pharm. 2006;326:94–99. doi: 10.1016/j.ijpharm.2006.07.016. [DOI] [PubMed] [Google Scholar]
- 27.Yin L, Qin C, Chen K, et al. Gastro-floating tablets of cephalexin: preparation and in vitro/in vivo evaluation. Int J Pharm. 2013;452:241–248. doi: 10.1016/j.ijpharm.2013.05.011. [DOI] [PubMed] [Google Scholar]
- 28.Sinha Roy D, Rohera BD. Comparative evaluation of rate of hydration and matrix erosion of HEC and HPC and study of drug release from their matrices. Eur J Pharm Sci. 2002;16:193–199. doi: 10.1016/s0928-0987(02)00103-3. [DOI] [PubMed] [Google Scholar]
- 29.Korsmeyer RW, Gurny R, Doelker E, Buri P, Peppas NA. Mechanisms of solute release from porous hydrophilic polymers. Int J Pharm. 1983;15:25–35. doi: 10.1002/jps.2600721021. [DOI] [PubMed] [Google Scholar]
- 30.Well JI, Aulton ME. Preformulation. In: Aulton ME, editor. Pharmaceutics: The Science of Dosage Form Design. Edinburgh: Churchill Livingstone; 1988. pp. 223–253. [Google Scholar]
- 31.Yamashiro M, Yuasa Y, Kawakita K. An experimental study on the relationships between compressibility, fluidity and cohesion of powder solids at small tapping numbers. Powder Technol. 1983;34:225. [Google Scholar]
- 32.Chan LW, Heng PWS. Drug substance and excipient characterization. In: Parikh Dilip M, editor. Handbook of Pharmaceutical Granulation Technology. FL, USA: Taylor and Francis Group; 2005. pp. 79–108. [Google Scholar]
- 33.Wong TW, Cheong WS, Heng PWS. Melt granulation and pelletization. In: Parikh Dilip M, editor. Handbook of Pharmaceutical Granulation Technology. FL, USA: Taylor and Francis Group; 2005. pp. 385–406. [Google Scholar]
- 34.Tardos GI, Khan MI, Mort PR. Critical parameter and limiting conditions in binder granulation of fine powders. Powder Technol. 1997;94:245–258. [Google Scholar]
- 35.Iveson SM, Litster JD, Hapgood K, Ennis BJ. Nucleation, growth and breakage phenomena in agitated wet granulation processes: a review. Powder Technol. 2001;117:3–39. [Google Scholar]
- 36.Vueba ML, Batista de Carvalho LAE, Veiga F, Sousa JJ, Pina ME. Influence of cellulose ether polymers on ketoprofen release from hydrophilic matrix tablets. Eur J Pharm Biopharm. 2004;58:51–59. doi: 10.1016/j.ejpb.2004.03.006. [DOI] [PubMed] [Google Scholar]
- 37.Mura P, Manderioli A, Bramati G, Furlanetto S, Pinzauti S. Utilization of differential scanning calorimetry as a screening technique to determine the compatibility of ketoprofen with excipients. Int J Pharm. 1995;119:71–79. [Google Scholar]
- 38.Indrayanto G, Syahrani A, Moegihardjo S, et al. Pentoxifylline. In: Britain Harry G, editor. Analytical Profiles of Drug Substances and Excipients. Vol. 25. New Jersey: Center for Pharmaceutical Physics; 1998. pp. 295–339. [Google Scholar]
- 39.Schmid W, Picker-Freyer KM. Tableting and tablet properties of alginates: characterisation and potential for soft tableting. Eur J Pharm Biopharm. 2009;72:165–172. doi: 10.1016/j.ejpb.2008.10.006. [DOI] [PubMed] [Google Scholar]
- 40.Cable CG. Sodium bicarbonate. In: Rowe Raymond C, Sheskey Paul J, Quinn Marian E, editors. Handbook of Pharmaceutical Excipients. London: The Pharmaceutical Press; 2009. pp. 629–633. [Google Scholar]
- 41.Mukhopadhyay D, Saville D, Tucker IG. Crosslinking of drug – alginate granules part 2. Effect of granule preparation and composition on granule properties. Int J Pharm. 2008;356:193–199. doi: 10.1016/j.ijpharm.2008.01.022. [DOI] [PubMed] [Google Scholar]
- 42.Javaheri H, Carter P, Elkordy AA. Wet granulation to overcome liquisolid technique issues of poor flowability and compactibility: a study to enhance glibenclamide dissolution. J Pharm Drug Dev. 2014;1(5):501–512. [Google Scholar]
- 43.Liew CV, Chan LW, Ching AL, Sia Heng PW. Evaluation of sodium alginate as drug release modifier in matrix tablets. Int J Phar. 2006;309:25–37. doi: 10.1016/j.ijpharm.2005.10.040. [DOI] [PubMed] [Google Scholar]
- 44.Sanchita M, Sanat KB, Biswanath S. Sustained release of a water-soluble drug from alginate matrix tablets prepared by wet granulation method. AAPS Pharm Sci Tech. 2009;10:4. doi: 10.1208/s12249-009-9333-z. [DOI] [PMC free article] [PubMed] [Google Scholar]
- 45.Ebube NK, Jones AB. Sustained release of acetaminophen from a heterogeneous mixture of two hydrophilic non-ionic cellulose ether polymers. Int J Pharm. 2004;272(1–2):19–27. doi: 10.1016/j.ijpharm.2003.11.020. [DOI] [PubMed] [Google Scholar]
- 46.Jiménez-Martinez I, Quirino-Barreda T, Villafuerte-Robles L. Sustained delivery of captopril from floating matrix tablets. Int J Pharm. 2008;362:37–43. doi: 10.1016/j.ijpharm.2008.05.040. [DOI] [PubMed] [Google Scholar]


