

Abstract
General adoption of advanced treatment protocols such as chronotherapy will hinge on progress in drug delivery technologies that provide precise temporal control of therapeutic release. Such innovation is also crucial to future medicine approaches such as telemedicine. Here we present a nanofluidic membrane technology capable of achieving active and tunable control of molecular transport through nanofluidic channels. Control was achieved through application of an electric field between two platinum electrodes positioned on either surface of a 5.7 nm nanochannel membrane designed for zero-order drug delivery. Two electrode configurations were tested: laser-cut foils and electron beam deposited thin-films, configurations capable of operating at low voltage (≤1.5 V), and power (100 nW). Temporal, reproducible tuning and interruption of dendritic fullerene 1 (DF-1) transport was demonstrated over multi-day release experiments. Conductance tests showed limiting currents in the low applied potential range, implying ionic concentration polarization (ICP) at the interface between the membrane’s micro- and nanochannels, even in concentrated solutions (≤ 1 M NaCl). The ability of this nanotechnology platform to facilitate controlled delivery of molecules and particles has broad applicability to next-generation therapeutics for numerous pathologies, including autoimmune diseases, circadian dysfunction, pain, and stress, among others.
Keywords: Nanochannel membrane, Controlled drug delivery, Chronotherapy, Active release, Ionic concentration polarization, Electrokinetic transport
Introduction
A large number of chronic pathologies benefit from the tunable administration of therapeutics,1 including colorectal cancer,2, 3 rheumatoid arthritis,4 and hypertension,5 among others. For these diseases, a tightly-controlled, temporally-modulated dosing regimen has been shown to be more effective than conventional administration protocols. This finding has spurred the development of chronotherapy, an approach to pharmaceutical agent delivery wherein release is synchronized to natural circadian cycles.6 Unfortunately, widespread development and adoption of chronotherapy has been hampered by a lack of tunable drug delivery modalities capable of synchronization between the circadian clock and administration of therapeutics. Implantable and transdermal technologies leveraging electrokinetic and electromagnetic modulation offer a potential solution to this problem. Tunable drug release has been achieved through approaches such as electroosmotic pumps,7 galvanic cells,8 magnetic resonance,9 and iontophoresis,10 among others. Despite their potential, their use in long term applications is limited by their need for high applied voltage and significant power consumption (electroosmotic pumps and galvanic cells),11 or the requirement for external control devices such as magnetic field oscillators (in the case of magnetic resonance and iontophoretic technologies).12
In addition to the aforementioned platforms, nanofluidic systems have also been shown as suitable for therapeutic applications.13, 14 Micro- and nanofabrication has enabled the production of fluidic channels with dimensions sufficient to exploit a range of transport phenomena, including zero-order passive diffusion,15–18 field effect flow control,19–21 surface dominated conduction,19, 22 and entropic trapping,23 which are unique to fluids confined at the nanoscale. These phenomena are dependent on the accumulation and arrangement of ions in the electrical double layer (EDL) at the interface between the solution and the nanochannel wall.24 By taking advantage of these phenomena, we have previously developed and demonstrated controlled drug release from silicon-based nanochannel membranes housing hundreds of thousands of monodispersed and geometrically defined slit-nanochannels as small as 2.5 nm.25–28 Using these nanochannel membranes, we have leveraged nanoconfinement to achieve zero-order release of pharmaceutical agents at clinically relevant rates over extended durations in vivo.29–32
Here we report on the next generation of our zero-order delivery nanochannel membranes to enable low-power electrostatic and electrokinetic modulation of drug release. These membranes enclosed either 5.7 nm or 1 μm channels employed as experimental or control platforms, respectively. Overlapping EDLs in the 5.7 nm channel membranes could potentially allow electrophoretic or ionic concentration polarization (ICP) to dictate electrokinetic transport behavior. ICP is defined as the accumulation and depletion of charged analytes at the inlets and outlets of nanochannels upon the application of an electric field.33, 34 When ICP is established, the transport of charges across nanochannels is reduced or interrupted, regardless of the polarity of the applied potential.. The 1 μm membranes represented an electrophoretic-dominated control as the channel heights (h) were far greater than the Debye lengths (λD). To help differentiate the predominant transport regime in the 5.7 nm membranes, conductance tests were performed at a variety of different ionic concentrations between 0.01 to 3000 mM NaCl. Platinum electrodes were incorporated onto the surface of membranes in two different configurations: (1) laser-cut foils and (2) electron beam (e-beam) deposited films. Degradation experiments were conducted with both configurations in simulated physiological solution at room temperature and accelerated conditions (90°C). The differential degradation of the different adhesion layers (Ti vs. Ta), deposition angles (15° vs. 90°), and target material (SiN vs. SiC) employed for e-beam deposited electrodes was also evaluated. Finally, the electrical modulation of dendritic fullerene 1 (DF-1) release was investigated from both the 5.7 nm and 1 μm channels at tensions from 0 to 1.5 and 0 to 2 V, respectively. DF-1 was selected as an ideal charged analyte for this study due to its high valence charge, -10.4e at a pH of 7.4, as this would maximize the analyte response to applied potentials in high ionic strength solutions more relevant to the in vivo environment. In principle, our approach could be applicable to any drug molecule or vector possessing appropriate electrophoretic mobility.
Materials and Methods
Current-Voltage membrane characteristics
A custom device was designed and developed to perform the electrical characterization of 5.7 nm membranes. The device is comprised of two primary PVC bodies (McMaster-Carr, Elmhurst, IL USA), both containing a 2 ml reservoir separated by a nanochannel membrane. Pt foils were sandwiched against both surfaces of the membrane by two silicon rubber O-rings (Apple Rubber, Lancaster, NY, USA). A secondary set of rubber O-rings were placed between the Pt foil and PVC sections, and the entire assembly was secured together by 6 SS316L M3 screws (see Electronic Supplementary Information (ESI) Fig. S-1). To determine the current response, a potential was applied between the electrodes using a 33522A function/arbitrary wave generator (Agilent Technologies, Santa Clara, CA, USA) stepped at 50 mV for 5 s to overcome the transient. The last 500 ms were averaged to reduce background noise. The generated current was sampled using a 344DCA multimeter (Agilent Technologies) with a frequency of 50 Hz. Measurements were collected at different ionic concentrations of NaCl prepared by serial dilution, ranging from 0.01 to 3000 mM.. Between experimental sequences, membranes were rinsed in Millipore water for ~5 min and wetted in the experimental solution for ~20 min immediately prior to each characterization.
Electrode stack degradation test
Electrode stacks were fabricated with an ion assisted electron beam evaporator (CHA Industries, Inc., CA, USA) on 700 μm thick bulk Si wafers coated with either SiN or SiC (NanoMedical Systems, Inc., Austin, TX) (see Table 1). Wafers were cleaved into chips (~80 mm2 surface) and cleaned in hot 70% H2SO4 + 30% H2O2. The chips were mounted on a carrier wafer and coated with a layer of SiO2 in the presence of argon plasma to ensure the deposition of a defect free dielectric layer. Ti or Ta adhesion layers, required for the adhesion of noble metals to dielectrics, were deposited, followed by the final Pt film. The thickness of the deposited layers is reported in Table 1. To simulate electrode deposition performed on actual nanochannel membranes, a deposition angle of 15° with respect to the membrane surface was used and compared to deposition at 90°. On the final membranes, this angle was required to avoid clogging the nanochannels during the electrode coating process. Eight different electrode stacks, all of which possessed a SiO2 layer base, were generated (see Table 1). As a control, the same configurations were created in the absence of SiO2. The chips were cleaved into equal halves and soaked in IPA for 2 h in glass bottles and rinsed with Millipore water. Rinsed chips were placed into 50 mM NaCl solution (Sigma-Aldrich, MO, USA) and their degradation tested at both room temperature (23°C) and accelerated conditions (90°C). The rate of degradation was qualitatively recorded once a day for 10 days. The measurement was recorded as either no, partial, or full degradation, based on the extent of surface area from which electrode stacks were observed peeling off the chip.
Table 1.
The eight different electrode stack configurations deposited.
|
|
|
|---|---|
| Electrode stack – Layer thickness
|
Angle of deposition
|
| SiC-SiO2 100 nm, Ti 10 nm, Pt 60 nm (SiC-SiO2/Ti/Pt) | 15°, 90° |
| SiN-SiO2 100 nm, Ti 10 nm, Pt 60 nm (SiN-SiO2/Ti/Pt) | 15°, 90° |
| SiC-SiO2 100 nm, Ta 10 nm, Pt 60 nm (SiC-SiO2/Ta/Pt) | 15°, 90° |
| SiN-SiO2 100 nm, Ta 10 nm, Pt 60 nm (SiN-SiO2/Ta/Pt) | 15°, 90° |
Fabrication of Nanochannel Membrane Electrode Stacks
The nDS membranes used in this study were manufactured using high precision silicon microfabrication techniques as described previously.25 Briefly, a defined pattern of slit-nanochannels, 5.7 nm in height (h), were manufactured parallel to the silicon wafer surface in between a chemically deposited silicon nitride (SiN) thin-film (1.7 μm thick) and a silicon wafer (700 μm thick) by means of a sacrificial layer technique.25 The inlets and outlets of these nanochannels, also known in literature as nanoslots,35 were comprised of microchannels etched perpendicularly through the silicon wafer and the deposited SiN layer, with cross sections of 1 × 3 μm. Microchannel membranes, also used in this study, were obtained by removing the SiN layer from atop the silicon wafer with HF. Two different methods were employed to integrate platinum electrodes onto both surfaces of the nDS membranes (see Fig. 1): i) electron beam deposition of thin Pt films (as previously described); ii) laser-cut Pt foils superimposed on silicone gaskets epoxied onto the membrane surface.
Fig. 1.

Images and schematics of the nDS membrane and electrodes, e, used in this study. (A) Optical image of a laser cut Pt-foil electrode. (B) nDS membrane with e-beam deposited Pt electrodes. (C, E, G) Schematics at increasing magnification of an nDS membrane with Pt-foil electrodes epoxied to a silicone gasket, g. (D, F, H) Schematics at increasing magnification of an nDS membrane with deposited Pt electrodes. Nanochannels, nCH, and microchannels, μCH, are indicated. (I) Transmission electron micrograph of a 5.7 nm slit-nanochannel cross-section.
The coating procedure was performed as follows: membranes were cleaned in hot 70% H2SO4 + 30% H2O2 and mounted using double-sided tab holders (3M Company) on a silicon carrier wafer. Kapton® tape (DuPont, DE, USA) was used to mask the membrane edges to avoid electrical short-circuits resulting from possible deposition of metal on the sides of the chip. SiO2, Ti, and Pt layers were sequentially deposited (see description above). Electrode stacks were created from already manufactured nanochannel membranes. As such, to avoid clogging the nanochannels, deposition angles of 15° and 45° were employed on the SiN and Si sides, respectively. The chips possessing microchannels only (silicon nitride removed) were deposited at 90°. The second method used to produce Pt electrodes consisted of laser cutting (A-Laser, Inc., CA, USA) a Pt foil (thickness 200 μm, Sigma Aldrich), and generating the same channel pattern as the membrane. Gaskets (thickness 200 μm) were epoxied (375T, Epoxy Technology) to seal the electrodes to the membrane. Electrical wires (36AWG) were secured to the electrodes with a conductive H20E epoxy (Epoxy Technology) and cured at 150°C for 10 min.
DF-1 Controlled Release
DF-1 (MW=2827 Da) was employed as the solute for controlled release testing. DF-1 possesses a hydrodynamic diameter of 2.5 nm and a high negative valence charge of -10.4e at pH 7.4 (Fig. 2A). It is highly water-soluble, stable in solution and presents an absorbance peak at λ = 320 nm. DF-1 solutions (3 mg ml−1 in 50 mM NaCl) were prepared and pH adjusted at 7.4 by using Na2CO3.
Fig. 2.
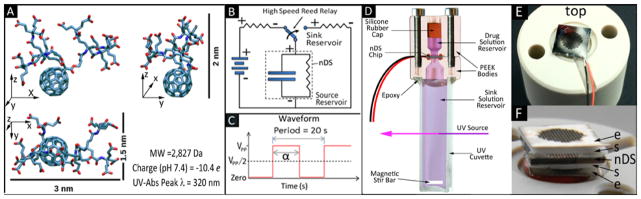
(A) The structure and properties of DF-1. (B) A schematic of the electrical system adopted for testing, including the nDS membrane with electrodes (a resistor in parallel with a capacitor) and the high-speed reed relay used for applying or discharging the potential using a power supply (left branch) or a discharge resistor (right branch). (C) The waveform of the applied voltage (α = 10 s). (D) Schematics of the custom release testing apparatus. (E) nDS membrane with electron beam deposited electrodes placed onto the polyether ether ketone (PEEK) body of the diffusion testing apparatus. PEEK was used as it is nonconductive. (F) nDS membrane assembly with Pt-foil electrodes, e, and silicon gaskets, s.
UV-Vis spectrophotometry was used to study the release of DF-1 through nDS membranes under the influence of an applied AC electric field. The AC electric field was generated by switching a DC voltage (E3643A power supply, Agilent Technologies) applied to the nDS membrane between “off” (passive) and “on” (active) states (Fig. 2B and C) by I052C2RO and I051C2RO high-speed reed relays (American Relays, Inc., CA, USA) controlled by a 33250A arbitrary waveform generator (Agilent Technologies). The circuit was constructed using an Elenco 9440 breadboard (Digikey, MN, USA), 100 Ω shunt resistors, and 3952x Molex plugs (Molex, IL, USA). For absorbance measurements, a Varian Cary 50 Bio UV-Vis spectrophotometer (Agilent Technologies) integrated with a custom 48-cuvette robotic carousel (developed by Quantum Northwest, WA, USA in collaboration with our group)36 was employed. The carousel supplied power to the custom devices. The release study was performed using nDS with SiN-SiO2/Ti/Pt electrodes and a custom testing apparatus composed of two polyether ether ketone (PEEK) bodies housing source and sink reservoirs separated by the nDS membrane with the incorporated Pt electrodes (Fig. 2D). The sink reservoir was obtained by gluing the bottom PEEK body to a UV-macrocuvette (Sigma-Aldrich) with OG116-31 UV-curing epoxy (Epoxy Technology). The two bodies were drilled for wires to connect the electrodes to the control circuit (Fig. 2E). Two silicone rubber O-rings (Apple Rubber, NY, USA) sealed the membrane with the electrodes between the PEEK bodies. When the Pt-foil electrodes were used, a gasket was glued in place on either side of the nDS membrane (Fig. 2F). The membranes were first immersed in isopropyl alcohol (IPA) for 2 h to promote the wetting of all channels and then rinsed with Millipore water. Finally, the chips were immersed in 50 mM NaCl solution overnight prior to the release test. The nDS were then assembled into the custom diffusion devices, 200 μl of DF-1 solution loaded into the source reservoir (3 mg ml−1 in 50 mM NaCl), and 4.25 ml of 50 mM NaCl solution loaded into the sink reservoir. Continuous homogenization of the sink solution was achieved for all testing devices by magnetic stirring at 300 rpm. The test was carried out at room temperature (23 ± 0.2°C). Varying the release modulation was achieved by setting Vpp to different values (0.75, 1.0, 1.25, 1.5, 2 V). UV-absorbance of the sink solution was automatically measured every 60 s for up to 87 h. Passive release profiles were calculated as detailed elsewhere.37 For each modulation period, stabilized release rate values and release rate transients were obtained by linear regression and 2nd-order polynomial interpolation of the cumulative release data, respectively, and normalized with respect to the calculated passive release rates.
Results and Discussion
Membrane Current Response Characterization
Conductance testing of NaCl solutions was performed with 5.7 nm nanochannel membranes to provide insight on the current response to applied voltage. This allowed identification of the dominant electrokinetic phenomena in the transport of charged species across the nanoscale channels. Figure 3 shows the IV curves obtained in the 0 - 5 V range with solutions at the NaCl concentration ranging from 0.01 to 3 M.
Fig. 3.
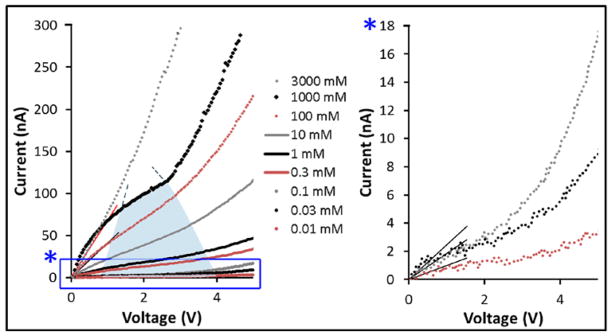
Experimental current-voltage (I–V) results collected with 5.7 nm nanochannel membrane with NaCl at different concentrations. The blue area represents the limiting current region at varying ionic concentration. The graph on the right shows the magnified results for the three lowest concentration. Linear fitting curves are also shown for the estimated ohmic regions. See Supplementary Information (ESI) for direct visual comparison of curves obtained at different ionic concentrations.
The results show a non-linear correlation between the current and applied potential, presenting a transition zone between 1 and 4 V (exception being the 3 M). Similar results were previously obtained by Kim et al38. In this range, the current appears to be impeded as rising voltage resulted in reduced current increase. Such a peculiar trend could be, in principle, ascribed to counterbalancing electrophoretic and electroosmotic transport. To test this hypothesis, we estimated the contributions of electroosmosis and electrophoresis by calculating the relative velocities as:
| (1) |
Where uEO and uEP are the electroosmotic and electrophoretic velocities, respectively, σs is the surface charge density, h is the nanochannel height, E|| is the tangential field, η is the dynamic viscosity, and q and a are the net charge and the size of ions. uEO was evaluated under the highest velocity scenario of overlapping EDL. Based on our experimental conditions, electroosmotic contribution was negligible relative to the electrophoretic transport (uEO/uEP ≈ 0.01). Therefore, this invalidated the hypothesis of their counterbalancing one another to account for diminished current. This conclusion was further supported by the low value obtained for the Pèclet number (Pe) (~0.1). The Péclet number correlates the electrophoretic mobility with the Stokes-Einstein diffusivity. Low Pe numbers indicated that the electrokinetic transport is minor with respect to ionic diffusion.
An alternative explanation of the limiting current behavior observed in our IV curves was the establishment of an ionic redistribution leading to a depletion at the anionic end and an accumulation at the cationic side, consistent with ICP. The electric field across the micro- and nanochannels created a spatial redistribution of ions shifting the predominant system resistance from the nanochannel itself to the micro- to nanochannel interface. This led to limiting/over-limiting current phenomena and resulted in non-linear IV curves, as described by Cheng and Guo39. In Figure 3, three distinct regions are visible: 1) ohmic; 2) limiting; 3) over-limiting. The ohmic region roughly spans from 0 to 1 V. In this voltage range, the resistivity was mostly due to the intra-channel ohmic resistance. Approaching higher potentials (~ 1 V), the ions in the nanochannel began to accumulate at the cationic end, leading to minor current variation as the voltage increased. This transition between the ohmic region and the limiting current region was achieved only when the applied electric field was higher than 1.25 kV/m. Similar results were previously observed by Mai et al.40 In the final over-limiting region, the generation of vortex instability affects the ion flux through the nanochannel regardless of ionic polarization, leading to a recovery in current increase. The over-limiting current was observed when a voltage higher than ~4 V was applied, and a more rapid growth in current was recorded (Fig. 3).34 Similar results were shown by Yossifon et al.35, 41, 42 and were explained in terms of ICP establishment. It is noteworthy that the range of the limiting current region diminished as the ionic concentration increased. At the lowest concentrations, for overlapping EDLs, it was observed in a wide range from 1 to 4 V. In line with previous studies,41, 42 the extent of EDL influence was estimated to be five times the Debye length. The NaCl concentration threshold for overlapping EDL in our system was calculated to be approximately 300 mM. At the concentration of 1 M, a limiting current region (from 1.5 to 2.5 V) was still quite visible despite no EDL overlap (3 nm for 5.7 nm channels). As reported in literature43, weak ion selectivity, required for the limiting-current phenomenon, may still occur for nearly overlapping EDLs. At 3 M, (EDL ≅ 1.5 nm) no limiting region was identifiable. The curve obtained at this concentration may be considered almost purely ohmic. Significant variation in the behavior between the 1 and 3 M experiments could be considered an additional proof that supports the hypothesis of ICP.
To further support the ICP hypothesis we analyzed the ionic selectivity of our nanochannel membrane in the NaCl concentration range 0.01 mM – 3 M. Ion selectivity is essential to obtain the ionic depletion at the micro-and nanochannel interface. Following Chang et al.44, and by assuming the electro-neutrality within the channel, we calculated the membrane conductance as a function of the ionic concentration as:
| (2) |
Where F is the Faraday’s constant, μ is the ionic mobility, Σ is the concentration of ions in the nanochannel volume, C0 is the molarity of the solution, and w, h, and l are the width, height, and length of the channel, respectively. Fig. 4 presents the conductance of the membrane, a function of the electrolyte molarity, calculated in the limiting current region.
Fig. 4.

Conductance of NaCl aqueous solution-filled nanochannel membrane as function of the ionic concentration C0. The dash lines were calculated using equation 2 for the microchannel and the nanochannel. The grey line is a result of the serial addition of both micro- and nano-conductance.
It was important to consider that our membranes present inlet and outlet microchannels connecting to the nanochannels. The conductance, calculated with respect to the nanochannels alone, plateaus at sufficiently low concentration (Fig. 4, orange curve), representing a clear sign of ionic selectivity. Yossifon et al.,41 showed a similar sudden shift in conductance at sufficiently high ionic concentration, which was described as the transition where ion selectivity diminished. This prediction was in good agreement with our experimental data exclusively above 1 mM. The conductance calculated for the microchannels alone show good agreement with the experimental data at concentration < 1 mM (Fig. 4 black line). Therefore, a more accurate prediction for the entire range of concentrations required considering the summing contribution of both micro- and nanochannels (Fig. 4 gray line). This behavior has not been previously observed, as this micro- to nano- to microchannel configuration was unique to our system. These results further support the theory that ICP could develop even at high ionic concentrations (≤ 1 M), with weak ion selectivity even in absence of overlapping EDL. In future work, it would be interesting to perform a scaling study focusing on the current response in our membranes at similar ionic concentrations among a larger set of micro- and nanochannel sizes.
Passive Electrode Degradation
Studying the electrode’s stability in ionic solution was imperative for assessing its deployment in physiological conditions. This challenged some material options typically employed by this group in passive release systems, such as incorporating SiC over SiN due to its higher bioinertness. Electrode stacks (n = 8) were tested in both PBS and 50 mM NaCl solutions at room temperature (23°C) and under accelerated conditions (90°C). In the absence of the SiO2 layer, electrode peeling occurred very rapidly when passively soaked in either NaCl or PBS, regardless of the deposition angle. The longest adhered electrodes were completely peeled after only 4 days at 23°C. When the SiO2 layer was present, electrode adhesion was substantially improved. None of the SiO2-containing stacks deposited at 90° were affected. However, during the 10 days of observation at either 23°C or 90°C, peeling was still observed for the stacks deposited at 15°, with the Ti/Pt and Ta/Pt films surviving longer when deposited on SiN as compared to SiC at both room temperature (23°C, partial peeling at 8 days) and accelerated degradation conditions (90°C, partial peeling at 2 days). No significant difference was observed between samples with Ta or Ti adhesion layers. In addition, degradation behavior demonstrated no-dependent on the composition of the high ionic strength solution used in testing (50 mM NaCl or PBS). The SEM surface image (see ESI Section 2) exhibits a substantially higher porosity for the electrodes deposited at 15°. This higher porosity allowed for greater water penetration into the electrode stack and Ti or Ta adhesion layers, which unlike Pt, were not as chemically immune to high salinity solutions. These results were comparable to those described by Geninatti, et al.45 In future investigations, we intend to examine the degradation of the electrodes with an insulating layer, which previous studies46, 47 have suggested may enhance both bioinertness and ICP. Results from these experiments demonstrated that Pt electrodes deposited on SiN with a SiO2 layer had superior resistance to degradation, and were therefore employed in this configuration for the DF-1 release modulation study.
Modulation of DF-1 release
In order to investigate the possibility of modulating the ionic concentration-driven release of DF-1, we modified membranes possessing 5.7 nm slit-nanochannels with the addition of deposited or foil electrodes at the inlet and outlet surfaces. An electrical potential with a square waveform was applied in the range of 0.75 to 2 V. The use of 50 mM NaCl with ca. 1 mM DF-1 resulted in a Debye length more comparable to 100 mM NaCl due to the high charge of DF-1. Observing the IV curve response of 100 mM NaCl (Fig. 3), an ion depletion phenomenon would be expected for tensions higher than 1 V. Membranes possessing 1 μm channels were used as an electrophoretic control (Fig. 5B), as ICP was not expected to occur when λD was substantially smaller than the channel (Fig. 5A), as predicted by the Péclet number (≫1) and Equation 1. Cumulative release and normalized release rate with respect to a passive release profile are shown in Fig. 6. In the membranes with 5.7 nm nanochannels (Fig. 6A, B and C), a consistent decrease in the DF-1 release rate was observed after the application of electrical potentials higher than 1 V, regardless of adopted bias. These results were consistent and provided additional support to the theory of ICP at the micro- and nanochannel interfaces. In the case of Pt-foil electrodes (Fig. 6A), no significant difference in release rate was observed at or below 1 V relative to passive release. Applied voltages at 1.25 and 1.5 V resulted in significant and reproducible drops in average release rate of 57% and 64%, respectively. For deposited electrodes (Fig. 6B and C), the modulating potential on DF-1 release was greatly enhanced. Specifically, average rate drops of 60% where measured at 1 V (Fig. 6B), while almost complete release interruption (reductions of 80 to 98%) were produced at 1.5 V (Fig. 6B and 6C). This was an important result as it demonstrated the tested system was capable of near-complete gating of release through leveraging ion depletion in the nanochannels. This may be attributable to the shorter distance between the electrodes plates: 500 μm and 1.1 mm for deposited and foil electrodes, respectively. As discussed by Eckstein,48 the distance may affect both the intensity and homogeneity of the electric field. The symmetrical square wave was chosen to minimize the degradation of the electrodes while maintaining charge-balance,49 and may have enhanced the possibility of inducing ICP.
Fig. 5.
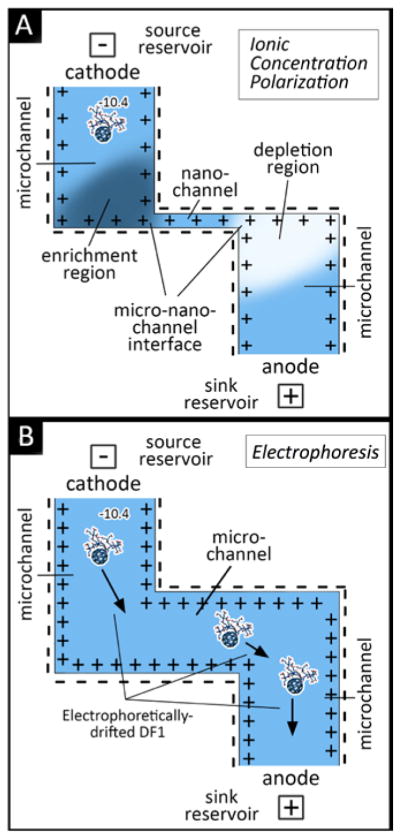
Schematic of nanochannel Delivery System (nDS) membrane under: (A) ionic concentration polarization (ICP) effect in a slit-nanochannels and (B) electrophoretic effect in a microchannel.
Fig. 6.

Cumulative released amount of DF-1 and normalized release rate obtained with the modulation of an applied electrical potential to the electrodes of 5.7 nm (A – C) and 1 μm (D) membranes. Normalized release rates with respect to passive release are shown. Stabilized release rates and rate transients were obtained by linear regression and second-order polynomial interpolation of cumulative release data, respectively. p indicates no potential was applied. The red box in B provides additional support of ICP dominated transport as the application of a symmetric square wave would nullify electrophoretic phenomenon. Both foil (A) and deposited (B – D) Pt electrodes were tested. For clarity, the inset in D displays the experimental curve related to replicate 2. By convention, in our experiments, positive potential and positive bias correspond to the presence of the cathode at the source reservoir side. Calculated passive release curves are also shown for purposes of comparison.
As shown in a previous study with 100 nm nanochannels,21 the results observed with 1 μm channel membranes showed a very different response to the applied potential than the smaller nanochannels. A decrease in DF-1 release rate with respect to the passive trend was observed at negative bias (-1.5 V), while an increase of approximately 20% was produced with a positive bias of 2 V (polarity reversed). These data highlight the electrophoretic nature of DF-1 transport across larger channels, where electrostatic gating due to charge depletion was not likely to play a dominant role. As such, DF-1 is driven to the sink by a positive bias or retarded at the source by a negative bias. Of note is that the passive release profile was re-gained at the cessation of the applied electrical potential in all investigated scenarios. Results show release rate transients after each application or interruption of electrical potential. After these transitory phases of approximately 15 to 30 min, a new steady release rate was established. Such transients may be related to the delay with which the experimental apparatus (custom cuvette device) detected the changes in absorbance within the sink reservoir (ESI Section 3).
A major limitation of flow modulation through application of an electric field across a nanofluidic system is that the relevant analytes in solution must be sufficiently charged. Drug molecules with zero net charge under physiological conditions may require charged delivery vectors such as micelles, liposomes, or fullerene-based complexes50 for controlled transportation across the nanochannels. In addition, it would be interesting in future work to investigate the behavior within the nanochannels when different waveforms are applied. Conditions for selecting the signal generated across the nanoscale junctions in this study must: i) permit ionic redistribution for ICP under applied bias, ii) completely discharge the electrodes, and iii) not allow for significant ICP relaxation when no bias is applied. In light of this, the square waveform potential used was characterized by Vppmax = 1.5 V, Vpp/2 offset, 20 s period, 50% duty cycle (Fig. 6C). This enabled us to establish and maintain the downward modulation of drug release while minimizing power consumption. It is plausible that a similar effect could be achieved with a shorter period and duty cycle while requiring less power consumption. In our study, power consumption of approximately 50 nW was measured (Fig. 3) in 100 mM NaCl conditions, which can be extrapolated to an implant operational period of almost a year when powered by a commercially available, 200 mAh implantable battery. Results indicated that DF-1 delivery was substantially reduced for a given voltage when using the deposited electrodes relative to the Pt-foil, as a nearly complete release shut-off was achieved at 1.5 V. This suggests that developing electrodes in closer proximity to the nanochannels may ultimately be the key for achieving effective release modulation at potentials lower than 1.25 V.
Conclusion
In this manuscript, we have demonstrated a proof-of-concept, tunable nanochannel delivery system for the electrokinetic modulation of molecular transport. The delivery platform consists of a robust and validated nanochannel membrane architecture incorporating Pt electrodes. Degradation tests demonstrated that Pt electrodes deposited on SiN with a SiO2 layer had superior resistance to degradation relative to those deposited on SiC or without a SiO2 layer. Characterization of the current response across nanochannels with an applied voltage demonstrated a non-linear trend, as limiting current behavior was evident between 1 and 3 V. Overlimiting currents were observed above 3 V as rapid current growth was observed with increasing voltage. This transitional IV characteristic highlight the establishment of ICP at the micro- to nanochannel interfaces for low voltages (< 5 V) and high concentrations (≤1 M NaCl). Experimental results demonstrating temporal modulation of DF-1 release also confirmed ICP as both positive and negative biases slowed release in the 5.7 nm nanochannel membranes while positive and negative biases quickened and reduced release in the 1 μm electrophoretic control membranes, respectively. Release modulation was achieved at low applied potential (1.5 V) and low power consumption (100 nW). These proof of concept results demonstrate that this nanofluidic platform has the potential for development into an actively-controlled drug delivery system with suitability for remote external control. Such a system may ultimately enable telemedicine approaches for chronotherapy and other advanced protocols of drug administration.51
Supplementary Material
Acknowledgments
The authors express their heartfelt gratitude to Alma Zecevic, Stefano Filippini, Fatema Dalal, and Elena Riscaldina for the support in the manuscript preparation. The authors thank Randy Goodall and Lee Hudson for fruitful discussions. This work was supported by funds from Houston Methodist Research Institute, CASIS (GA-14-145), NIH NIGMS R21 GM 111544, and NanoMedical Systems, Inc.
Footnotes
The authors D.F., S.H., M.F. and A.G. disclose a financial interest in NanoMedical Systems, Inc. G.B., T.G., R.L.H., and J.S. disclose no competing financial interest.
References
- 1.Youan BB. Advanced drug delivery reviews. 2010;62:898–903. doi: 10.1016/j.addr.2010.04.010. [DOI] [PMC free article] [PubMed] [Google Scholar]
- 2.Li XM, Mohammad-Djafari A, Dumitru M, Dulong S, Filipski E, Siffroi-Fernandez S, Mteyrek A, Scaglione F, Guettier C, Delaunay F, Levi F. Cancer research. 2013 doi: 10.1158/0008-5472.can-13-1528. [DOI] [PubMed] [Google Scholar]
- 3.Focan C, Kreutz F, Graas MP, Longree L, Focan-Henrard D, Demolin G, Moeneclaey N. Pathologie-biologie. 2013;61:e27–31. doi: 10.1016/j.patbio.2010.12.005. [DOI] [PubMed] [Google Scholar]
- 4.To H, Yoshimatsu H, Tomonari M, Ida H, Tsurumoto T, Tsuji Y, Sonemoto E, Shimasaki N, Koyanagi S, Sasaki H, Ieiri I, Higuchi S, Kawakami A, Ueki Y, Eguchi K. Chronobiology international. 2011;28:267–274. doi: 10.3109/07420528.2011.553017. [DOI] [PubMed] [Google Scholar]
- 5.Hermida RC, Ayala DE, Fernandez JR, Portaluppi F, Fabbian F, Smolensky MH. American journal of hypertension. 2011;24:383–391. doi: 10.1038/ajh.2010.217. [DOI] [PubMed] [Google Scholar]
- 6.Levi F. The Lancet Oncology. 2001;2:307–315. doi: 10.1016/S1470-2045(00)00326-0. [DOI] [PubMed] [Google Scholar]
- 7.Chuan-Hua C, Santiago JG. Microelectromechanical Systems, Journal of. 2002;11:672–683. [Google Scholar]
- 8.Wang C, Whitten PG, Too CO, Wallace GG. Sensors and Actuators B: Chemical. 2008;129:605–611. [Google Scholar]
- 9.Hoare T, Santamaria J, Goya GF, Irusta S, Lin D, Lau S, Padera R, Langer R, Kohane DS. Nano letters. 2009;9:3651–3657. doi: 10.1021/nl9018935. [DOI] [PMC free article] [PubMed] [Google Scholar]
- 10.Batheja P, Thakur R, Michniak B. Expert opinion on drug delivery. 2006;3:127–138. doi: 10.1517/17425247.3.1.127. [DOI] [PubMed] [Google Scholar]
- 11.Shuhuai Y, Myers AM, Posner JD, Rose KA, Santiago JG. Microelectromechanical Systems, Journal of. 2006;15:717–728. [Google Scholar]
- 12.Dixit N, Bali V, Baboota S, Ahuja A, Ali J. Current drug delivery. 2007;4:1–10. doi: 10.2174/1567201810704010001. [DOI] [PubMed] [Google Scholar]
- 13.Fine D, Grattoni A, Goodall R, Bansal SS, Chiappini C, Hosali S, van de Ven AL, Srinivasan S, Liu X, Godin B, Brousseau L, Yazdi IK, Fernandez-Moure J, Tasciotti E, Wu HJ, Hu Y, Klemm S, Ferrari M. Advanced Healthcare Materials. 2013;2:625–625. doi: 10.1002/adhm.201200214. [DOI] [PMC free article] [PubMed] [Google Scholar]
- 14.Eijkel JT, Berg A. Microfluidics and Nanofluidics. 2005;1:249–267. [Google Scholar]
- 15.Martin F, Walczak R, Boiarski A, Cohen M, West T, Cosentino C, Shapiro J, Ferrari M. Journal of controlled release: official journal of the Controlled Release Society. 2005;102:123–133. doi: 10.1016/j.jconrel.2004.09.024. [DOI] [PubMed] [Google Scholar]
- 16.Pimpinelli A, Ferrari M, Grattoni A. Applied Physics Letters. 2013;103 [Google Scholar]
- 17.Sabek OM, Ferrati S, Fraga DW, Sih J, Zabre EV, Fine DH, Ferrari M, Gaber AO, Grattoni A. Lab on a chip. 2013;13:3675–3688. doi: 10.1039/c3lc50601k. [DOI] [PubMed] [Google Scholar]
- 18.Grattoni A, Fine D, Ziemys A, Gill J, Zabre E, Goodall R, Ferrari M. Current pharmaceutical biotechnology. 2010;11:343–365. doi: 10.2174/138920110791233280. [DOI] [PubMed] [Google Scholar]
- 19.Karnik R, Castelino K, Majumdar A. Applied Physics Letters. 2006;88 [Google Scholar]
- 20.Sparreboom W, van den Berg A, Eijkel JC. Nature nanotechnology. 2009;4:713–720. doi: 10.1038/nnano.2009.332. [DOI] [PubMed] [Google Scholar]
- 21.Fine D, Grattoni A, Zabre E, Hussein F, Ferrari M, Liu X. Lab on a chip. 2011;11:2526–2534. doi: 10.1039/c1lc00001b. [DOI] [PubMed] [Google Scholar]
- 22.Schoch RB, Renaud P. Applied Physics Letters. 2005;86 [Google Scholar]
- 23.Han J, Craighead HG. Journal of Vacuum Science & Technology A. 1999;17:2142–2147. [Google Scholar]
- 24.Pu Q, Yun J, Temkin H, Liu S. Nano letters. 2004;4:1099–1103. [Google Scholar]
- 25.Fine D, Grattoni A, Hosali S, Ziemys A, De Rosa E, Gill J, Medema R, Hudson L, Kojic M, Milosevic M, Brousseau L, III, Goodall R, Ferrari M, Liu X. Lab on a chip. 2010;10:3074–3083. doi: 10.1039/c0lc00013b. [DOI] [PubMed] [Google Scholar]
- 26.Grattoni A, Shen H, Fine D, Ziemys A, Gill JS, Hudson L, Hosali S, Goodall R, Liu X, Ferrari M. Pharmaceutical research. 2011;28:292–300. doi: 10.1007/s11095-010-0195-6. [DOI] [PubMed] [Google Scholar]
- 27.Celia C, Ferrati S, Bansal S, van de Ven AL, Ruozi B, Zabre E, Hosali S, Paolino D, Sarpietro MG, Fine D, Fresta M, Ferrari M, Grattoni A. Adv Healthc Mater. 2013 doi: 10.1002/adhm.201300188. [DOI] [PMC free article] [PubMed] [Google Scholar]
- 28.Ferrati S, Fine D, You J, De Rosa E, Hudson L, Zabre E, Hosali S, Zhang L, Hickman C, Bansal S, Cordero-Reyes A, Geninatti T, Sih J, Goodall R, Palapattu G, Kloc M, Ghobrial R, Ferrari M, Grattoni A. Journal of Controlled Release. 2013 doi: 10.1016/j.jconrel.2013.09.028. In press. [DOI] [PubMed] [Google Scholar]
- 29.Ferrati S, Nicolov E, Bansal S, Hosali S, Landis M, Grattoni A. Current Drug Target. 2014 doi: 10.2174/138945011614151119125541. in press. [DOI] [PubMed] [Google Scholar]
- 30.Nicolov E, Ferrati S, Goodall R, Hudson L, Hosali S, Crowley M, Palapattu G, Khera M, Grattoni A. The Journal of Urology. 2014;191:e485–e486. [Google Scholar]
- 31.Ferrati S, Nicolov E, Bansal S, Zabre E, Geninatti T, Ziemys A, Hudson L, Ferrari M, Goodall R, Khera M, Palapattu G, Grattoni A. Advanced healthcare materials. 2014 doi: 10.1002/adhm.201400348. n/a-n/a. [DOI] [PubMed] [Google Scholar]
- 32.Ferrati S, Fine D, You J, De Rosa E, Hudson L, Zabre E, Hosali S, Zhang L, Hickman C, Sunder Bansal S, Cordero-Reyes AM, Geninatti T, Sih J, Goodall R, Palapattu G, Kloc M, Ghobrial RM, Ferrari M, Grattoni A. Journal of controlled release: official journal of the Controlled Release Society. 2013;172:1011–1019. doi: 10.1016/j.jconrel.2013.09.028. [DOI] [PubMed] [Google Scholar]
- 33.Kim SJ, Song YA, Han J. Chemical Society reviews. 2010;39:912–922. doi: 10.1039/b822556g. [DOI] [PMC free article] [PubMed] [Google Scholar]
- 34.Kim P, Kim SJ, Han J, Suh KY. Nano letters. 2009;10:16–23. doi: 10.1021/nl9023319. [DOI] [PMC free article] [PubMed] [Google Scholar]
- 35.Yossifon G, Mushenheim P, Chang YC, Chang HC. Physical review E, Statistical, nonlinear, and soft matter physics. 2010;81:046301. doi: 10.1103/PhysRevE.81.046301. [DOI] [PubMed] [Google Scholar]
- 36.Geninatti T, Small E, Grattoni A. Measurement Science and Technology. 2014;25:027003. [Google Scholar]
- 37.Grattoni A, Gill J, Zabre E, Fine D, Hussain F, Ferrari M. Analytical chemistry. 2011;83:3096–3103. doi: 10.1021/ac1033648. [DOI] [PubMed] [Google Scholar]
- 38.Jia M, Kim T. Analytical chemistry. 2014;86:10365–10372. doi: 10.1021/ac502726u. [DOI] [PubMed] [Google Scholar]
- 39.Cheng LJ, Guo LJ. ACS nano. 2009;3:575–584. doi: 10.1021/nn8007542. [DOI] [PubMed] [Google Scholar]
- 40.Mai J, Miller H, Hatch AV. ACS nano. 2012;6:10206–10215. doi: 10.1021/nn304005p. [DOI] [PubMed] [Google Scholar]
- 41.Yossifon G, Mushenheim P, Chang YC, Chang HC. Physical review E, Statistical, nonlinear, and soft matter physics. 2009;79:046305. doi: 10.1103/PhysRevE.79.046305. [DOI] [PubMed] [Google Scholar]
- 42.Yossifon G, Mushenheim P, Chang HC. EPL (Europhysics Letters) 2010;90:64004. [Google Scholar]
- 43.Chang HC, Yossifon G, Demekhin EA. Annual Review of Fluid Mechanics. 2012;44:401–426. [Google Scholar]
- 44.Chang HC, Yossifon G. Biomicrofluidics. 2009;3:012001. doi: 10.1063/1.3056045. [DOI] [PMC free article] [PubMed] [Google Scholar]
- 45.Geninatti T, Bruno G, Barile B, Hood RL, Schmulen J, Farina M, Grattoni A. Biomedical Microdevices. 2014 doi: 10.1007/s10544-014-9909-6. in press. [DOI] [PMC free article] [PubMed] [Google Scholar]
- 46.Mani A, Zangle TA, Santiago JG. Langmuir: the ACS journal of surfaces and colloids. 2009;25:3898–3908. doi: 10.1021/la803317p. [DOI] [PMC free article] [PubMed] [Google Scholar]
- 47.Zalazar M, Gurman P, Park J, Kim D, Hong S, Stan L, Divan R, Czaplewski D, Auciello O. Applied Physics Letters. 2013;102 [Google Scholar]
- 48.Eckstein Y, Yossifon G, Seifert A, Miloh T. Journal of colloid and interface science. 2009;338:243–249. doi: 10.1016/j.jcis.2009.06.002. [DOI] [PubMed] [Google Scholar]
- 49.Cogan SF. Annual review of biomedical engineering. 2008;10:275–309. doi: 10.1146/annurev.bioeng.10.061807.160518. [DOI] [PubMed] [Google Scholar]
- 50.Bakry R, Vallant RM, Najam-ul-Haq M, Rainer M, Szabo Z, Huck CW, Bonn GK. International journal of nanomedicine. 2007;2:639–649. [PMC free article] [PubMed] [Google Scholar]
- 51.Deo SK, Moschou EA, Peteu SF, Bachas LG, Daunert S. Analytical chemistry. 2003;75:207A–213A. [PubMed] [Google Scholar]
Associated Data
This section collects any data citations, data availability statements, or supplementary materials included in this article.