Abstract
The proteins associated with gene regulation are often shared between multiple pathways simultaneously. By way of contrast, models in regulatory biology often assume these pathways act independently. We demonstrate a framework for calculating the change in gene expression for the interacting case by decoupling repressor occupancy across the cell from the gene of interest by way of a chemical potential. The details of the interacting regulatory architecture are encompassed in an effective concentration, and thus, a single scaling function describes a collection of gene expression data from diverse regulatory situations and collapses it onto a single master curve.
Cells undertake multiple signaling, regulatory, and biochemical tasks simultaneously, and typically the proteins engaged in these pathways are multipurposed [1]. In the gene regulatory setting, this leaves each gene to compete for regulatory proteins (transcription factors) with an array of binding sites across the genome. In addition, genes often exist in multiple, identical copies due to being carried on plasmid or viral vectors or simply from chromosomal replication as a natural part of the cell cycle. As a result, it is of great interest to predict the quantitative effect of this competition on the regulation of gene expression as a function of parameters such as the transcription factor copy number, the arrangement of binding sites on the gene of interest, and the total number and binding strengths of the array of binding sites available to the transcription factor across the genome.
However, systematic studies of gene expression often measure expression from genes that are isolated from the remaining genes in the cell [2–8]. Recently, there has been great progress in understanding and predicting the consequences for gene expression of competition from other genes in the cell [9–12]. Furthermore, it has been shown that a simple extension of the thermodynamic models of gene expression [13–15] can predict gene expression in a wide array of situations where a transcription factor is shared between either multiple identical copies of a gene or a single copy of a gene competing with other unrelated binding sites [16,17].
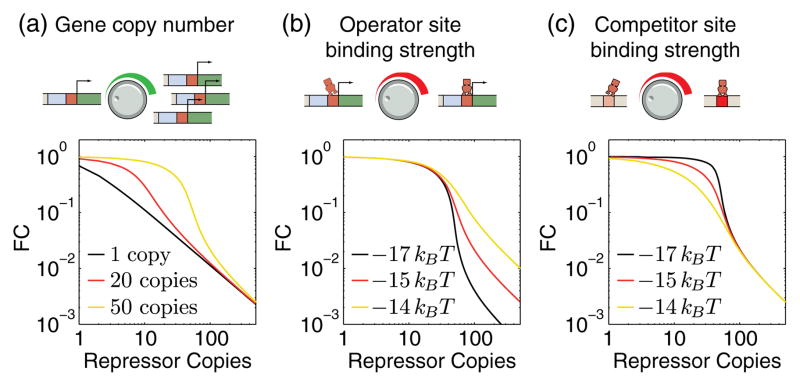
The theory used to predict and interpret expression, derived in the canonical ensemble, is powerful in the sense that it can be used to make predictions for any competition scenario, assuming that the various states of the system can be enumerated, i.e., all the ways the R transcription factors can be distributed amongst N binding sites with binding energy ε. Figures 1(a)–1(c) show theoretical predictions for how changing key regulatory parameters results in unique gene expression profiles as a function of repressor copy number for the case of simple repression in which a gene is under negative control by the action of a repressor molecule. However, an unwieldy facet of the theory is that each curve, though derived from the same core principle, appears to imply a unique and unrelated response curve.
Fig. 1.
Predicted regulatory response. Examples of parameters to tune the competition for transcription factors for the case of a simple repression regulatory architecture and the predicted fold change in gene expression (FC) as a function of the repressor copy number. (a) The gene copy number determines at what value of the repressor copy number the gene shifts from being unrepressed to being repressed. (b) The operator site strength effects the fold change in expression at high repressor copy numbers in the presence of a fixed number (50) of identical genes. (c) The binding strength of competing binding sites effects the sharpness of the transition between unrepressed and repressed state for a fixed operator site binding strength of −15kBT.
In this Letter, we show that when the target sites for repressor molecules are decoupled using the grand canonical ensemble, the predicted transcription of all competition scenarios collapses onto the same simple scaling function for a given promoter architecture. The parameter that fully determines the response is simply e−β(ε−μ), where μ is the chemical potential of the transcription factor, ε is the interaction strength between transcription factor and its binding site at the promoter and β = 1/kBT where kB is Boltzmann’s constant and T is the absolute temperature. This formulation has the added benefit that it can be solved analytically very simply for a number of competition scenarios, which alternatively, in the canonical ensemble lead to challenging calculations. In this work, we calculate the fold change in gene expression (FC), which is defined as the gene expression in the presence of a given number of transcription factors divided by the gene expression in the absence of those transcription factors, as a way to measure the level of regulation from systematically tuning the parameters of that regulation (number of transcription factors, binding strength, etc.) [6,8,18–21]. In the remainder of this Letter, we examine the general framework of the thermodynamic theory in the grand canonical ensemble and work through several examples of transcription factor competition. Most importantly, we show how this new approach to thermodynamic descriptions of gene expression suggests what one might call the “natural variable” for the scaling of fold change in expression. When plotted against this natural variable for the systemin question, a broad spectrum of regulatory data from diverse experimental situations is shown to collapse onto a single master curve, indicating that although these different regulatory scenarios appear superficially different, the underlying structure of the regulatory response is the same.
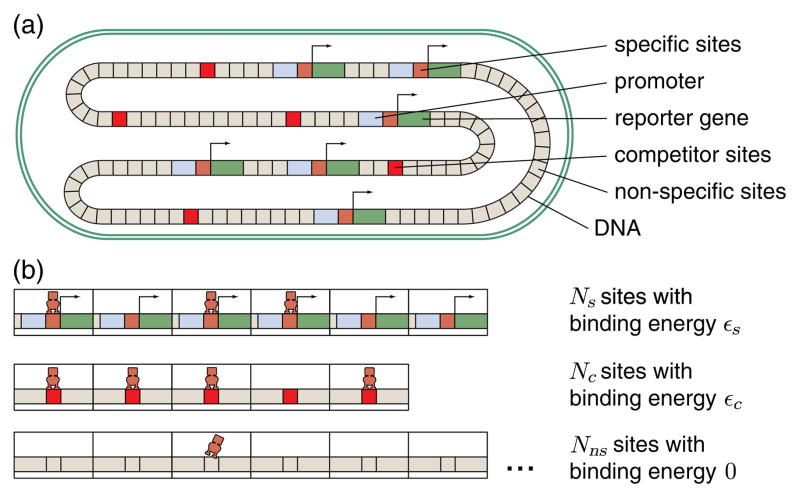
For this work, we focus on the familiar promoter architecture of simple repression (see Fig. 1) [8,15,22] consisting of a single repressor binding site capable of halting transcription by RNA polymerase (RNAP) when a repressor is bound. Note, however, that the framework developed here can be applied to any regulatory architecture (see table 1 in Ref. [15]). In order to derive an expression for FC in the limit where RNAP binding is weak (the promoter is typically not occupied by RNAP [8]), consider a cell with Ns promoter sites. The subscript “s” stands for “specific,” in contrast to the nonspecific sites with subscript “ ns” or competitor sites with subscript “c,” which are introduced later (shown schematically in Fig. 2). Uncorrelated binding of repressors, with copy number R, and RNAP, with copy number P, may occur on the promoter sites. If a promoter site is occupied by repressor, the RNAP cannot bind and the gene is inactive. Let the repressor binding energy to its binding site at the promoter sites be εs, and the RNAP binding energy to the promoter sites be εp. The grand partition function of this binary lattice is given by
Fig. 2.
(a) Schematic of chromosome when viewed as a lattice of possible binding sites that can be occupied (or not) by a repressor. Within the cell are multiple identical, regulated promoters (that produce a measurable gene product), “competitor sites” that bind the repressor stronger than a nonspecific interaction but do not regulate a gene, and nonspecific sites that each bind the repressor weakly. (b) In the grand canonical framework, each of these types of binding site is treated as a lattice of possible binding sites, characterized by the number of sites in the lattice N and the energy with which each site binds the transcription factor ε, with a chemical potential responsible for maintaining balance between the number of molecules bound on each lattice.
| (1) |
| (2) |
In this equation, p̃ is the number of adsorbed RNAP molecules onto the promoter sites, and r̃ is the number of repressors adsorbed onto their promoter binding sites. The multinomial coefficient is
The fugacities are λp = eβμp, where μp is the chemical potential of the RNAP, and λr = eβμr, where μr is the chemical potential of the repressor molecule. The average number of RNAP molecules adsorbed onto the Ns promoter sites is given by
| (3) |
The fold change, FC, is given by the average number of adsorbed RNAP molecules in the presence of the repressors divided by the average number of adsorbed RNAP molecules in the absence of the repressors yielding
| (4) |
where 〈Ps(R = 0)〉 follows from Eq. (3) with λre−βεs = 0. In the weak promoter limit, which is defined by λpe−βεp ≪ 1 [8,15,22], we have
| (5) |
In other words, in the weak promoter limit only the repressor properties are relevant, and we may ignore all properties of the RNAP in the analyses. Another way of looking at Eq. (5) is that the fraction of promoter sites available for the RNAP is proportional to the fraction of promoter sites that are not covered by repressors: repressors are the “masters” and RNAPs are “followers”. We now have a general expression for the fold change in expression, FC, for the simple repressor promoter architecture with a parameter λr that contains information regarding the availability of the repressor in a specific competitive environment (the number of repressors and the strength and copy number of identical or competing binding sites). In the following section, we will derive λr for several important and common regulatory scenarios.
We now wish to derive an expression for the fugacity which tells us about the relative availability of repressors (given a total number of repressors R) to our binding sites of interest. In this way, λr contains information of alternative binding reservoirs for repressors such as number of binding sites and binding affinity. Figure 2 shows a schematic of a cell that contains three options for repressor binding: (1) Ns specific binding sites representing repressor binding with energy εs and regulating a gene copy, (2) Nc competitor binding sites representing specific binding with energy εc to a binding site whose occupancy does not regulate expression, and (3) Nns nonspecific binding sites representing repressor binding to the nonspecific genomic background (taken to be 5 × 10⁶, the size of the E. coli genome). We make the approximation that the binding energies of all the nonspecific sites have the same value and set this value as zero (such that all energies are measured with respect to this nonspecific binding). Each reservoir is characterized by the number of available sites and the energy with which a repressor binds one of these sites. The average number of repressors bound to the specific lattices is
| (6) |
Analogous to Eq. (2) the grand partition energy of either of the two additional, single species binding lattices (nonspecific or competitor) is generically , which leads to the average number of adsorbed repressors on nonspecific DNA sites,
| (7) |
and similarly for the competitor sites,
| (8) |
These reservoirs are connected by the constraint that the total number of repressors bound between them is equal (on average) to the total number of repressors in the cell,
| (9) |
In principle, more unique reservoirs can be added to the conservation equation to account for each specific binding energy available to the molecule of interest; each unique binding energy adds one more reservoir to the problem whose chemical potential must be considered. The substitution of Eqs. (6)–(8) into Eq. (9) leads to a cubic equation for λr of the form , which yields the positive real root
| (10) |
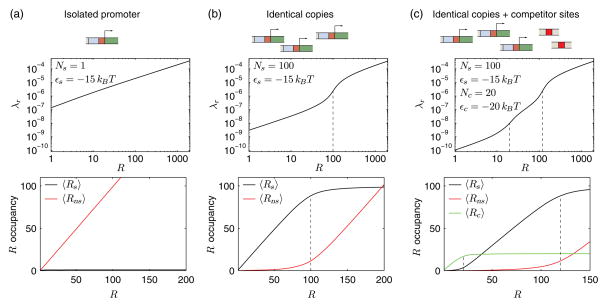
with C1 = (c/3a) − (b/3a)2, and C2 = (bc/6a2) + (R/2a) − (b/3a)3. The coefficients a, b, and c are derived under the conditions that Nns ≫ (R,Ns, Nc), given by a = eβεceβεsNns, b = (eβεc + eβεs)Nns + eβεceβεs (Ns + Nc − R), and c = Nns+ eβεc (Nc − R) + eβεs (Ns − R). When taken with Eq. (5), we now have a closed equation for FC as a function of total repressor copy number R, number of specific (Ns), competitor (Nc), nonspecific (Nns), and binding energies to each of these types of sites. In the limit of no competing sites, i.e., Nc = 0 and e−βεc = 0, Eq. (10) simplifies to the root of a quadratic equation. In the limit of an isolated promoter, where Ns = 1, we recover the canonical expression for FC derived previously, that is, Eq. (5) with λr = R/N ns when R ≫ 1 such that R ≈ 〈Rns〉 [8,15]; however, in the limit of small R the predictions differ slightly because of the different constraints imposed by the models. Figures 3(a)–3(c) shows the fugacity and average occupancy of each lattice vs the number of repressors for each of these cases: isolated promoter, identical promoters, and identical promoters with competitors. The primary features in the occupancy and λr curves occur whenever R becomes large enough to saturate one of the binding lattices; for instance, in Fig. 3(c), first the competitor and then the specific lattice saturate as R becomes larger than Nc and then larger than Nc + Ns.
Fig. 3.
Functional form of the fugacity λr and occupancies of repressor binding sites for different situations. (a) A single isolated promoter. The single specific repressor binding site in the promoter region is filled up immediately, and almost all repressors are bound to the nonspecific sites. (b) Multiple identical copies of the promoter. The specific repressor binding sites are filled up first, before the repressors bind to the nonspecific sites with a 15kBT higher binding energy. The fugacity of the repressors increases abruptly at R = Ns, marked by dashed vertical lines. (c) Multiple identical copies of the promoter and multiple competitor sites. The repressors fill up the competitor binding sites with the lowest repressor binding energy of εc = −20kBT, before binding to the specific binding sites and finally to the nonspecific sites. The fugacity increases abruptly at R = Ns and R = Ns + Nc, marked by the dashed vertical lines.
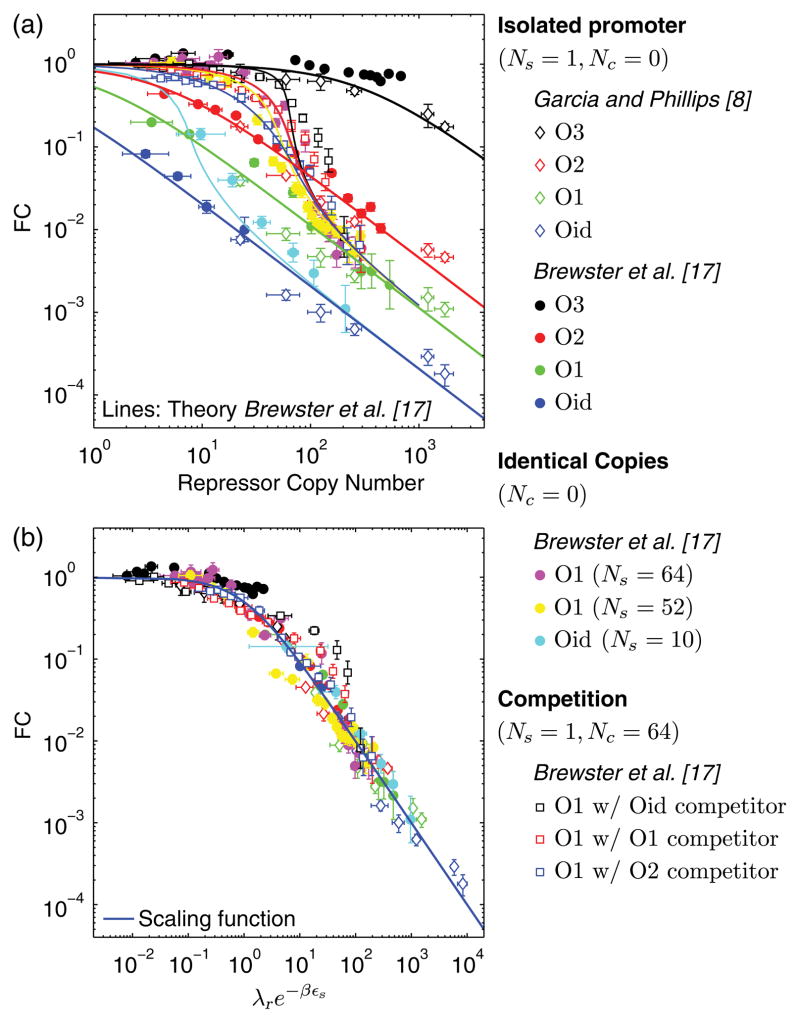
The theoretical ideas developed above really demonstrate their power when used as a prism through which to view a broad spectrum of gene regulation data. Much recent effort has gone into careful measurement of gene expression as a function of key tunable parameters such as the number of transcription factors, the transcription factor binding site strength, the number of gene copies, and the number and strength of competing binding sites. These various scenarios, however, give the superficial appearance of each being a separate and unique quantitative story. To that end, Fig. 4(a) shows the data by Garcia and Phillips [8] and Brewster et al. [17] plotted as the fold change in gene expression FC versus the repressor number R. The common feature between each of these data sets is that the expressed gene is regulated by simple repression; however, each distinct symbol represents a unique repressor binding energy, different number of promoters or competitor sites all with a unique functional form, which are quantitatively described by the theory curves derived in the canonical ensemble and reported in Ref. [17]. Here, we demonstrate that, in fact, within the grand canonical approach Eq. (5) directly reveals the relevant parameter for data collapse, with the same functional form for FC. That is, for any scenario, be it single or several promoters, presence or absence of competitor sites, etc., a data point is uniquely determined by λr and εs. If plotted as FC versus λre−βεs, data collapse should occur and obey Eq. (5). As can be seen in Fig. 4(b) this is indeed the case; over several decades and without adjustable parameters, the data for all of these seemingly distinct regulatory scenarios falls on a single universal curve.
Fig. 4.
Gene expression data by Garcia and Phillips [8] and Brewster et al. [17] for various regulatory scenarios. (a) The data and theory plotted versus the repressor copy number R shows a variety of functional forms. (b) The data rescaled to collapse to the same functional form. The blue solid line is the prediction from Eq. (5) without fitting parameter. The repressor binding energies are taken from Ref. [8] as ε = −9.7kBT for O3, ε = −13.9kBT for O2, ε = −15.3kBT for O1, ε = −17.0kBT for Oid. Values for copy numbers of promoters Ns or competitor binding sites Nc are measured in Ref. [17] by qPCR. For each data set, λr is calculated using these parameters and Eq. (10).
In conclusion, through the grand canonical formalism described here, we are able to predict the fold change in gene expression for a gene regulated by a transcription factor protein that also binds at other unrelated sites within the cell. Conveniently, the effect of this sharing is totally encapsulated in the fugacity parameter λ, which acts as an effective concentration of the transcription factor for a given regulatory scenario, i.e., the spectrum of competing binding sites for the transcription factor present in the cell. As a result, a single scaling function describes the gene regulation for quite distinct competition scenarios, which highlights the fact that in some complex biological settings, distinct phenomena can be seen as reflecting similar underlying mechanisms when using the natural variables of the problem. Specifically, the data collapse in Fig. 4(b) tells us that the same statistical mechanical phenomena are at work in all cases; namely, binding and unbinding of proteins at their target sites. The occupancy of the specific binding sites, which is the relevant quantity that dictates the fold change in gene expression, is determined solely by the fugacity of the repressor and the binding energy of the repressor to the specific sites. It will be of great interest to apply these ideas to other regulatory architectures to see if this same kind of data collapse is able to link seemingly disparate regulatory phenomena.
Acknowledgments
We are grateful to Ned Wingreen, Sarah Marzen, Jane Kondev, Hernan Garcia, Al Sanchez, and Jan Groenewold for extremely helpful discussions. We are also grateful to the NIH for support through Grants No. DP1 0D000217 (Directors Pioneer Award) and No. R01 GM085286 and La Fondation Pierre Gilles de Gennes (R. P.).
Contributor Information
Franz M. Weinert, Department of Applied Physics, California Institute of Technology, 1200 E. California Boulevard, Pasadena 91125, California, USA
Robert C. Brewster, Department of Applied Physics, California Institute of Technology, 1200 E. California Boulevard, Pasadena 91125, California, USA and Division of Biology and Biological Engineering, California Institute of Technology, 1200 E. California Boulevard, Pasadena 91125, California, USA
Mattias Rydenfelt, Department of Physics, California Institute of Technology, 1200 E. California Boulevard, Pasadena 91125, California, USA and Integrative Research Institute for the Life Sciences and Institute for Theoretical Biology, Humboldt University, Unter den Linden 6, 10099 Berlin, Germany.
Rob Phillips, Department of Applied Physics, California Institute of Technology, 1200 E. California Boulevard, Pasadena 91125, California, USA and Division of Biology and Biological Engineering, California Institute of Technology, 1200 E. California Boulevard, Pasadena 91125, California, USA.
Willem K. Kegel, Van ’t Hoff Laboratory for Physical and Colloid Chemistry, Debye Research Institute, Utrecht University, Padualaan 8, 3584 CH Utrecht, The Netherlands.
References
- 1.Salgado H, Peralta-Gil M, Gama-Castro S, Santos-Zavaleta A, Muiz-Rascado L, Garca-Sotelo JS, Weiss V, Solano-Lira H, Martnez-Flores I, Medina-Rivera A, et al. Nucleic Acids Res. 2013;41:D203. doi: 10.1093/nar/gks1201. [DOI] [PMC free article] [PubMed] [Google Scholar]
- 2.Müller J, Oehler S, Müller-Hill B. J Mol Biol. 1996;257:21. doi: 10.1006/jmbi.1996.0143. [DOI] [PubMed] [Google Scholar]
- 3.Elowitz MB, Leibler S. Nature (London) 2000;403:335. doi: 10.1038/35002125. [DOI] [PubMed] [Google Scholar]
- 4.Saiz L, Rubi JM, Vilar JM. Proc Natl Acad Sci USA. 2005;102:17642. doi: 10.1073/pnas.0505693102. [DOI] [PMC free article] [PubMed] [Google Scholar]
- 5.Golding I, Paulsson J, Zawilski SM, Cox EC. Cell. 2005;123:1025. doi: 10.1016/j.cell.2005.09.031. [DOI] [PubMed] [Google Scholar]
- 6.Kuhlman T, Zhang Z, Saier MH, Jr, Hwa T. Proc Natl Acad Sci USA. 2007;104:6043. doi: 10.1073/pnas.0606717104. [DOI] [PMC free article] [PubMed] [Google Scholar]
- 7.Moon TS, Lou C, Tamsir A, Stanton BC, Voigt CA. Nature (London) 2012;491:249. doi: 10.1038/nature11516. [DOI] [PMC free article] [PubMed] [Google Scholar]
- 8.Garcia HG, Phillips R. Proc Natl Acad Sci USA. 2011;108:12 173. doi: 10.1073/pnas.1015616108. [DOI] [PMC free article] [PubMed] [Google Scholar]
- 9.Del Vecchio D, Ninfa AJ, Sontag ED. Mol Syst Biol. 2008;4:161. doi: 10.1038/msb4100204. [DOI] [PMC free article] [PubMed] [Google Scholar]
- 10.Kim KH, Sauro HM. Biophys J. 2011;100:1167. doi: 10.1016/j.bpj.2010.12.3737. [DOI] [PMC free article] [PubMed] [Google Scholar]
- 11.Ricci F, Vallee-Belisle A, Plaxco KW. PLoS Comput Biol. 2011;7:e1002171. doi: 10.1371/journal.pcbi.1002171. [DOI] [PMC free article] [PubMed] [Google Scholar]
- 12.Lee TH, Maheshri N. Mol Syst Biol. 2012;8:576. doi: 10.1038/msb.2012.7. [DOI] [PMC free article] [PubMed] [Google Scholar]
- 13.Ackers GK, Johnson AD, Shea MA. Proc Natl Acad Sci USA. 1982;79:1129. doi: 10.1073/pnas.79.4.1129. [DOI] [PMC free article] [PubMed] [Google Scholar]
- 14.Buchler NE, Gerland U, Hwa T. Proc Natl Acad Sci USA. 2003;100:5136. doi: 10.1073/pnas.0930314100. [DOI] [PMC free article] [PubMed] [Google Scholar]
- 15.Bintu L, Buchler NE, Garcia HG, Gerland U, Hwa T, Kondev J, Phillips R. Curr Opin Genet Dev. 2005;15:116. doi: 10.1016/j.gde.2005.02.007. [DOI] [PMC free article] [PubMed] [Google Scholar]
- 16.Rydenfelt M, Cox RS, Garcia H, Phillips R. Phys Rev E. 2014;89:012702. doi: 10.1103/PhysRevE.89.012702. [DOI] [PMC free article] [PubMed] [Google Scholar]
- 17.Brewster RC, Weinert FM, Garcia HG, Song D, Rydenfelt M, Phillips R. Cell. 2014;156:1312. doi: 10.1016/j.cell.2014.02.022. [DOI] [PMC free article] [PubMed] [Google Scholar]
- 18.Oehler S, Eismann ER, Kramer H, Muller-Hill B. EMBO J. 1990;9:973. doi: 10.1002/j.1460-2075.1990.tb08199.x. [DOI] [PMC free article] [PubMed] [Google Scholar]
- 19.Oehler S, Amouyal M, Kolkhof P, von Wilcken-Bergmann B, Müller-Hill B. EMBO J. 1994;13:3348. doi: 10.1002/j.1460-2075.1994.tb06637.x. [DOI] [PMC free article] [PubMed] [Google Scholar]
- 20.Ryu S, Fujita N, Ishihama A, Adhya S. Gene. 1998;223:235. doi: 10.1016/s0378-1119(98)00237-6. [DOI] [PubMed] [Google Scholar]
- 21.Daber R, Sochor MA, Lewis M. J Mol Biol. 2011;409:76. doi: 10.1016/j.jmb.2011.03.057. [DOI] [PMC free article] [PubMed] [Google Scholar]
- 22.Brewster RC, Jones DL, Phillips R. PLoS Comput Biol. 2012;8:e1002811. doi: 10.1371/journal.pcbi.1002811. [DOI] [PMC free article] [PubMed] [Google Scholar]


