

Management of metastatic colorectal cancer is reviewed, including the role of imaging in each treatment strategy, with emphasis on contemporary chemotherapeutic regimens and new molecular targeted therapies.
Abstract
Evolution in the treatment of metastatic colorectal cancer (mCRC) has led to significant improvement in the survival of these patients. Surgery is useful in patients with resectable disease. Liver-directed therapies such as hepatic arterial infusion, transarterial radio- and chemoembolization, and percutaneous ablation are sometimes used by oncologists when the liver is the only site of metastatic disease. Unresectable mCRC is typically treated with systemic chemotherapy. First-line systemic chemotherapeutic regimens for mCRC are FOLFOX (combination of 5-fluorouracil/leucovorin [5-FU/LV] and oxaliplatin) and FOLFIRI (combination of 5-FU/LV and irinotecan) combined with molecular targeted drugs. Molecular targeted therapies that are effective in treating mCRC include antiangiogenic agents such as bevacizumab—an antibody against vascular endothelial growth factor—and antibodies directed against epidermal growth factor receptor (EGFR). EGFR-directed antibodies such as cetuximab and panitumumab have been shown to produce activity only in wild-type KRAS tumors. Imaging modalities such as multidetector computed tomography (CT), magnetic resonance imaging, and positron emission tomography/CT play a major role in the selection of appropriate treatment strategies. Assessment of treatment response in patients who undergo liver-directed and systemic therapy requires imaging at regular intervals. Recent studies have shown that alternative treatment response criteria may be more predictive of pathologic response in mCRC than conventional criteria such as Response Evaluation Criteria in Solid Tumors. Awareness of unusual response patterns, as well as of complications and toxicities, is helpful in guiding patient management.
©RSNA, 2014
Introduction
Colorectal cancer (CRC) is the fourth most common malignancy in the United States, with an estimated 143,460 new cases diagnosed in 2012 (1). CRC was the second most frequent cause of cancer-related death in 2012, accounting for a total of 51,690 deaths (1). Survival of patients with CRC depends primarily on disease stage. The 5-year relative survival rate is 90% for localized cancers but only 12%–19% for cancers with distant metastases (2–4). The management of stage I–III CRC is mainly surgical, with adjuvant chemotherapy in patients with high-risk stage II and stage III cancers. Chemotherapy is the main therapeutic modality for stage IV cancers. However, surgery and a variety of interventional radiologic techniques are also performed in selected patients with oligometastatic disease.
Stage IV CRC is defined as distant metastases that either (a) are confined to one organ or site (stage IVA), or (b) affect more than one organ or site or the peritoneum (stage IVB). The past decade has seen a paradigm shift in the management of stage IV or metastatic CRC (mCRC), leading to a significant increase in overall survival times for these patients, from less than 6 months to nearly 2 years (5). Much of this success can be attributed to the development of newer chemotherapeutic regimens, increased utilization of hepatectomy in patients with oligometastatic liver disease, and identification of new molecular targets and their inhibitors. Regimens such as FOLFOX (combination of 5-fluorouracil/leucovorin [5-FU/LV] and oxaliplatin) and FOLFIRI (combination of 5-FU/LV and irinotecan) are now established as first-line treatments for mCRC (2,3). The identification of vascular endothelial growth factor (VEGF), a potent angiogenic factor, led to the development of bevacizumab, a VEGF antibody. Bevacizumab was approved by the U.S. Food and Drug Administration (FDA) in 2004 for use in the treatment of mCRC in combination with the FOLFOX and FOLFIRI regimens. Regorafenib, a tyrosine kinase inhibitor with an anti-VEGF effect, was approved by the FDA in 2012 for patients who have progressed through all other standard CRC regimens. Understanding the role of epidermal growth factor receptor (EGFR) and its intracellular signal cascades led to the development of cetuximab and panitumumab, monoclonal antibodies against EGFR (2,3). The understanding that mutations in KRAS, a downstream signaling protein in the EGFR pathway, is a predictor of nonresponsiveness to anti-EGFR antibodies led to the molecular classification of mCRC into KRAS–wild-type mCRC and KRAS-mutant mCRC (2,3).
Imaging plays an important role in the workup of patients with mCRC by helping enumerate the number and sites of metastases, determine resectability, assess response to systemic and liver-directed therapies, and detect drug toxicities and disease recurrences. Concurrent with advances in the treatment of mCRC, there have been major advances in radiology, with the development of new imaging modalities, functional imaging techniques, and contrast media and the proposal of alternative tumor response criteria (6,7). In this article, we review the management of mCRC, including the role of imaging in each treatment strategy, with emphasis on contemporary chemotherapeutic regimens and new molecular targeted therapies (MTTs).
Distribution of Distant Metastases in CRC
CRC most commonly metastasizes to the liver, with more than one-half of patients developing hepatic metastases either synchronously or metachronously. The lung is the second most common organ to harbor CRC metastases, followed by the peritoneal cavity (8). Peritoneal involvement is seen as peritoneal carcinomatosis and, in some cases, as pseudomyxoma peritonei, especially with the primary tumor arising from the appendix (9). Brain and bone metastases are uncommon (8,10).
Imaging of Metastases in CRC
Ultrasonography
Ultrasonography (US) is an inexpensive and readily available modality that in past years was widely used in the evaluation of liver metastases but has largely been supplanted by multidetector computed tomography (CT) and magnetic resonance (MR) imaging. Typical hepatic CRC metastases manifest as well-defined, solid, hypoechoic lesions—sometimes with a peripheral halo or a characteristic “target” or “bull’s-eye” appearance—and are usually hypovascular at Doppler US (Fig 1) (11). Although contrast-enhanced US has not received FDA approval for use in the United States, it does allow the assessment of dynamic enhancement characteristics of liver lesions with an accuracy comparable to that of multidetector CT in some studies (12). In a study of 271 consecutive patients with CRC, 21 of whom had liver metastases, contrast-enhanced US and multidetector CT both had a sensitivity of 87.5%, with a specificity of 97.6% and 95.6%, respectively (12). Intraoperative US has emerged as a valuable additional US technique and has been shown to have a higher sensitivity and specificity than preoperative transabdominal US, especially when combined with contrast-enhanced intraoperative US (13). Intraoperative US has been shown to help detect new metastases in 33%–42% of cases, with the addition of contrast-enhanced intraoperative US helping detect “disappearing” liver metastases after chemotherapy (14). Some of the limitations of US include operator dependence; ambiguity in segmental localization, which is crucial for surgical planning; and poor performance in the presence of hepatic steatosis and diffuse and chronic hepatic disease.
Figure 1a.
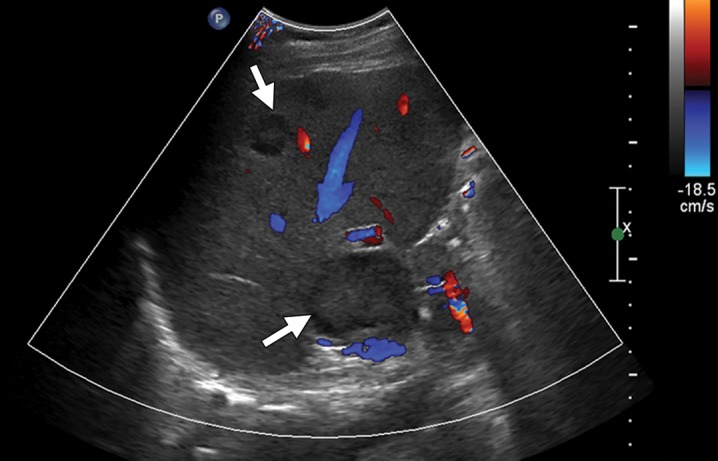
Liver metastases from colonic adenocarcinoma in a 65-year-old man who had undergone colectomy and presented for routine follow-up examination. (a) Transverse Doppler US image demonstrates solid hypoechoic liver lesions with a peripheral hypoechoic halo and no significant internal vascularity (arrows). (b) Contrast material–enhanced CT image shows multiple hypoattenuating liver lesions (arrows) consistent with liver metastases.
Figure 1b.
Liver metastases from colonic adenocarcinoma in a 65-year-old man who had undergone colectomy and presented for routine follow-up examination. (a) Transverse Doppler US image demonstrates solid hypoechoic liver lesions with a peripheral hypoechoic halo and no significant internal vascularity (arrows). (b) Contrast material–enhanced CT image shows multiple hypoattenuating liver lesions (arrows) consistent with liver metastases.
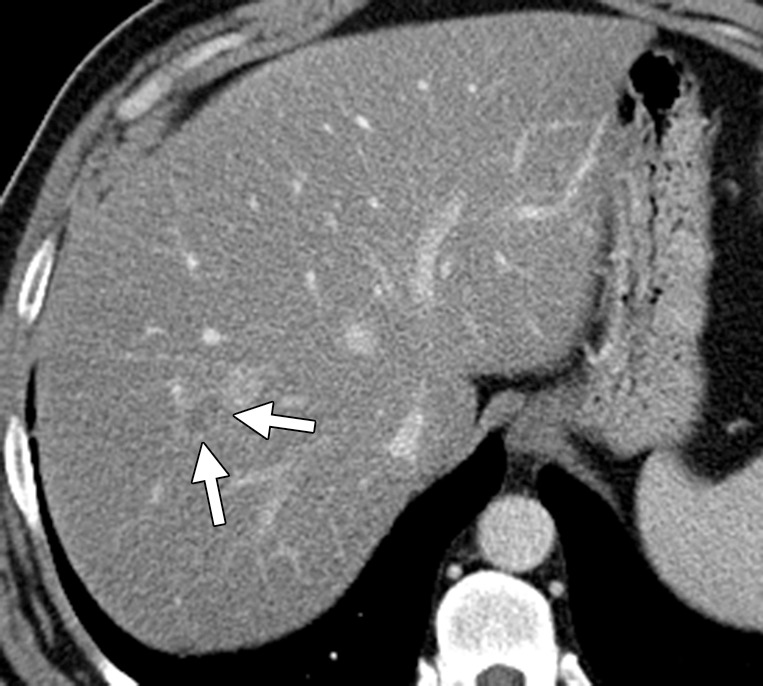
Multidetector CT
Multidetector CT is the most commonly used imaging modality in the workup of patients with mCRC. Multidetector CT offers the advantage of volumetric acquisition with isotropic voxels, which helps in generating high-quality reformatted images in multiple planes for improved detection of small lesions and accurate segmental localization of lesions. Hepatic metastases are hypovascular in the arterial phase, with a peripheral rim of hypervascularity in some cases, and are heterogeneously hypoattenuating in the portal venous phase (Fig 2) (15). The most reliable phase for the detection of hepatic metastases is the portal venous phase (approximately 60–70 seconds following initiation of intravenous contrast material administration), with a detection rate of 85% and a positive predictive value of 96% (16). In the arterial phase, CRC metastases can have peripheral rimlike enhancement. Calcification is noted in 11% of CRC liver metastases (17). Lung metastases are seen as pulmonary nodules, lymphangitis carcinomatosa, and pleural effusions (8). Peritoneal carcinomatosis manifests as soft-tissue deposits in the omentum and mesentery, with peritoneal thickening and ascites (sometimes loculated). Pseudomyxoma peritonei (low-attenuation mucinous peritoneal implants that scallop visceral surfaces) can be seen in some cases of appendiceal cancer (9). Bone metastases are typically lytic or mixed lytic-sclerotic lesions (8). Brain metastases from CRC are indistinguishable from metastases from other sites.
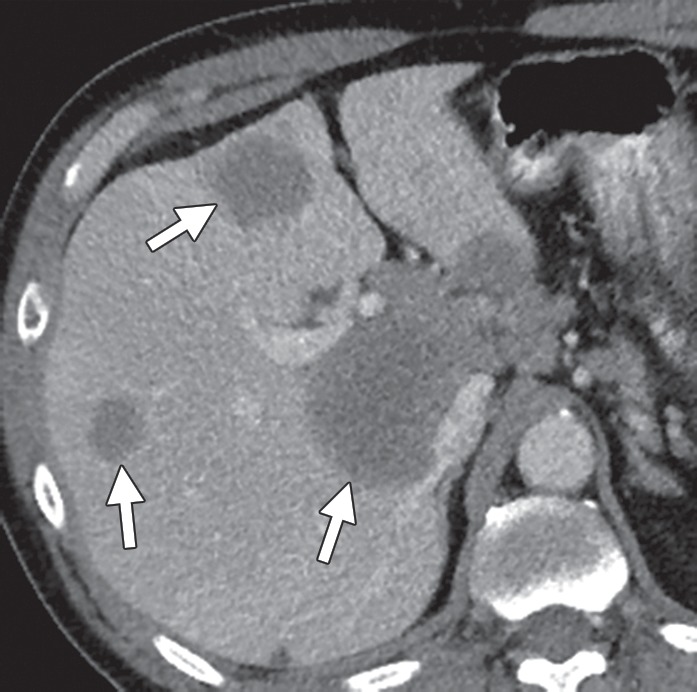
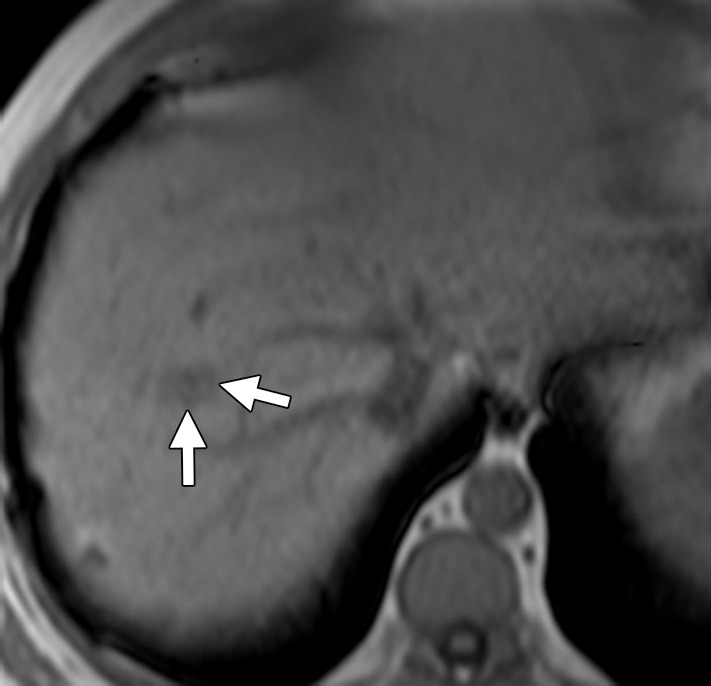
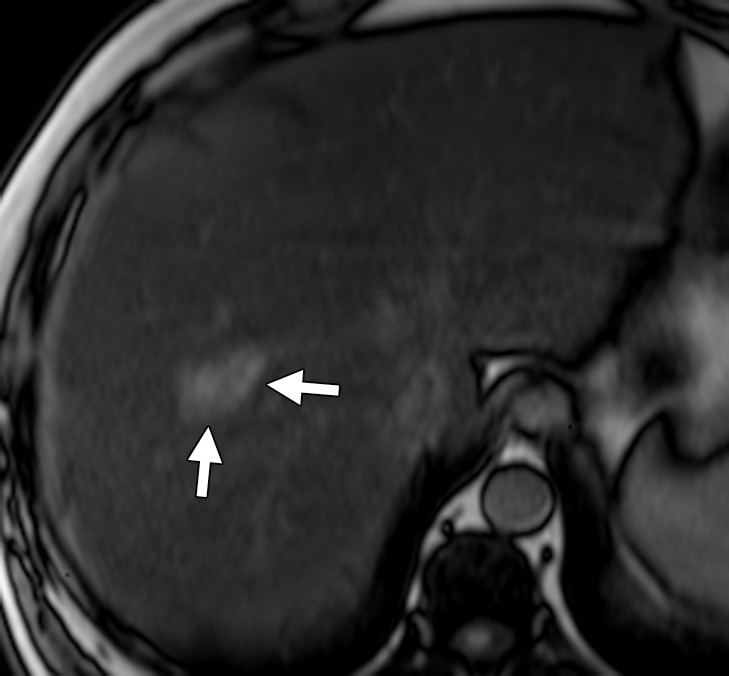
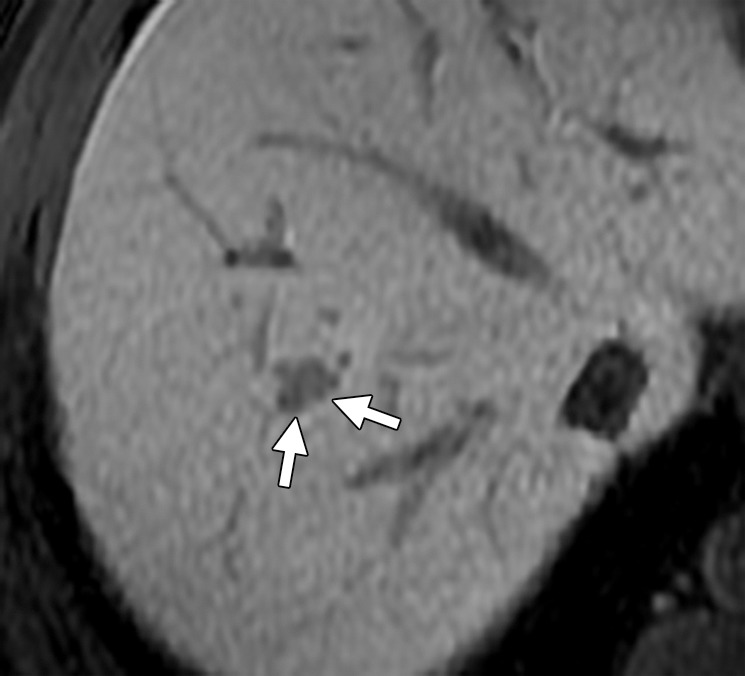
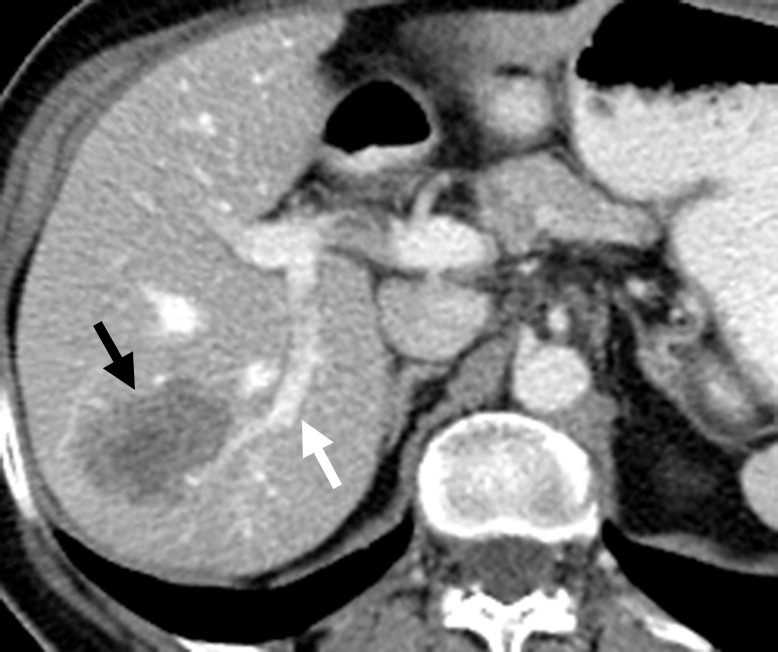
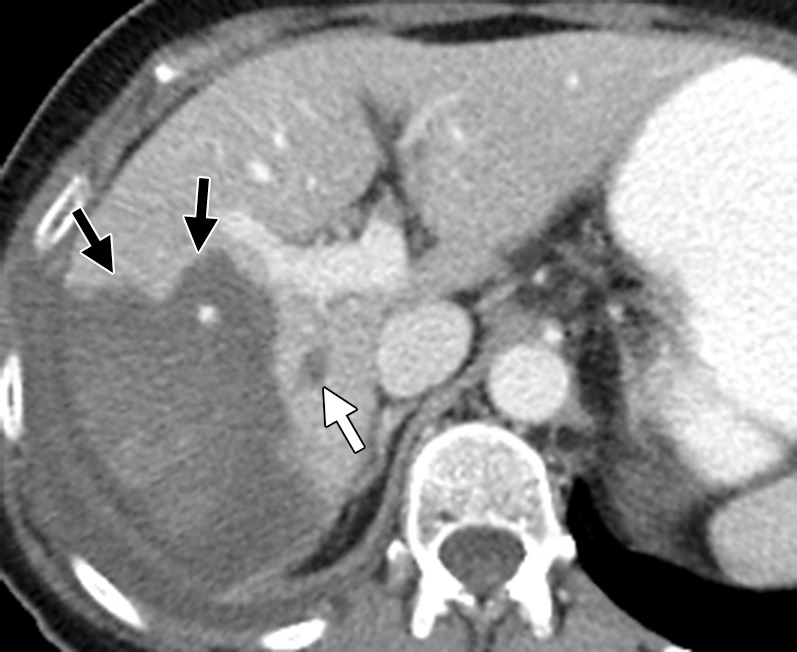
Figure 2a.
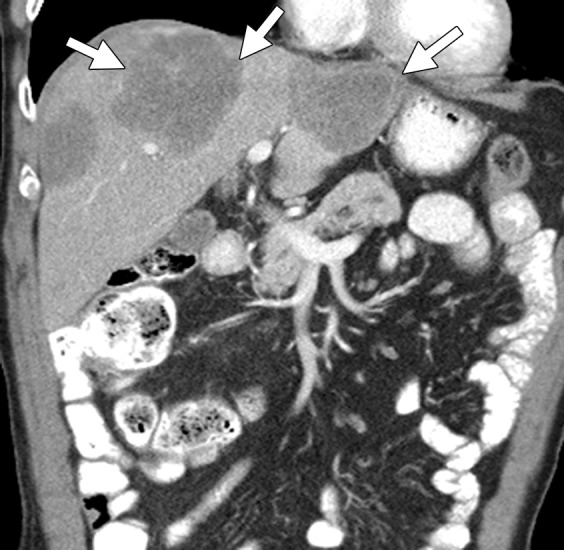
Liver metastases in a 69-year-old man with newly diagnosed stage IVB KRAS-mutant colonic adenocarcinoma. (a) Coronal contrast-enhanced CT image demonstrates hypoattenuating liver lesions (arrows) in both hepatic lobes. The patient was treated with FOLFOX and bevacizumab. (b) On a coronal follow-up CT image obtained after six cycles of chemotherapy, the lesions (arrows) show an interval decrease in size and enhancement, with a sharp tumor-liver interface. There is new, partially occluding thrombosis of the superior mesenteric vein (arrowhead), possibly caused by bevacizumab.
Figure 2b.
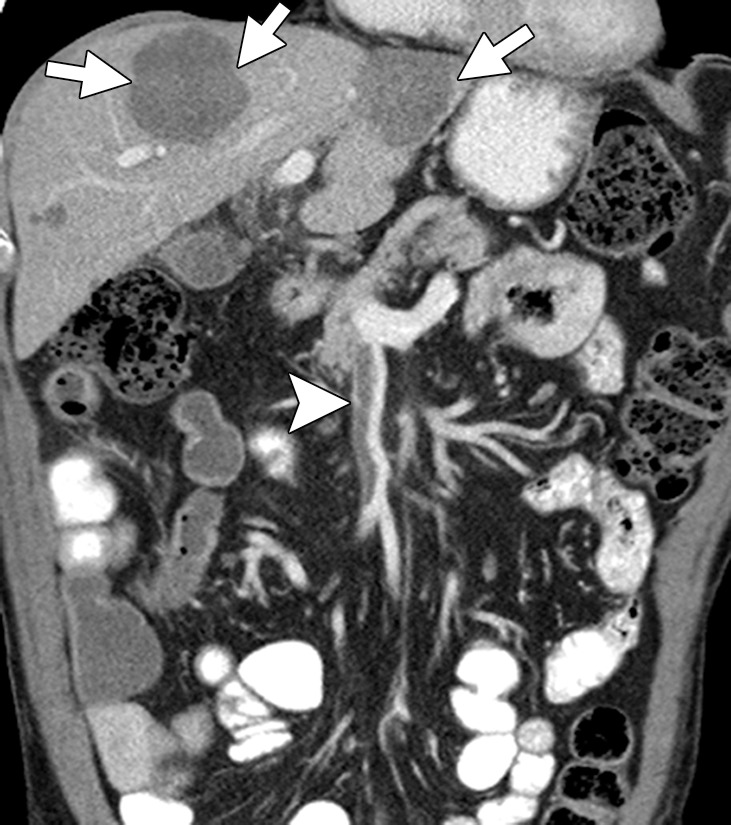
Liver metastases in a 69-year-old man with newly diagnosed stage IVB KRAS-mutant colonic adenocarcinoma. (a) Coronal contrast-enhanced CT image demonstrates hypoattenuating liver lesions (arrows) in both hepatic lobes. The patient was treated with FOLFOX and bevacizumab. (b) On a coronal follow-up CT image obtained after six cycles of chemotherapy, the lesions (arrows) show an interval decrease in size and enhancement, with a sharp tumor-liver interface. There is new, partially occluding thrombosis of the superior mesenteric vein (arrowhead), possibly caused by bevacizumab.
Detection of liver metastases at multidetector CT can be difficult in the presence of fatty liver, which is most often the result of concurrent chemotherapy (Fig 3) (18). Differentiation of small hemangiomas and cysts less than 1 cm in size from metastases can also be difficult at times due to volume averaging. The sensitivity of CT for detecting lesions less than 1 cm falls from 65%–95% to 31%–38% (19). Multidetector CT has a specificity of 67% in characterizing lesions as benign or malignant, compared with 81% for MR imaging (19).
Figure 3a.
Liver metastasis in a 47-year-old man with a history of resected stage II colonic adenocarcinoma. The patient had undergone hemicolectomy 2 years earlier and presented with an elevated carcinoembryonic antigen level. (a) Contrast-enhanced CT image shows an ill-defined lesion (arrows) in segment VIII of the liver. The lesion was difficult to characterize due to the underlying hepatic steatosis. (b, c) On axial in-phase (b) and out-of-phase (c) MR images, the lesion (arrows) is more clearly depicted on the out-of-phase image due to marked signal drop in the surrounding liver parenchyma owing to diffuse steatosis. (d) Axial gadolinium-enhanced fat-suppressed hepatocyte phase T1-weighted MR image obtained with gadoxetate disodium (Eovist; Bayer Schering Pharma, Berlin, Germany) after a 20-minute delay shows no uptake in the lesion (arrows), a finding that is consistent with metastasis. No other liver lesions were detected. The patient underwent neoadjuvant chemotherapy followed by right hepatectomy.
Figure 3b.
Liver metastasis in a 47-year-old man with a history of resected stage II colonic adenocarcinoma. The patient had undergone hemicolectomy 2 years earlier and presented with an elevated carcinoembryonic antigen level. (a) Contrast-enhanced CT image shows an ill-defined lesion (arrows) in segment VIII of the liver. The lesion was difficult to characterize due to the underlying hepatic steatosis. (b, c) On axial in-phase (b) and out-of-phase (c) MR images, the lesion (arrows) is more clearly depicted on the out-of-phase image due to marked signal drop in the surrounding liver parenchyma owing to diffuse steatosis. (d) Axial gadolinium-enhanced fat-suppressed hepatocyte phase T1-weighted MR image obtained with gadoxetate disodium (Eovist; Bayer Schering Pharma, Berlin, Germany) after a 20-minute delay shows no uptake in the lesion (arrows), a finding that is consistent with metastasis. No other liver lesions were detected. The patient underwent neoadjuvant chemotherapy followed by right hepatectomy.
Figure 3c.
Liver metastasis in a 47-year-old man with a history of resected stage II colonic adenocarcinoma. The patient had undergone hemicolectomy 2 years earlier and presented with an elevated carcinoembryonic antigen level. (a) Contrast-enhanced CT image shows an ill-defined lesion (arrows) in segment VIII of the liver. The lesion was difficult to characterize due to the underlying hepatic steatosis. (b, c) On axial in-phase (b) and out-of-phase (c) MR images, the lesion (arrows) is more clearly depicted on the out-of-phase image due to marked signal drop in the surrounding liver parenchyma owing to diffuse steatosis. (d) Axial gadolinium-enhanced fat-suppressed hepatocyte phase T1-weighted MR image obtained with gadoxetate disodium (Eovist; Bayer Schering Pharma, Berlin, Germany) after a 20-minute delay shows no uptake in the lesion (arrows), a finding that is consistent with metastasis. No other liver lesions were detected. The patient underwent neoadjuvant chemotherapy followed by right hepatectomy.
Figure 3d.
Liver metastasis in a 47-year-old man with a history of resected stage II colonic adenocarcinoma. The patient had undergone hemicolectomy 2 years earlier and presented with an elevated carcinoembryonic antigen level. (a) Contrast-enhanced CT image shows an ill-defined lesion (arrows) in segment VIII of the liver. The lesion was difficult to characterize due to the underlying hepatic steatosis. (b, c) On axial in-phase (b) and out-of-phase (c) MR images, the lesion (arrows) is more clearly depicted on the out-of-phase image due to marked signal drop in the surrounding liver parenchyma owing to diffuse steatosis. (d) Axial gadolinium-enhanced fat-suppressed hepatocyte phase T1-weighted MR image obtained with gadoxetate disodium (Eovist; Bayer Schering Pharma, Berlin, Germany) after a 20-minute delay shows no uptake in the lesion (arrows), a finding that is consistent with metastasis. No other liver lesions were detected. The patient underwent neoadjuvant chemotherapy followed by right hepatectomy.
MR Imaging
The heightened soft-tissue resolution provided by MR imaging makes it an invaluable problem-solving tool in the assessment of liver lesions. With T1- and T2-weighted sequences, hepatic metastases are hypo- and hyperintense, respectively, relative to normal liver parenchyma. The use of heavily T2-weighted images may help differentiate solid malignant lesions from hemangiomas and cysts. In-phase and out-of-phase gradient-recalled echo imaging offers an advantage over CT in the presence of fatty liver (Fig 3). Intravenous administration of gadolinium-based contrast material helps in further characterizing known lesions and in detecting additional lesions. The appearance of metastatic lesions at MR imaging with extracellular gadolinium chelates is similar to their appearance at multidetector CT (ie, hypointense in the arterial and venous phases relative to normal liver parenchyma) (17). Hepatocyte-specific contrast agents are preferentially taken up by hepatocytes and excreted into the biliary tree. After their intravenous administration, these agents have a biphasic enhancement pattern, with the first phase occurring immediately after administration and the delayed phase occurring 10–120 minutes after administration (Fig 3) (17). Two hepatocyte-specific contrast agents that are commonly used in the United States are gadolinium-benzyloxypropionictetraacetate (Gd-BOPTA), or gadobenate dimeglumine (MultiHance; Bracco, Milan, Italy), and gadolinium-ethoxybenzyl-diethylenetriamine pentaacetic acid (Gd-EOB-DTPA), or gadoxetate disodium (Eovist, Bayer). The differences between these two agents are summarized in Table 1. With use of hepatocyte-specific contrast agents, hepatic metastases typically appear hypointense relative to the surrounding liver parenchyma on delayed images, whereas hepatocyte-containing lesions such as focal nodular hyperplasia appear iso- or hyperintense (6). Hepatocyte-specific contrast-enhanced MR imaging helps detect more metastatic lesions than does conventional MR imaging (sensitivity of 95% versus 87%) and may be particularly useful for the follow-up of metastases after systemic or liver-directed therapies (20). Diffusion-weighted (DW) imaging measures the mobility of water molecules in tissues and reflects the cellular density of tissues. Apparent diffusion coefficient (ADC) values are quantitative estimates of diffusion restriction. Metastatic lesions have restricted diffusion and manifest as high-signal-intensity lesions with low ADC values (Fig 4). DW imaging helps detect lesions less than 1 cm (20). Overall, the sensitivity of MR imaging for detecting CRC liver metastases is close to 95%, with an accuracy of 83% for detecting lesions less than 1 cm. In characterizing lesions less than 1 cm as benign or malignant, MR imaging surpasses CT, with an accuracy of 91% (19).
Table 1:
Characteristics of Hepatocyte-specific MR Contrast Agents

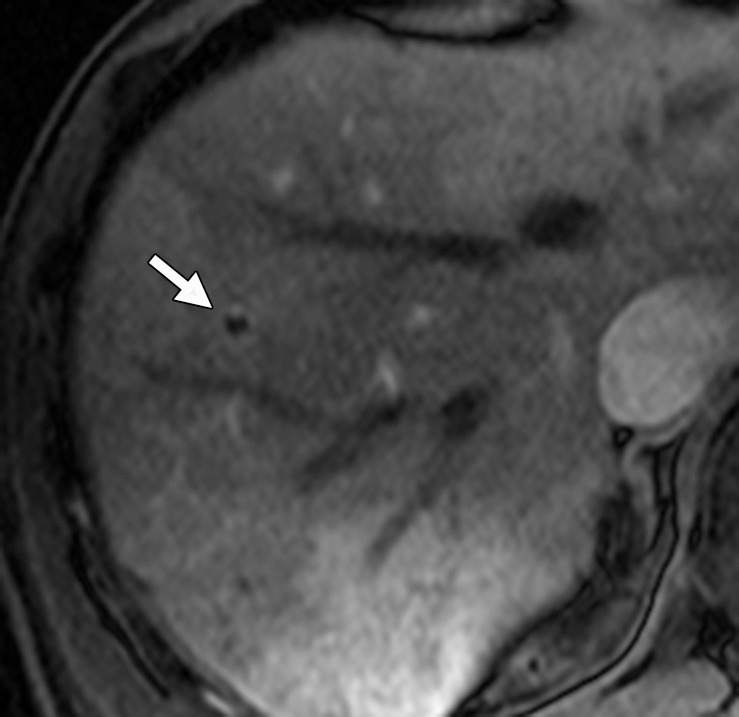
Figure 4a.
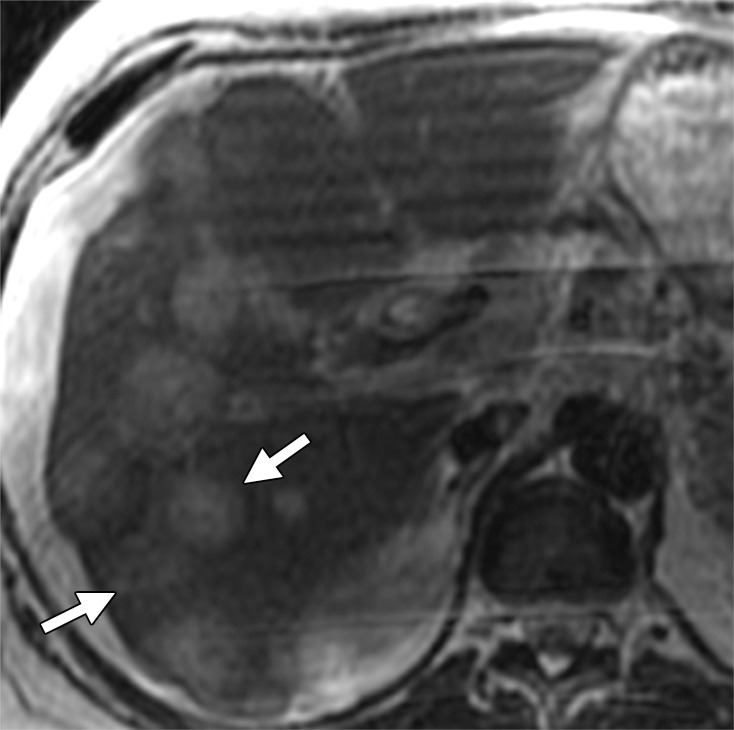
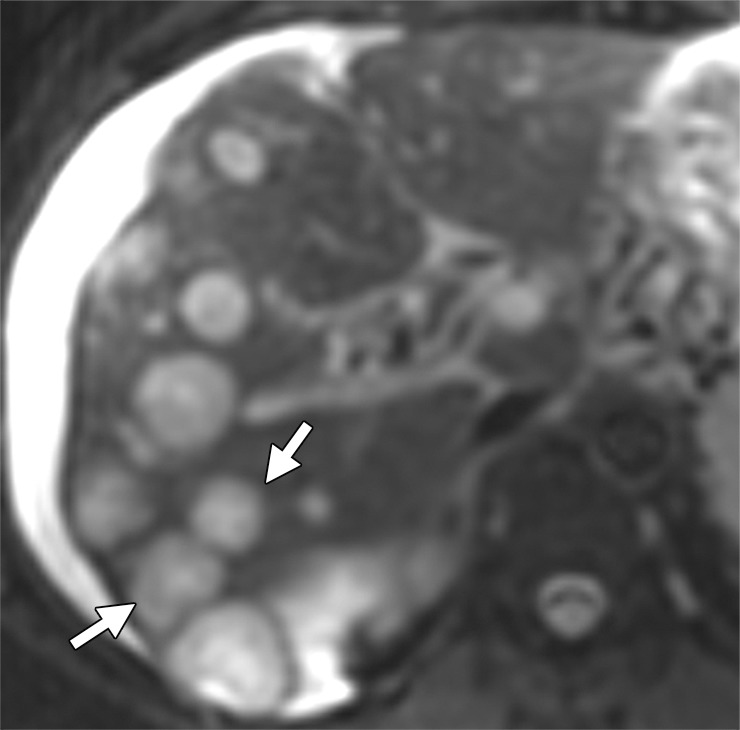
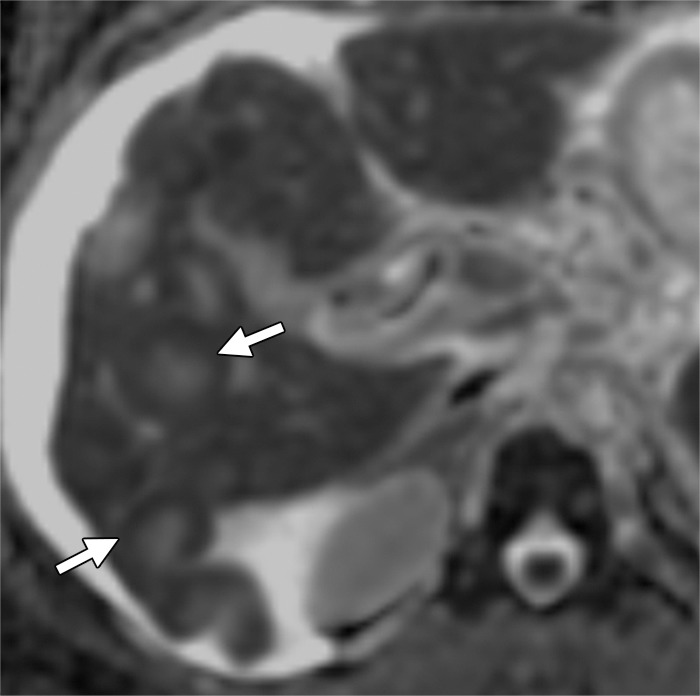
Liver metastases in a 58-year-old man with right colon cancer who had undergone right colectomy 5 years earlier. (a) Axial T2-weighted MR image demonstrates multiple hyperintense hepatic lesions (arrows). Note the perihepatic free fluid, consistent with ascites. (b, c) Axial DW (b = 800 sec/mm2) (b) and ADC (c) images demonstrate diffusion restriction in the periphery of the metastatic deposits as bright signal on the DW image and dark signal on the ADC image (arrows), findings that are consistent with viable tumor. The central portion of the lesion does not show diffusion restriction (ie, relatively higher signal compared with the periphery on the DW image and retention of high signal [T2 shine-through] on the ADC image), findings that are suggestive of necrosis.
Figure 4b.
Liver metastases in a 58-year-old man with right colon cancer who had undergone right colectomy 5 years earlier. (a) Axial T2-weighted MR image demonstrates multiple hyperintense hepatic lesions (arrows). Note the perihepatic free fluid, consistent with ascites. (b, c) Axial DW (b = 800 sec/mm2) (b) and ADC (c) images demonstrate diffusion restriction in the periphery of the metastatic deposits as bright signal on the DW image and dark signal on the ADC image (arrows), findings that are consistent with viable tumor. The central portion of the lesion does not show diffusion restriction (ie, relatively higher signal compared with the periphery on the DW image and retention of high signal [T2 shine-through] on the ADC image), findings that are suggestive of necrosis.
Figure 4c.
Liver metastases in a 58-year-old man with right colon cancer who had undergone right colectomy 5 years earlier. (a) Axial T2-weighted MR image demonstrates multiple hyperintense hepatic lesions (arrows). Note the perihepatic free fluid, consistent with ascites. (b, c) Axial DW (b = 800 sec/mm2) (b) and ADC (c) images demonstrate diffusion restriction in the periphery of the metastatic deposits as bright signal on the DW image and dark signal on the ADC image (arrows), findings that are consistent with viable tumor. The central portion of the lesion does not show diffusion restriction (ie, relatively higher signal compared with the periphery on the DW image and retention of high signal [T2 shine-through] on the ADC image), findings that are suggestive of necrosis.
PET/CT
The role of 2-[fluorine-18]fluoro-2-deoxy-d-glucose (FDG) positron emission tomography (PET)/CT in stage IV CRC is evolving, mainly due to the capacity of PET/CT to help detect additional sites of extrahepatic disease and thereby alter surgical management. PET/CT is highly sensitive for detecting liver metastases larger than 10 mm (78%–95%) (21). Its sensitivity drops to 36% for lesions less than 1 cm (19). False-negative results can occur with lesions with necrosis or mucinous contents (Fig 5) (22). In patients with potentially resectable liver disease, National Comprehensive Cancer Network (NCCN) guidelines recommend PET/CT for excluding occult metastatic disease (2). In metachronous hepatic or extrahepatic disease, PET/CT should be considered for the assessment of disease extent. PET/CT may also be used for detecting occult disease in patients with elevated carcinoembryonic antigen levels and negative anatomic workup (2).
Figure 5a.
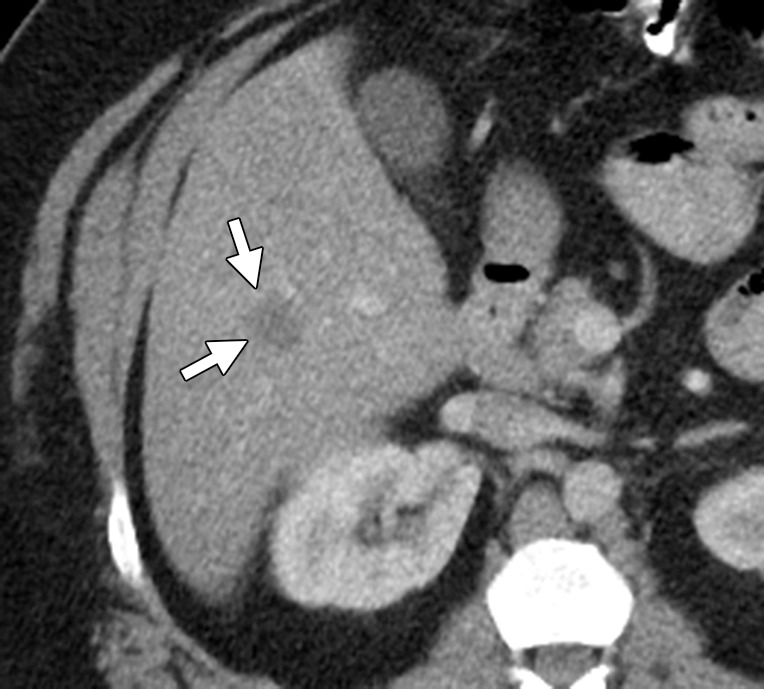
Hepatic metastasis with mucinous contents in a 49-year-old man with ascending colon cancer who had undergone right colectomy 3 months earlier. (a) Contrast-enhanced CT image shows a hypoattenuating lesion in the right hepatic lobe (arrows), a finding that is suspicious for metastasis. (b) Coronal maximum-intensity-projection image from an FDG PET/CT study demonstrates no increased uptake in the right hepatic lobe. (c) Axial gadolinium-enhanced fat-suppressed T1-weighted MR image depicts the lesion with a peripheral rim of enhancement (arrows). Results of biopsy confirmed hepatic metastasis with mucinous contents, which might explain the false-negative result at PET/CT.
Figure 5b.
Hepatic metastasis with mucinous contents in a 49-year-old man with ascending colon cancer who had undergone right colectomy 3 months earlier. (a) Contrast-enhanced CT image shows a hypoattenuating lesion in the right hepatic lobe (arrows), a finding that is suspicious for metastasis. (b) Coronal maximum-intensity-projection image from an FDG PET/CT study demonstrates no increased uptake in the right hepatic lobe. (c) Axial gadolinium-enhanced fat-suppressed T1-weighted MR image depicts the lesion with a peripheral rim of enhancement (arrows). Results of biopsy confirmed hepatic metastasis with mucinous contents, which might explain the false-negative result at PET/CT.
Figure 5c.
Hepatic metastasis with mucinous contents in a 49-year-old man with ascending colon cancer who had undergone right colectomy 3 months earlier. (a) Contrast-enhanced CT image shows a hypoattenuating lesion in the right hepatic lobe (arrows), a finding that is suspicious for metastasis. (b) Coronal maximum-intensity-projection image from an FDG PET/CT study demonstrates no increased uptake in the right hepatic lobe. (c) Axial gadolinium-enhanced fat-suppressed T1-weighted MR image depicts the lesion with a peripheral rim of enhancement (arrows). Results of biopsy confirmed hepatic metastasis with mucinous contents, which might explain the false-negative result at PET/CT.
Management of mCRC
Two different scenarios are encountered in the management of mCRC: (a) resectable or potentially resectable disease, and (b) unresectable disease.
Surgery in mCRC
Surgical resection is the only definitive treatment for mCRC and increases the 5-year survival rate to 25%–50% (23,24). However, only 10%–20% of liver metastases are resectable at presentation (2). The current definition of surgical resectability is evolving, with the minimum requirement being the ability to achieve complete resection with negative margins (R0 resection) and leave an adequate amount of liver for normal hepatic function (25). Patients with resectable or potentially resectable liver disease may benefit from perioperative chemotherapy that includes neoadjuvant and postoperative adjuvant chemotherapy (2). Neoadjuvant chemotherapy offers the advantages of eradicating micrometastatic disease preoperatively, assessing chemotherapy responsiveness, and allowing time to evaluate whether more metastatic lesions will develop outside the liver. The potential drawbacks of neoadjuvant chemotherapy include risk of progression with loss of surgical window; radiologic complete response (although viable cancer can still be detected at histopathologic analysis), which can make surgical resection difficult; and risk of steatohepatitis and sinusoidal injury, which increases postoperative mortality and morbidity (2,26). Close collaboration between the radiologist and the medical and surgical oncologists is crucial for proper timing of surgery.
In selected patients, unresectable metastatic disease can be rendered resectable by administering “conversion chemotherapy” (in contrast to neoadjuvant chemotherapy) (25). The goal of conversion chemotherapy is to downsize the tumor to create an opportunity for surgical resection. As with neoadjuvant chemotherapy, the duration of conversion chemotherapy should be kept as short as possible, and surgery should be performed as soon as possible due to the risk of steatohepatitis and sinusoidal injury associated with chemotherapy.
Synchronous liver metastases from CRC can be managed with resection of the primary tumor and liver metastases either simultaneously or in stages (2). In some circumstances, patients with isolated lung metastases and no other sites of disease can be considered for surgical resection. Unresectable CRC metastases to lung are managed much like liver metastases. Peritoneal carcinomatosis is managed with palliative intent, with systemic chemotherapy for advanced mCRC (27).
Role of Imaging in Surgical Planning for mCRC
The major determinants of resectability in mCRC are the number, size, and distribution of the liver metastases, which in turn determine the prospect of achieving negative surgical margins and adequate hepatic reserve. Thus, the primary goal of imaging in mCRC is to detect as many liver metastases as accurately as possible (6). Imaging also provides critical details about variations in the venous, arterial, and biliary anatomy. Reconstructed images act as road maps for surgical and radiologic interventions.
All lesions identified at pretreatment scanning must be mapped at preoperative imaging. Disappearing liver metastases are treated metastases that are not visualized at follow-up imaging due to their small size (radiologic complete response) (Fig 6) (18,25). Pathologic analysis of resected surgical specimens has shown such lesions to have viable tumor cells, especially at the tumor-liver interface. Accurate preoperative mapping of these lesions is necessary, since they can be the site of recurrence if the margins are positive for microscopic disease. Studies have shown that MR imaging with hepatocyte-specific contrast agents is more sensitive than multidetector CT in the detection of these completely treated liver metastases. A recent meta-analysis of 11 studies that included 223 patients and 906 liver lesions found that MR imaging is the most appropriate investigation in the preoperative setting after neoadjuvant chemotherapy (28).
Figure 6a.
Disappearing liver metastases in a 61-year-old man with mCRC to the liver who was treated with irinotecan and cetuximab. (a) Contrast-enhanced baseline CT image shows multiple hepatic lesions (arrows). (b) Contrast-enhanced CT image obtained 4 months after the start of chemotherapy demonstrates complete disappearance of two of the lesions seen in a and an interval decrease in the size of the third lesion (arrow). (c) Axial gadolinium-enhanced fat-suppressed T1-weighted MR image obtained 1 month later shows faint enhancement at the sites of the known lesions (arrows). Histopathologic analysis of the right hepatectomy specimen revealed fibrosis with foreign-body giant cell reaction and no microscopic residual tumor.
Figure 6b.
Disappearing liver metastases in a 61-year-old man with mCRC to the liver who was treated with irinotecan and cetuximab. (a) Contrast-enhanced baseline CT image shows multiple hepatic lesions (arrows). (b) Contrast-enhanced CT image obtained 4 months after the start of chemotherapy demonstrates complete disappearance of two of the lesions seen in a and an interval decrease in the size of the third lesion (arrow). (c) Axial gadolinium-enhanced fat-suppressed T1-weighted MR image obtained 1 month later shows faint enhancement at the sites of the known lesions (arrows). Histopathologic analysis of the right hepatectomy specimen revealed fibrosis with foreign-body giant cell reaction and no microscopic residual tumor.
Figure 6c.
Disappearing liver metastases in a 61-year-old man with mCRC to the liver who was treated with irinotecan and cetuximab. (a) Contrast-enhanced baseline CT image shows multiple hepatic lesions (arrows). (b) Contrast-enhanced CT image obtained 4 months after the start of chemotherapy demonstrates complete disappearance of two of the lesions seen in a and an interval decrease in the size of the third lesion (arrow). (c) Axial gadolinium-enhanced fat-suppressed T1-weighted MR image obtained 1 month later shows faint enhancement at the sites of the known lesions (arrows). Histopathologic analysis of the right hepatectomy specimen revealed fibrosis with foreign-body giant cell reaction and no microscopic residual tumor.
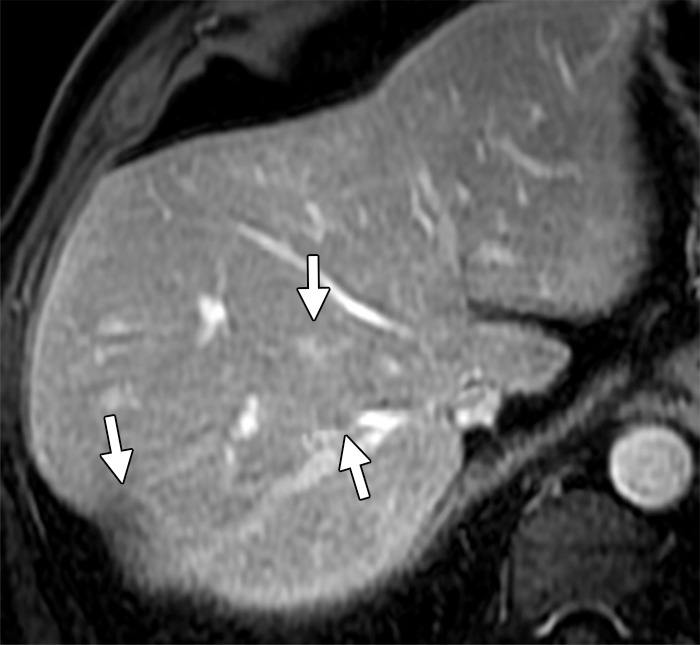
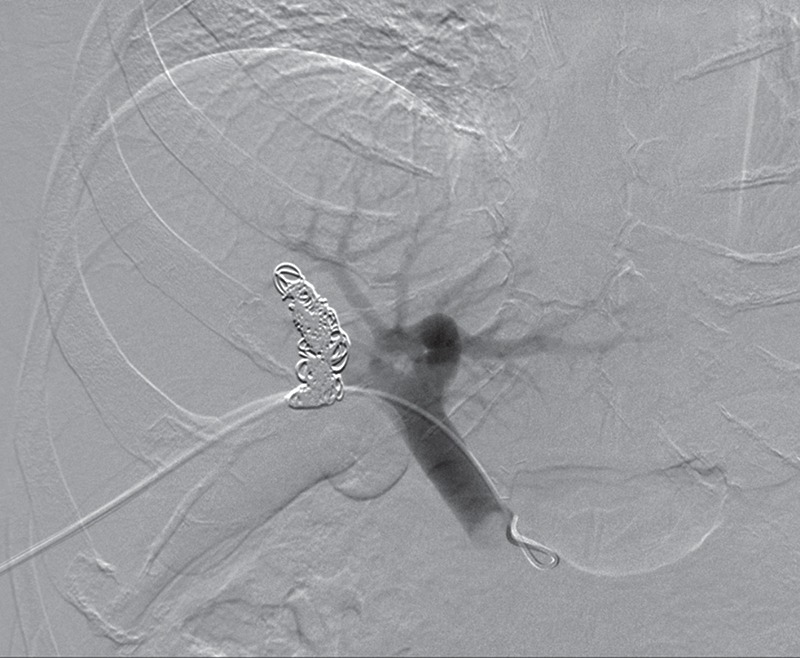
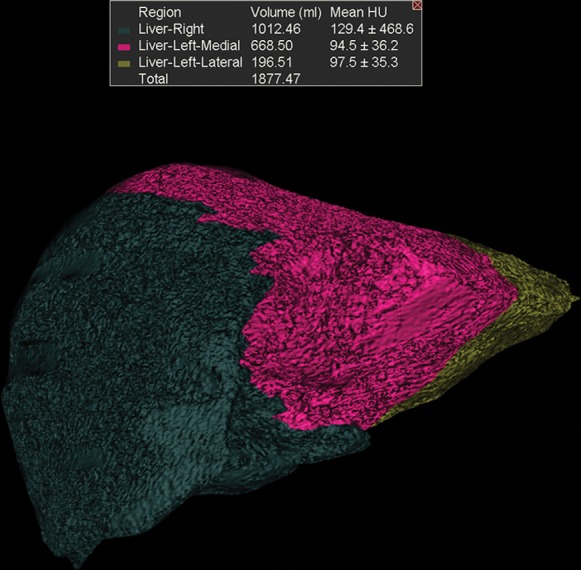
Imaging helps in the preoperative detection of conditions that can portend poor prognosis, including steatosis, biliary obstruction, parenchymal liver disease, and vascular complications such as portal vein thrombosis. CT- and MR imaging–based volumetry are helpful in estimating the volume of the future liver remnant (6). Several studies have shown that the use of correction factors in the preoperative assessment of liver volumes can help avoid over- or underestimation of volumes (29). Preoperative portal vein embolization, a technique that induces atrophy of the embolized liver lobe and compensatory hypertrophy of the contralateral lobe, can help in achieving a desirable future liver remnant in patients with suboptimal liver volume as predicted with cross-sectional imaging–based volumetrics (Fig 7). Portal vein embolization results in about 15% liver regeneration in 3–9 weeks (30).
Figure 7a.
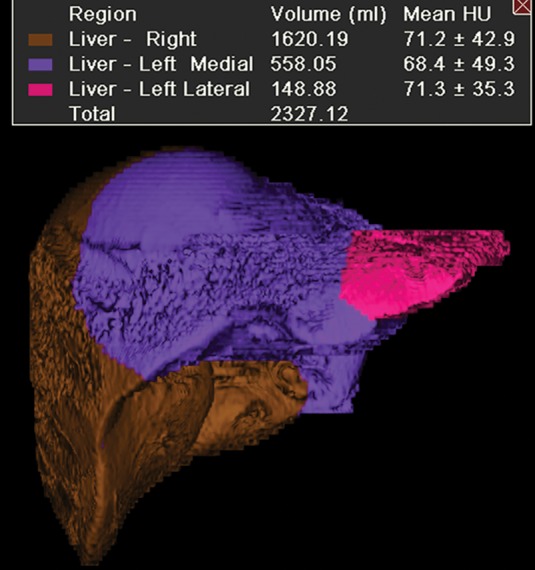
Augmentation of the future liver remnant in a 43-year-old man with mCRC to the liver who was undergoing portal vein embolization prior to right hepatectomy. (a) Three-dimensional volume-rendered CT image shows the right hepatic lobe (brown) and the medial (purple) and lateral (pink) segments of the left hepatic lobe. The preembolization volume of the left lobe was 707 cm3. (b) Digital subtraction angiographic image obtained with portal vein injection following embolization of the right portal vein demonstrates opacification of the left portal vein and stasis of contrast material in the right portal vein. (c) Three-dimensional volume-rendered CT image obtained 2 months after embolization reveals enlargement of the left hepatic lobe (volume = 865 cm3). Green = right hepatic lobe, red = medial segment of left hepatic lobe, yellow = lateral segment of left hepatic lobe.
Figure 7b.
Augmentation of the future liver remnant in a 43-year-old man with mCRC to the liver who was undergoing portal vein embolization prior to right hepatectomy. (a) Three-dimensional volume-rendered CT image shows the right hepatic lobe (brown) and the medial (purple) and lateral (pink) segments of the left hepatic lobe. The preembolization volume of the left lobe was 707 cm3. (b) Digital subtraction angiographic image obtained with portal vein injection following embolization of the right portal vein demonstrates opacification of the left portal vein and stasis of contrast material in the right portal vein. (c) Three-dimensional volume-rendered CT image obtained 2 months after embolization reveals enlargement of the left hepatic lobe (volume = 865 cm3). Green = right hepatic lobe, red = medial segment of left hepatic lobe, yellow = lateral segment of left hepatic lobe.
Figure 7c.
Augmentation of the future liver remnant in a 43-year-old man with mCRC to the liver who was undergoing portal vein embolization prior to right hepatectomy. (a) Three-dimensional volume-rendered CT image shows the right hepatic lobe (brown) and the medial (purple) and lateral (pink) segments of the left hepatic lobe. The preembolization volume of the left lobe was 707 cm3. (b) Digital subtraction angiographic image obtained with portal vein injection following embolization of the right portal vein demonstrates opacification of the left portal vein and stasis of contrast material in the right portal vein. (c) Three-dimensional volume-rendered CT image obtained 2 months after embolization reveals enlargement of the left hepatic lobe (volume = 865 cm3). Green = right hepatic lobe, red = medial segment of left hepatic lobe, yellow = lateral segment of left hepatic lobe.
Liver-directed Therapies in mCRC
The utilization of liver-directed therapies in the management of mCRC is a controversial and evolving field. Oncologists sometimes use liver-directed therapies when the liver is the only site of metastatic disease (2,3). Hepatic arterial infusion consists of surgical placement of a hepatic arterial port for infusion of chemotherapeutic drugs, taking advantage of the increased arterial supply to metastases and resulting in selective high-dose delivery. Proponents of hepatic arterial infusion believe that it helps with local tumor control (31). Another liver-directed therapy is transarterial radioembolization with yttrium-90 (90Y) microspheres, which can be used in selected patients without obvious extrahepatic disease who are refractory to first- and second-line treatments (Fig 8) (2,3). Percutaneous ablation of liver metastases can be considered in patients who are unfit for surgery due to comorbidities or an insufficient future liver remnant, or in conjunction with surgery to achieve tumor-free status (2,3). Options available for percutaneous ablation include radiofrequency ablation, cryoablation, and microwave ablation (Fig 9). Radiofrequency ablation is the most widely used local ablative procedure, with low morbidity and mortality. However, several retrospective studies have found radiofrequency ablation to be inferior to surgical resection in patients with resectable disease due to higher rates of local recurrence (32).
Figure 8a.

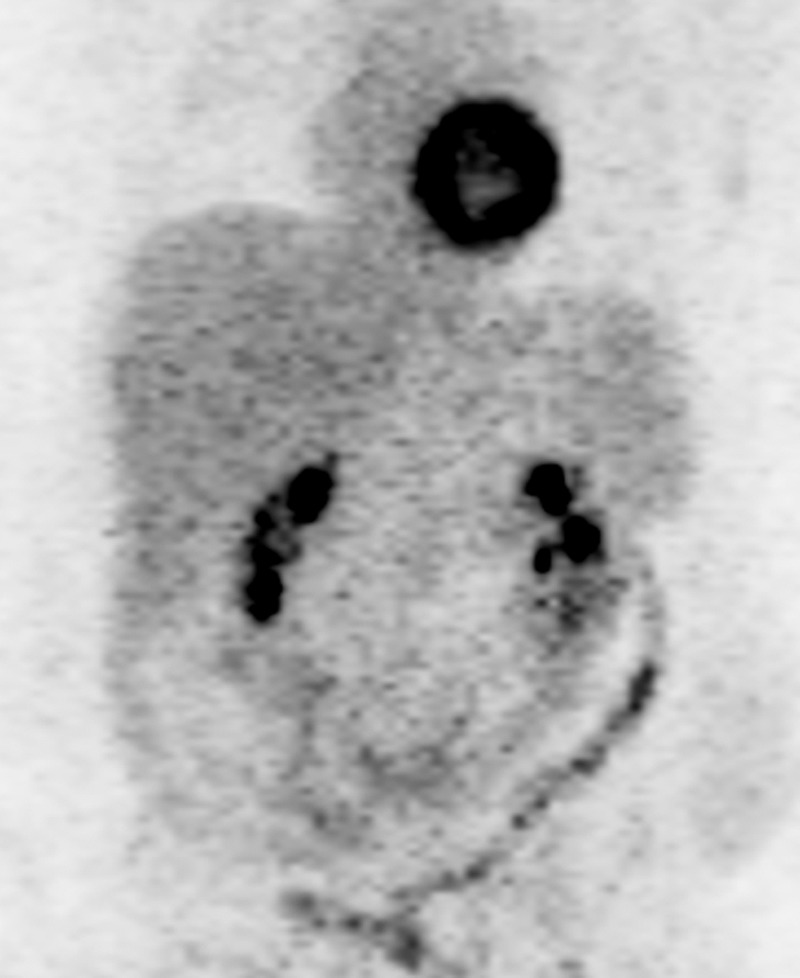
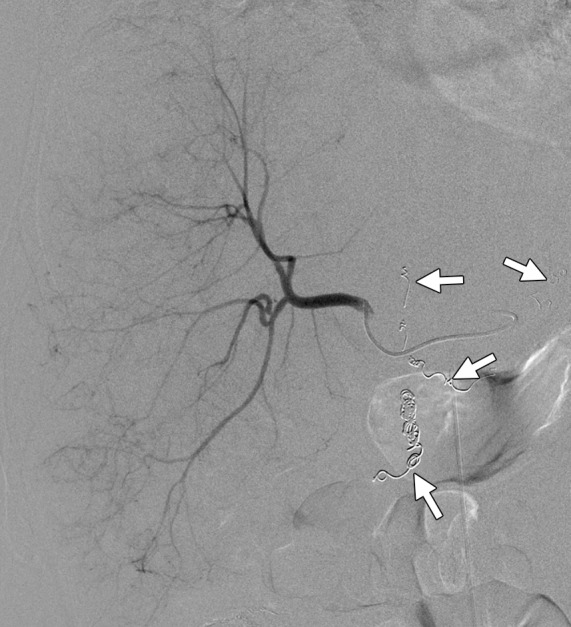
Results of radioembolization in a 65-year-old man with metastatic rectal cancer and liver metastases who had progressed through all other standard chemotherapy options for CRC. (a) Contrast-enhanced baseline CT image demonstrates multifocal heterogeneous hepatic metastases with an ill-defined tumor-liver interface (arrows). Embolization was performed to isolate blood flow from the right hepatic and replaced left hepatic arteries into the liver. (b) Digital subtraction image from a superselective angiographic study of the right hepatic artery shows embolization of branches of the right and left gastric and gastroduodenal arteries (arrows) with 90Y-coated microspheres. (c) Anterior planar scintigraphic image demonstrates selective increased radiotracer uptake in the right hepatic lobe (arrows). The left hepatic lobe is not visualized, and no foci of increased uptake are seen in the lungs. (d) On a follow-up CT image obtained 1 month after radioembolization, the metastases in the right lobe (arrows) show a decrease in attenuation and a slight increase in size.
Figure 9a.
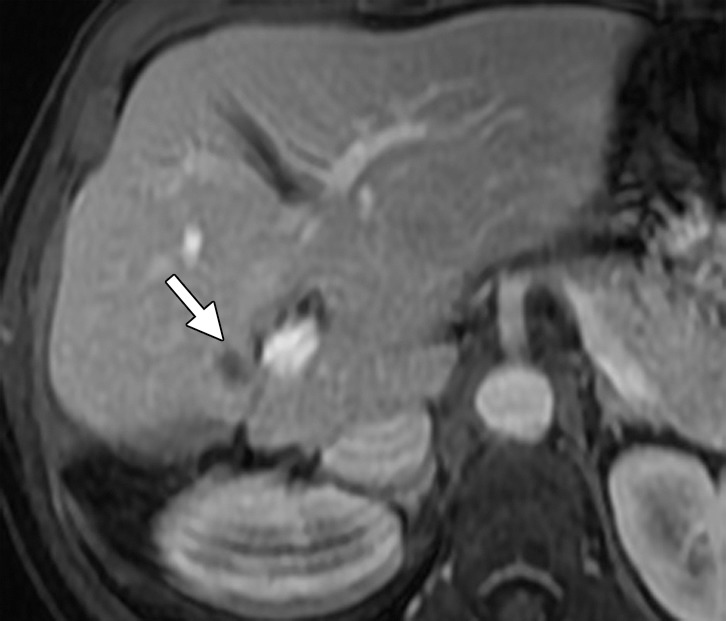
Results of cryoablation of residual metastasis in a 50-year-old woman with a liver metastasis from colon cancer. The patient had undergone right hepatectomy and nine cycles of treatment with FOLFOX and bevacizumab. (a) Axial gadolinium-enhanced fat-suppressed T1-weighted MR image obtained 1 week prior to ablation demonstrates a peripherally enhancing lesion (arrow) near the right margin of the liver. (b) Nonenhanced CT image demonstrates a Galil IceSphere cryoablation needle (Galil Medical, Arden Hills, Minn) in the lesion (arrows). (c) On an axial gadolinium-enhanced fat-suppressed T1-weighted MR image obtained 1 day after ablation, the lesion (arrow) is enlarged and has a thin peripheral rim of enhancement (arrowheads), findings that are consistent with the expected evolution of postablation changes. (d, e) On follow-up precontrast T1-weighted (d) and gadolinium-enhanced digital subtraction (e) MR images obtained 1 month later, the lesion demonstrates hyperintense signal (arrows in d) and no enhancement (arrows in e), findings that suggest coagulative necrosis and successful ablation, respectively.
Figure 8b.
Results of radioembolization in a 65-year-old man with metastatic rectal cancer and liver metastases who had progressed through all other standard chemotherapy options for CRC. (a) Contrast-enhanced baseline CT image demonstrates multifocal heterogeneous hepatic metastases with an ill-defined tumor-liver interface (arrows). Embolization was performed to isolate blood flow from the right hepatic and replaced left hepatic arteries into the liver. (b) Digital subtraction image from a superselective angiographic study of the right hepatic artery shows embolization of branches of the right and left gastric and gastroduodenal arteries (arrows) with 90Y-coated microspheres. (c) Anterior planar scintigraphic image demonstrates selective increased radiotracer uptake in the right hepatic lobe (arrows). The left hepatic lobe is not visualized, and no foci of increased uptake are seen in the lungs. (d) On a follow-up CT image obtained 1 month after radioembolization, the metastases in the right lobe (arrows) show a decrease in attenuation and a slight increase in size.
Figure 8c.

Results of radioembolization in a 65-year-old man with metastatic rectal cancer and liver metastases who had progressed through all other standard chemotherapy options for CRC. (a) Contrast-enhanced baseline CT image demonstrates multifocal heterogeneous hepatic metastases with an ill-defined tumor-liver interface (arrows). Embolization was performed to isolate blood flow from the right hepatic and replaced left hepatic arteries into the liver. (b) Digital subtraction image from a superselective angiographic study of the right hepatic artery shows embolization of branches of the right and left gastric and gastroduodenal arteries (arrows) with 90Y-coated microspheres. (c) Anterior planar scintigraphic image demonstrates selective increased radiotracer uptake in the right hepatic lobe (arrows). The left hepatic lobe is not visualized, and no foci of increased uptake are seen in the lungs. (d) On a follow-up CT image obtained 1 month after radioembolization, the metastases in the right lobe (arrows) show a decrease in attenuation and a slight increase in size.
Figure 8d.
Results of radioembolization in a 65-year-old man with metastatic rectal cancer and liver metastases who had progressed through all other standard chemotherapy options for CRC. (a) Contrast-enhanced baseline CT image demonstrates multifocal heterogeneous hepatic metastases with an ill-defined tumor-liver interface (arrows). Embolization was performed to isolate blood flow from the right hepatic and replaced left hepatic arteries into the liver. (b) Digital subtraction image from a superselective angiographic study of the right hepatic artery shows embolization of branches of the right and left gastric and gastroduodenal arteries (arrows) with 90Y-coated microspheres. (c) Anterior planar scintigraphic image demonstrates selective increased radiotracer uptake in the right hepatic lobe (arrows). The left hepatic lobe is not visualized, and no foci of increased uptake are seen in the lungs. (d) On a follow-up CT image obtained 1 month after radioembolization, the metastases in the right lobe (arrows) show a decrease in attenuation and a slight increase in size.
Figure 9b.
Results of cryoablation of residual metastasis in a 50-year-old woman with a liver metastasis from colon cancer. The patient had undergone right hepatectomy and nine cycles of treatment with FOLFOX and bevacizumab. (a) Axial gadolinium-enhanced fat-suppressed T1-weighted MR image obtained 1 week prior to ablation demonstrates a peripherally enhancing lesion (arrow) near the right margin of the liver. (b) Nonenhanced CT image demonstrates a Galil IceSphere cryoablation needle (Galil Medical, Arden Hills, Minn) in the lesion (arrows). (c) On an axial gadolinium-enhanced fat-suppressed T1-weighted MR image obtained 1 day after ablation, the lesion (arrow) is enlarged and has a thin peripheral rim of enhancement (arrowheads), findings that are consistent with the expected evolution of postablation changes. (d, e) On follow-up precontrast T1-weighted (d) and gadolinium-enhanced digital subtraction (e) MR images obtained 1 month later, the lesion demonstrates hyperintense signal (arrows in d) and no enhancement (arrows in e), findings that suggest coagulative necrosis and successful ablation, respectively.
Figure 9c.
Results of cryoablation of residual metastasis in a 50-year-old woman with a liver metastasis from colon cancer. The patient had undergone right hepatectomy and nine cycles of treatment with FOLFOX and bevacizumab. (a) Axial gadolinium-enhanced fat-suppressed T1-weighted MR image obtained 1 week prior to ablation demonstrates a peripherally enhancing lesion (arrow) near the right margin of the liver. (b) Nonenhanced CT image demonstrates a Galil IceSphere cryoablation needle (Galil Medical, Arden Hills, Minn) in the lesion (arrows). (c) On an axial gadolinium-enhanced fat-suppressed T1-weighted MR image obtained 1 day after ablation, the lesion (arrow) is enlarged and has a thin peripheral rim of enhancement (arrowheads), findings that are consistent with the expected evolution of postablation changes. (d, e) On follow-up precontrast T1-weighted (d) and gadolinium-enhanced digital subtraction (e) MR images obtained 1 month later, the lesion demonstrates hyperintense signal (arrows in d) and no enhancement (arrows in e), findings that suggest coagulative necrosis and successful ablation, respectively.
Figure 9d.
Results of cryoablation of residual metastasis in a 50-year-old woman with a liver metastasis from colon cancer. The patient had undergone right hepatectomy and nine cycles of treatment with FOLFOX and bevacizumab. (a) Axial gadolinium-enhanced fat-suppressed T1-weighted MR image obtained 1 week prior to ablation demonstrates a peripherally enhancing lesion (arrow) near the right margin of the liver. (b) Nonenhanced CT image demonstrates a Galil IceSphere cryoablation needle (Galil Medical, Arden Hills, Minn) in the lesion (arrows). (c) On an axial gadolinium-enhanced fat-suppressed T1-weighted MR image obtained 1 day after ablation, the lesion (arrow) is enlarged and has a thin peripheral rim of enhancement (arrowheads), findings that are consistent with the expected evolution of postablation changes. (d, e) On follow-up precontrast T1-weighted (d) and gadolinium-enhanced digital subtraction (e) MR images obtained 1 month later, the lesion demonstrates hyperintense signal (arrows in d) and no enhancement (arrows in e), findings that suggest coagulative necrosis and successful ablation, respectively.
Figure 9e.
Results of cryoablation of residual metastasis in a 50-year-old woman with a liver metastasis from colon cancer. The patient had undergone right hepatectomy and nine cycles of treatment with FOLFOX and bevacizumab. (a) Axial gadolinium-enhanced fat-suppressed T1-weighted MR image obtained 1 week prior to ablation demonstrates a peripherally enhancing lesion (arrow) near the right margin of the liver. (b) Nonenhanced CT image demonstrates a Galil IceSphere cryoablation needle (Galil Medical, Arden Hills, Minn) in the lesion (arrows). (c) On an axial gadolinium-enhanced fat-suppressed T1-weighted MR image obtained 1 day after ablation, the lesion (arrow) is enlarged and has a thin peripheral rim of enhancement (arrowheads), findings that are consistent with the expected evolution of postablation changes. (d, e) On follow-up precontrast T1-weighted (d) and gadolinium-enhanced digital subtraction (e) MR images obtained 1 month later, the lesion demonstrates hyperintense signal (arrows in d) and no enhancement (arrows in e), findings that suggest coagulative necrosis and successful ablation, respectively.
Role of Imaging in Liver-directed Therapies for mCRC
Most liver-directed therapies are performed under US and CT guidance. Imaging helps in selecting the type and approach of the radiologic intervention. In patients in whom ablation therapy is being contemplated, the relation of the target lesions to major vessels and the gallbladder plays a key role in treatment success by avoiding heat sink and biliary injury (33). The response to liver-directed therapies is different from the response to systemic chemotherapy. Percutaneous ablations usually result in enlargement of the treated lesion in the first month due to intratumoral hemorrhage and coagulative necrosis (Fig 9). Transient periablational hyperemia is seen as a thin peripheral rim of enhancement in the immediate postablation period and disappears by 1 month (Fig 9) (33). This entity must be differentiated from residual or recurrent tumor, which is seen as a thick, irregular nodular rim of enhancement. Intralesional air bubbles and arterioportal shunting are also commonly encountered at imaging (33). Response following radiation therapy and chemoembolization is seen as a decrease in tumor size, tumor necrosis, and complete devascularization (angiographic complete response) of the tumor, although a transient increase in tumor size can occur due to peritumoral edema and hemorrhage (Fig 8). A ring of enhancement similar to postablation hyperemia represents posttreatment fibrosis rather than recurrence. Perivascular edema in the distribution of the embolized vessels is a transient phenomenon and should not be confused with infiltrative disease. Radio- or chemoembolization results in ischemia and hepatitis of the normal liver parenchyma, which in turn can result in abnormal patchy parenchymal enhancement of the treated liver segment, causing difficulty in interpreting treatment response (34). Capsular retraction and hepatic fibrosis resulting in portal hypertension have been reported following radio- and chemoembolization.
Systemic Chemotherapy in mCRC
Chemotherapeutic Regimens
About 80%–90% of mCRCs are unresectable at presentation (2,3). The current treatment for most of these patients with unresectable and disseminated mCRC is palliative chemotherapy. The cytotoxic chemotherapeutic agents used in mCRC are 5-FU/LV, capecitabine, oxaliplatin, and irinotecan (Table 2). All of these drugs are often used in combination regimens and less commonly as monotherapies. Currently, the most widely used first-line regimens in mCRC are (a) combined 5-FU/LV and oxaliplatin (FOLFOX), and (b) combined 5-FU/LV and irinotecan (FOLFIRI). Sequential treatment with FOLFOX and FOLFIRI (in either order) has been shown to improve median survival time to approximately 20 months (35). Although the two regimens do not differ in their efficacy, they have significantly different toxicity profiles: FOLFOX causes neuropathy, whereas FOLFIRI can cause severe diarrhea (36). For patients with unresectable disease, oncologists individualize therapy for each patient and typically continue a regimen as long as the patient is benefiting radiologically and is able to tolerate the regimen. With chemotherapy, breaks are often necessary because of toxicity and fatigue. Oncologists will switch chemotherapy regimens when there is definitive radiologic proof of disease progression (37,38).
Table 2:
Common Anticancer Drugs and Regimens for Treatment of mCRC
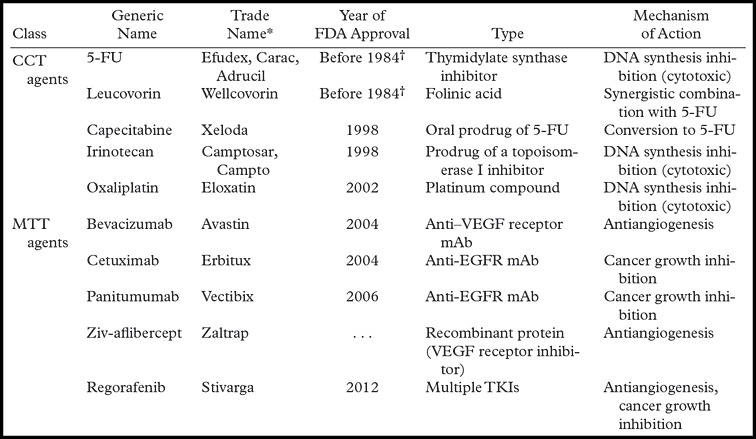
Note.—Commonly used combination regimens include FOLFOX (5-FU, leucovorin, and oxaliplatin [± bevacizumab or panitumumab]); FOLFIRI (5-FU, leucovorin, and irinotecan [± bevacizumab, panitumumab, or cetuximab]); and CAPEOX (capecitabine, leucovorin, and oxaliplatin [± bevacizumab]). CCT = conventional chemotherapeutic, mAb = monoclonal antibody, TKI = thyrosine kinase inhibitor.
Manufacturers are as follows: Efudex: Valeant Pharmaceuticals, Bridgewater, NJ; Carac: Naman Pharma, Mumbai, India; Adrucil: TEVA Pharmaceutical, Petah Tikva, Israel; Wellcovorin: Bedford Laboratories, Bedford, Ohio; Xeloda: Hoffmann-LaRoche, Basel, Switzerland; Camptosar and Campto: Pfizer, New York, NY; Eloxatin: Sanofi Aventis, Bridgewater, NJ; Avastin: Genentech, South San Francisco, Calif; Erbitux: Bristol-Myers Squibb, New York, NY; Vectibix: Amgen, Deerfield, Ill; Zaltrap: Sanofi Aventis; Stivarga: Bayer.
FDA cannot verify year of approval before 1984.
Novel MTTs
Bevacizumab, a monoclonal antibody that binds to VEGF, was approved by the FDA for first-line treatment of mCRC in 2004. NCCN guidelines currently recommend the addition of bevacizumab to first-line combination chemotherapies with FOLFOX, FOLFIRI, and 5-FU/LV (2,3). Evidence supporting the use of bevacizumab beyond progression in second-line regimens recently emerged from the TML (Treatment through Multiple Lines) trial (39). Cetuximab (chimeric human-mouse monoclonal antibody) and panitumumab (fully humanized monoclonal antibody) are anti-EGFR antibodies that bind to the extracellular domain of EGFR and inhibit intracellular signal cascades such as the RAS/RAF/MAPK pathways (2,3). Cetuximab and panitumumab were approved by the FDA in 2004 and 2006, respectively, for use in treating patients with mCRC.
Recent studies have shown that mutations in an intracellular signaling protein, KRAS (seen in 35%–45% of cases of CRC), result in constitutive activation of the EGFR pathway and determine response to anti-EGFR antibodies (2,3). In contrast to CRC without KRAS mutations (eg, wild-type KRAS), CRC with KRAS mutations is not responsive to EGFR inhibition with cetuximab and panitumumab. NCCN guidelines recommend KRAS genotyping in all patients with stage IV colon cancer (2). Mutations in B-RAF (V600E), another intracellular protein (seen in about 5%–9% of cases of colon cancer), have an effect similar to that of mutations in KRAS (2,3).
Ziv-aflibercept is a recombinant protein consisting of human VEGF receptors 1 and 2 fused to the Fc portion of human immunoglobulin G1 that prevents activation of VEGF receptors by inhibiting ligand binding (2,3). Ziv-aflibercept combined with FOLFIRI has been shown to be an effective second-line regimen following progression with first-line non–irinotecan-containing regimens such as FOLFOX (2). Regorafenib is a multitargeted kinase inhibitor with activity against VEGF receptors, Kit, platelet-derived growth factor receptors, and several other kinases (40). Regorafenib has been shown in recent trials to have a modest 6-week survival advantage in patients with mCRC that is refractory to all chemotherapeutic drugs and was approved by the FDA in 2012.
Role of Imaging in Systemic Chemotherapy
Evaluation of response to treatment in patients with mCRC plays a critical role in treatment decisions. Multidetector CT is the most widely used modality for assessing treatment response. Conventionally, multidetector CT evaluation of response to treatment in solid tumors has made use of the Response Evaluation Criteria in Solid Tumors (RECIST) guidelines (41). In recent years, the RECIST guidelines have been updated to RECIST 1.1 to standardize and simplify the criteria (41). Both RECIST and RECIST 1.1 are size-based criteria that define response to treatment as a 30% decrease in unidimensional measurement. Studies have shown the inadequacy of RECIST in assessing treatment response, especially response to MTT. To overcome these inadequacies, several alternative criteria have been proposed that take morphology as well as size into account (42). Choi et al (43) suggested the use of modified criteria based on a combination of size and attenuation changes (≥10% decrease in size or ≥15% decrease in attenuation) in assessing response to treatment in gastrointestinal stromal tumors. Smith et al (44,45) proposed the use of size and attenuation CT criteria and of MASS (morphology, attenuation, size, and structure) criteria for metastatic renal cell carcinoma treated with sunitinib.
Several studies have shown the interpretation of response to the treatment of liver metastases from CRC using RECIST to be suboptimal, since it does not reflect the pathologic response. Pathologic response refers to the percentage of residual viable tumor cells and has been shown in recent studies to correlate with clinical outcome (46). In a study of 59 patients who underwent chemotherapy with (n = 30) or without (n = 29) bevacizumab, Chung et al (47) found that using modified CT criteria (≥10% decrease in size or ≥15% decrease in attenuation) helped identify more good responders than did RECIST 1.1 criteria.
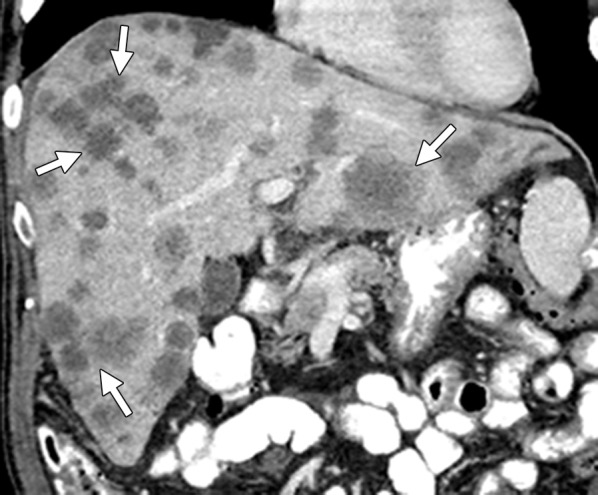
Bevacizumab is an antiangiogenic agent that causes decreased enhancement and attenuation with or without concurrent changes in size. In some studies of patients with mCRC, chemotherapy with and chemotherapy without bevacizumab have been shown to have similar effects on tumor morphology (47). At multidetector CT, response to treatment is characterized by decreases in size, attenuation, enhancement, and internal heterogeneity, and a sharp tumor-liver interface (Fig 2). In a study of 234 lesions in 50 patients, Chun et al (7) described three patterns of morphologic response in liver metastases treated with a bevacizumab-containing regimen. In their study, metastases with a decrease in attenuation, a homogeneous appearance, and a sharp tumor-liver interface represented a good or optimal morphologic response. The disappearance of a peripheral rim of enhancement that was present at pretreatment scanning was also considered to represent a good response. The absence of any of these changes was defined as absent morphologic response. Partial changes in morphology that did not fulfill the criteria for optimal response were described as partial morphologic response. The authors found significant correlation between the three morphologic patterns of response and good pathologic response (7).
Instead of using morphologic criteria, a novel approach to evaluating treatment response to antiangiogenic agents is assessing physiologic changes in tumor vascularity. Dynamic contrast-enhanced CT provides qualitative and quantitative perfusion data in liver metastases and has been shown to be an innovative and reliable tool in monitoring perfusion changes in response to antiangiogenic agents (48,49). Therapy-induced changes in perfusion parameters such as permeability, blood volume, and blood flow have been shown to precede changes in tumor size in some studies (48). The main limitation of dynamic contrast-enhanced CT is the additional radiation exposure it entails and the lack of standardization of the technique and parameters.
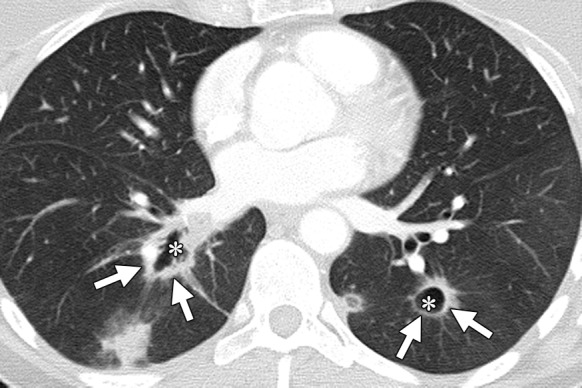
Unusual patterns of response that can mimic disease progression may occur in liver metastases treated with neoadjuvant chemotherapy (Table 3). In our experience, three such patterns of “pseudoprogression” can occur (50). First, lesions that were isoattenuating on pretreatment scans tend to become apparent on posttreatment scans because they become hypoattenuating and can therefore be misinterpreted as new lesions. Second, some lesions increase in size after treatment, with a concurrent decrease in attenuation and enhancement due to intratumoral edema or visualization of a previously isoattenuating component of the lesion (Fig 10) (47). The increase in size according to conventional response criteria may be confused with disease progression. Third, intratumoral hemorrhage due to antiangiogenic agents can cause an increase in the size and attenuation of metastatic lesions and can be interpreted as progressive disease even according to the modified criteria. Recognizing pseudoprogression is critical because failure to do so can result in discontinuation of effective treatment. Pitfalls in interpreting unusual response patterns can be avoided by correlating imaging findings with the clinical status of the patient, tumor markers, and response to treatment at other disease sites. Careful attention to the internal architecture of the lesions (eg, fluid-fluid levels or a change in a lesion from homogeneous to heterogeneous) and use of unenhanced CT or MR imaging can be helpful in cases of intratumoral hemorrhage. Follow-up imaging can demonstrate a gradual decrease in the size and attenuation of responding metastatic lesions; consequently, nonacute treatment-related decisions should always be deferred until follow-up imaging in patients who are suspected of having pseudoprogression. An unusual pattern of response is also known to occur in lung metastases treated with bevacizumab-containing regimens. The metastases typically demonstrate central lucency and cavitation due to central necrosis, despite a size increase (Fig 11). Spontaneous pneumothorax can occur with cavitation in subpleural metastases (51). Similarly to hepatic metastases, peritoneal deposits show a decrease in size and enhancement in response to chemotherapy. A decrease in ascites and relief of bowel obstruction may be indirect signs of treatment response in peritoneal carcinomatosis. Treated bone metastases are typically more sclerotic on follow-up scans (8).
Table 3:
Treatment Response Patterns and Toxicities/Complications in mCRC
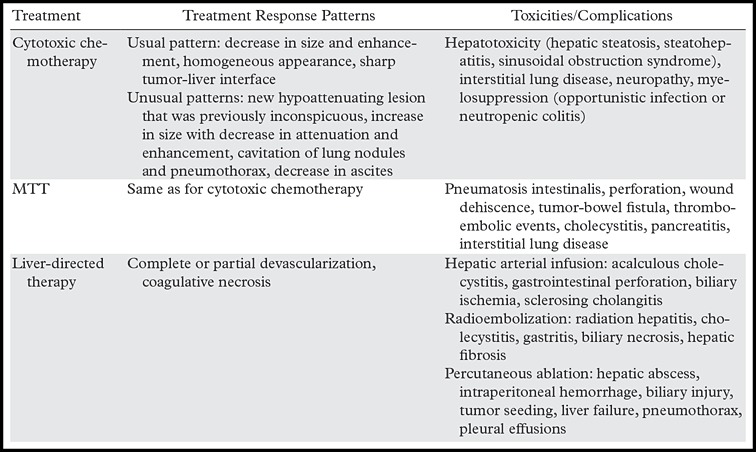
Figure 10a.
Treatment response in a 58-year-old man with mCRC to the liver. (a) Coronal reformatted contrast-enhanced baseline CT image demonstrates multiple heterogeneous liver metastases with an irregular tumor-liver interface (arrows). (b) On a follow-up CT image obtained after three cycles of treatment with FOLFIRI and bevacizumab, the lesions (arrows) demonstrate a slight increase in size, a concurrent decrease in attenuation, relative homogeneity, and a sharp tumor-liver interface. The size increase can be confused with disease progression (pseudoprogression). However, the other morphologic changes, taken together with a decrease in the tumor markers, favor true treatment response. (c) Follow-up CT image obtained 2 months later shows a decrease in the size of the lesions (arrows), a finding that indicates continued treatment response.
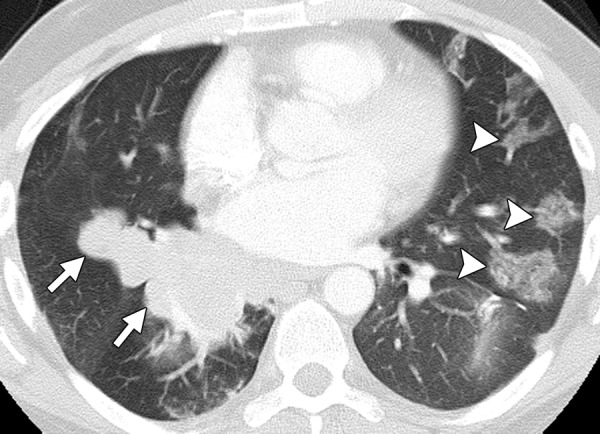
Figure 11a.
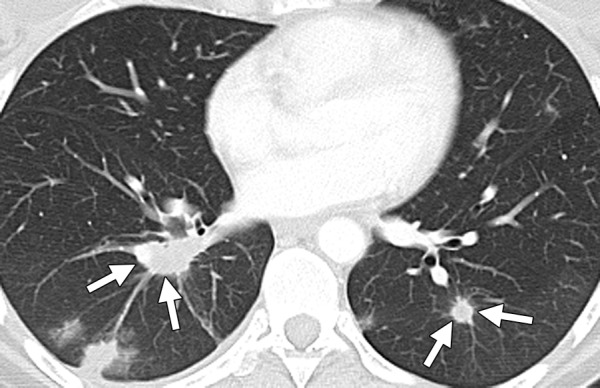
Treatment response in a 53-year-old woman with pulmonary metastases from rectal cancer. (a) Baseline CT image of the chest demonstrates bilateral lower lobe lung nodules (arrows). (b) Follow-up CT image obtained 2 months after the start of treatment with FOLFIRI and bevacizumab demonstrates cavitation in the metastatic deposits (*), a known treatment effect, with an apparent increase in the size of the lesions (arrows).
Figure 10b.
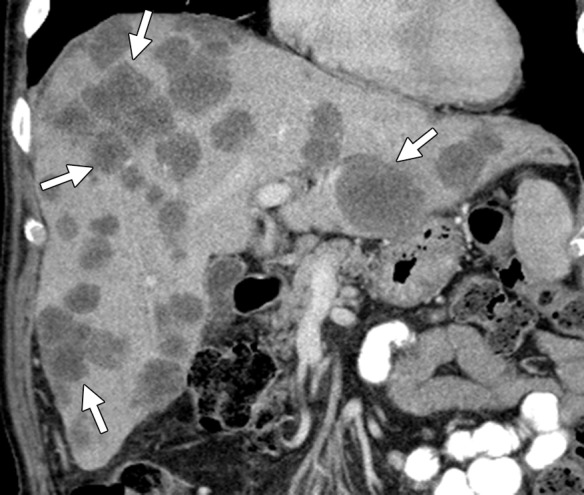
Treatment response in a 58-year-old man with mCRC to the liver. (a) Coronal reformatted contrast-enhanced baseline CT image demonstrates multiple heterogeneous liver metastases with an irregular tumor-liver interface (arrows). (b) On a follow-up CT image obtained after three cycles of treatment with FOLFIRI and bevacizumab, the lesions (arrows) demonstrate a slight increase in size, a concurrent decrease in attenuation, relative homogeneity, and a sharp tumor-liver interface. The size increase can be confused with disease progression (pseudoprogression). However, the other morphologic changes, taken together with a decrease in the tumor markers, favor true treatment response. (c) Follow-up CT image obtained 2 months later shows a decrease in the size of the lesions (arrows), a finding that indicates continued treatment response.
Figure 10c.
Treatment response in a 58-year-old man with mCRC to the liver. (a) Coronal reformatted contrast-enhanced baseline CT image demonstrates multiple heterogeneous liver metastases with an irregular tumor-liver interface (arrows). (b) On a follow-up CT image obtained after three cycles of treatment with FOLFIRI and bevacizumab, the lesions (arrows) demonstrate a slight increase in size, a concurrent decrease in attenuation, relative homogeneity, and a sharp tumor-liver interface. The size increase can be confused with disease progression (pseudoprogression). However, the other morphologic changes, taken together with a decrease in the tumor markers, favor true treatment response. (c) Follow-up CT image obtained 2 months later shows a decrease in the size of the lesions (arrows), a finding that indicates continued treatment response.
Figure 11b.
Treatment response in a 53-year-old woman with pulmonary metastases from rectal cancer. (a) Baseline CT image of the chest demonstrates bilateral lower lobe lung nodules (arrows). (b) Follow-up CT image obtained 2 months after the start of treatment with FOLFIRI and bevacizumab demonstrates cavitation in the metastatic deposits (*), a known treatment effect, with an apparent increase in the size of the lesions (arrows).
The role of MR imaging in the assessment of treatment response is less defined. At our institution, MR imaging is used as a problem-solving tool in cases of suspected pseudoprogression. Pseudoprogression due to intratumoral hemorrhage manifests with high signal intensity on T1-weighted images. MR imaging with hepatocyte-specific contrast agents can help detect disappearing liver metastases, which remain hypointense in the hepatobiliary phase. MR imaging is also useful in the detection of liver metastases in the setting of chemotherapy-induced hepatic steatosis, especially if surgical resection is being contemplated. In a study of 20 patients with CRC liver metastases who underwent preoperative multidetector CT and MR imaging in the setting of neoadjuvant chemotherapy–induced fatty infiltration followed by surgical resection of the metastases, Kulemann et al (18) found that MR imaging detected more lesions less than 1 cm than did multidetector CT (66% versus 11%). Hepatocyte-specific contrast agents were used in 14 of the 20 patients in their study (18). Some recent studies have shown dynamic contrast-enhanced MR imaging to act as a surrogate marker for measuring the efficacy of bevacizumab-containing chemotherapy regimens, since it allows in vivo measurement of capillary perfusion, which determines delivery of drugs to the tumor cells. Dynamic contrast-enhanced MR imaging can help predict treatment response by measuring the volume transfer constant Ktrans and rate constant Kep. A high baseline Ktrans has been shown to correlate with better outcome with cytotoxic agents in CRC (52). In a study by De Bruyne et al (53), a decrease in Ktrans of more than 40% after bevacizumab-containing chemotherapy was associated with better progression-free survival, although this has not been corroborated in other studies. DW imaging can also help detect small lesions (<10 mm) that are not detectable with other modalities (54). An increase in the ADC values in metastatic lesions at DW imaging has also been reported as an indicator of physiologic treatment response (54). Some studies have shown that software-based volumetric changes in enhancement and ADC values at postcontrast and DW MR imaging, respectively, can help predict the response of liver tumors to various therapies (55). The role of PET/CT in monitoring mCRC therapy has not yet been established. A decline in metabolic activity during treatment is indicative of favorable treatment response. However, complete resolution of metabolic activity is not always indicative of pathologic complete response. PET/CT has less sensitivity for detecting lesions under 10 mm. In a recent meta-analysis, van Kessel et al (28) found that the sensitivity of PET/CT for detecting liver metastases after neoadjuvant chemotherapy dropped from 71% to 52%, most likely due to the small size of the treated lesions and to central necrosis (28). The NCCN guidelines do not recommend PET/CT for assessing treatment response, since both false-negative (necrotic lesions) and false-positive (inflammation and surgery) results are known to occur (2,3).
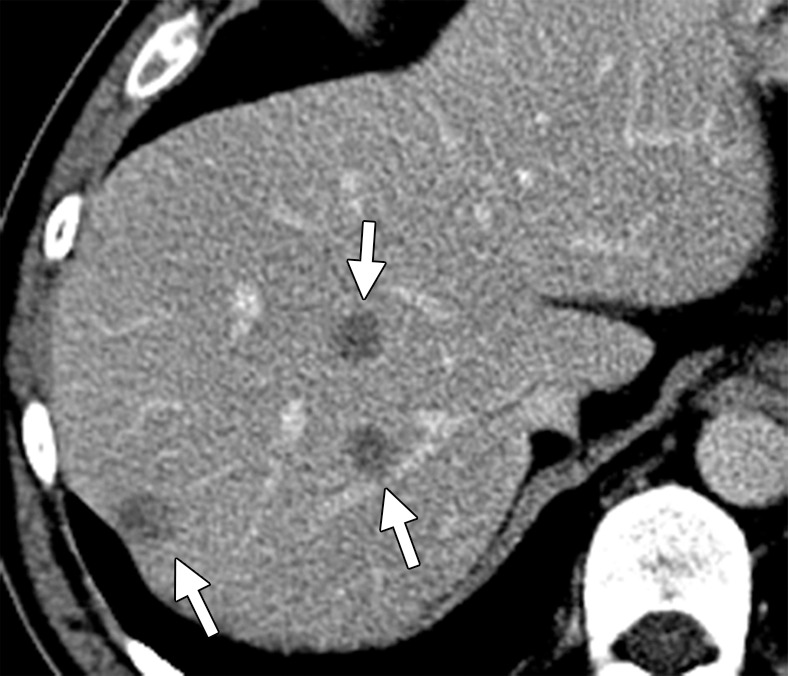
Complications and Toxicities Associated with Treatment of mCRC
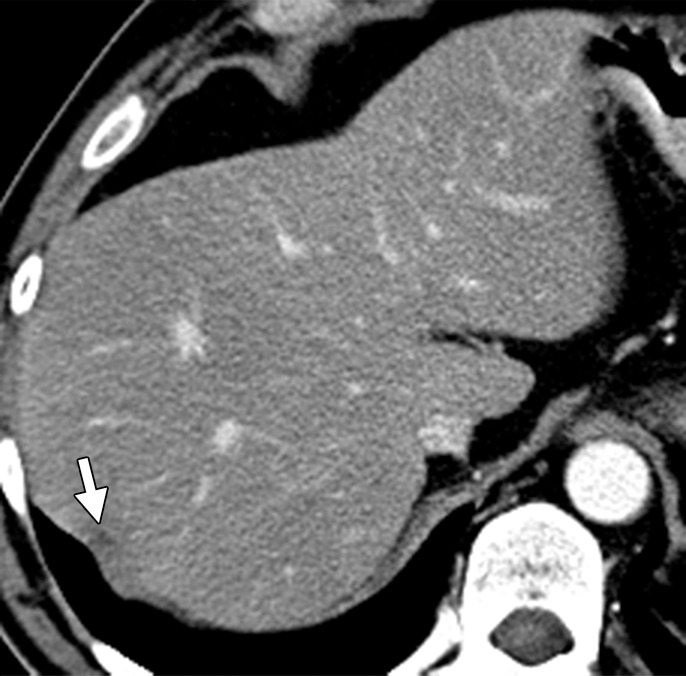
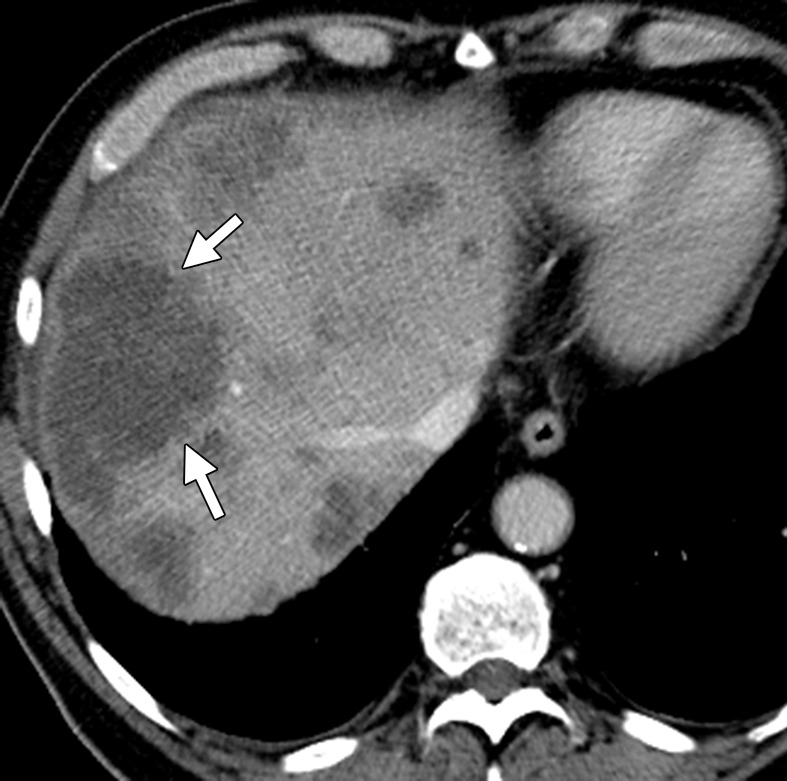
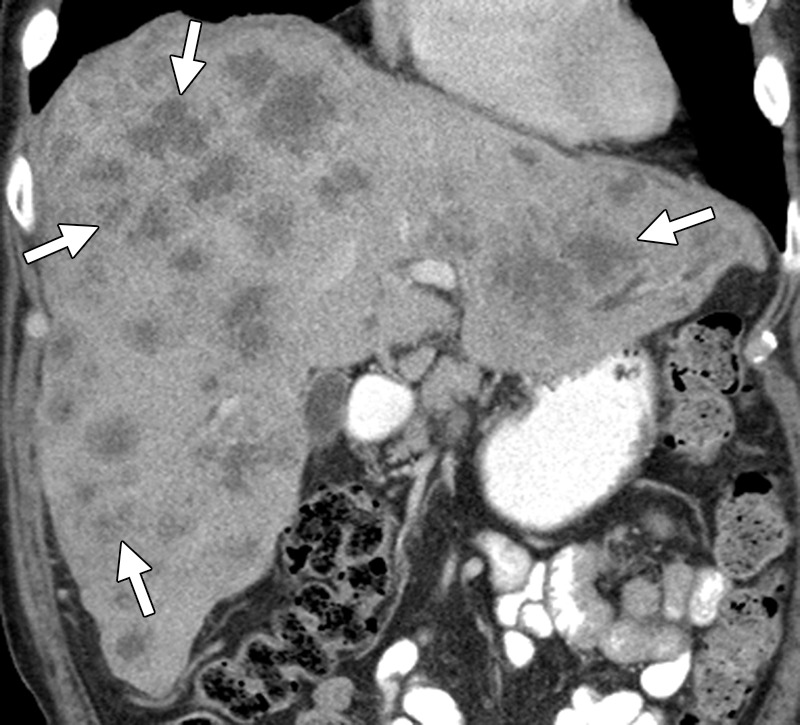
Several unexpected side effects are known to occur with the use of both conventional chemotherapeutic drugs and MTT in patients with mCRC (Table 3). Oxaliplatin-based regimens are known to cause endothelial injury with resultant veno-occlusive disease or sinusoidal obstruction syndrome (56). Sinusoidal obstruction syndrome causes disruption of the sinusoidal wall, fibrosis, and nodular regenerative hyperplasia. At imaging, sinusoidal obstruction syndrome manifests as hepatosplenomegaly, portal hypertension, and sluggish portal venous flow, increasing the risk of portal vein thrombosis (6). Early detection of sinusoidal injury can be achieved by monitoring signs of portal hypertension, especially splenic enlargement (25). Sinusoidal obstruction syndrome can result in postresection liver failure in patients with a poor future liver remnant, in spite of portal vein embolization (6). 5-FU–based chemotherapy is known to cause steatosis. Hepatic steatosis results in a diffuse decrease in liver attenuation, which may obscure metastatic lesions (Fig 12) (18). Quantification of hepatic steatosis can be performed with unenhanced CT and chemical shift MR imaging. Irinotecan has been shown to cause steatohepatitis (steatosis with hepatic inflammation) (2,3). Steatohepatitis may progress to cirrhosis; early signs of such transformation include abnormal enhancement and restriction of diffusion on DW images (6). Chemotherapy-associated steatohepatitis has been shown to increase the risk of postoperative morbidity and mortality.
Figure 12a.
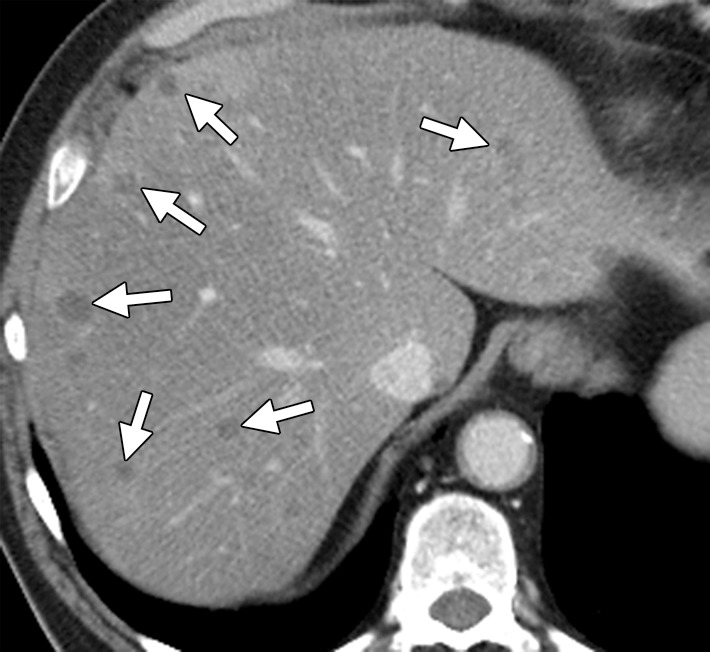
Hepatic steatosis in a 65-year-old man with metachronous liver metastases from rectal cancer. (a) Contrast-enhanced CT image obtained before the start of nine cycles of treatment with FOLFIRI and bevacizumab demonstrates multiple hypoattenuating liver metastases (arrows). (b) Posttreatment follow-up CT image demonstrates partial obscuration of the liver metastases (arrows) secondary to the development of hepatic steatosis.
Figure 12b.
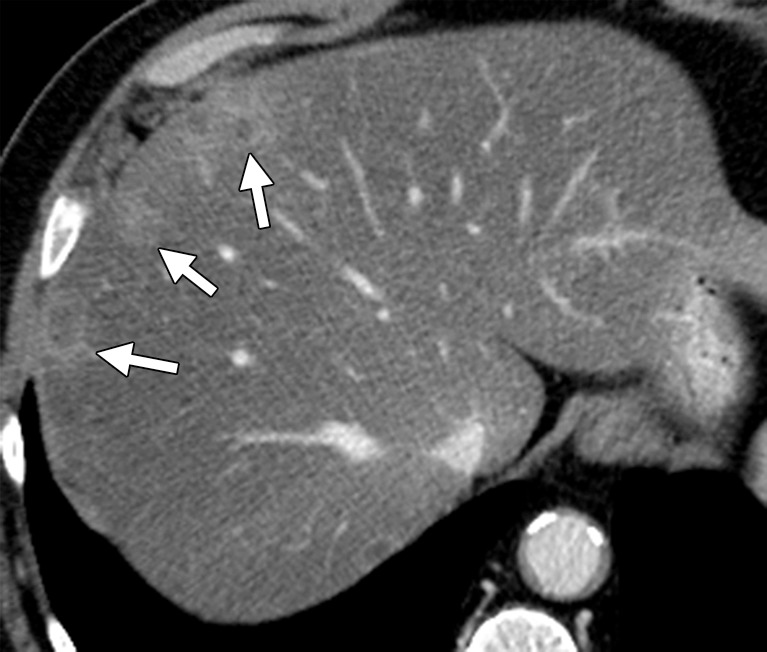
Hepatic steatosis in a 65-year-old man with metachronous liver metastases from rectal cancer. (a) Contrast-enhanced CT image obtained before the start of nine cycles of treatment with FOLFIRI and bevacizumab demonstrates multiple hypoattenuating liver metastases (arrows). (b) Posttreatment follow-up CT image demonstrates partial obscuration of the liver metastases (arrows) secondary to the development of hepatic steatosis.
Other toxicities associated with conventional chemotherapeutic agents include neuropathy (oxaliplatin), severe diarrhea (irinotecan), and hand-foot syndrome (capecitabine) (36). Pulmonary toxicity in the form of interstitial lung disease or organizing pneumonia associated with oxaliplatin is a rare complication but may be mistaken for progressive disease in patients with lung metastases (57).
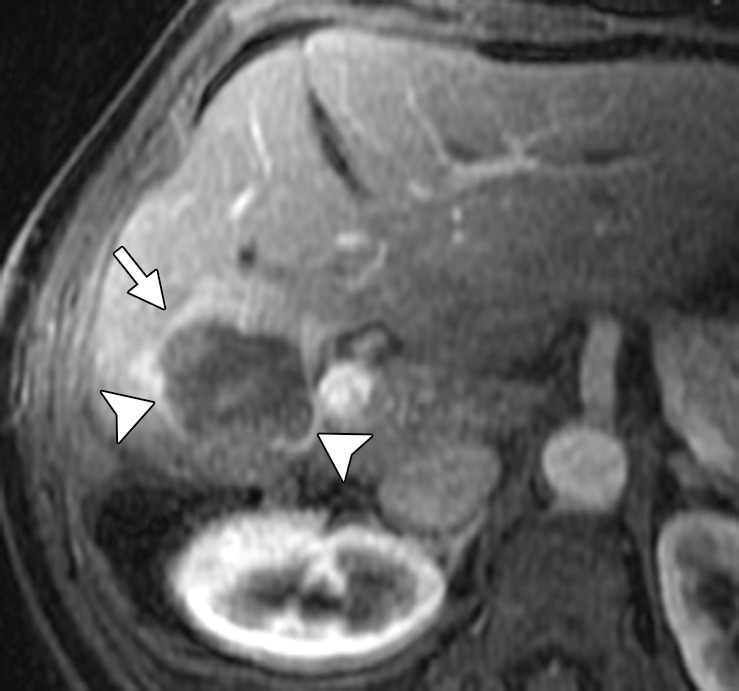
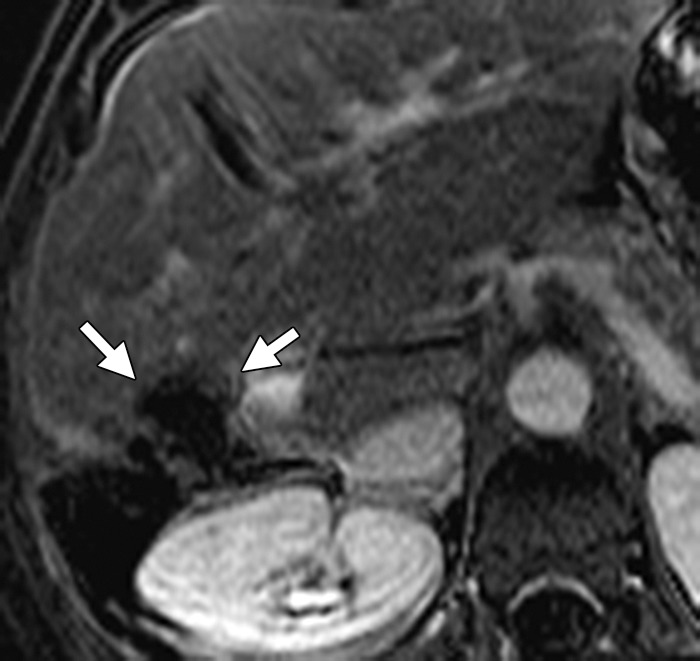
Bevacizumab has been associated with bowel and vascular complications. Gastrointestinal perforation is seen in up to 2% of patients receiving bevacizumab therapy and usually occurs in the setting of recent surgery, colonoscopy, peritoneal carcinomatosis, or primary tumor in situ (58). Pneumatosis intestinalis is a class-specific toxicity of anti-VEGF MTT and is postulated to result from ischemia induced by microvascular thrombosis. Pneumatosis is asymptomatic in the early stages but can result in complications such as bowel perforation (Fig 13) and tumor-bowel fistula (59). Management of bevacizumab-associated pneumatosis and bowel perforation includes prompt discontinuation of the drug. In a study by Shinagare et al (59), 22 of 24 patients with MTT-associated pneumatosis or bowel perforation required discontinuation of MTT. Other bowel complications associated with bevacizumab include anastomotic dehiscence caused by impaired wound healing due to anti-VEGF effect (Fig 14) (60). The NCCN guidelines recommend discontinuation of bevacizumab at least 6 weeks prior to elective surgery (2,3). Anti-VEGF agents increase the risk of both thromboembolic and hemorrhagic events (Fig 15). Venous thromboembolism increases the risk of pulmonary embolism (51). Careful attention to thromboembolic complications is required, since pulmonary embolism in oncology patients is often asymptomatic and incidentally detected on restaging scans. The risk of arterial events, including stroke, is significantly increased in patients over 65 years of age (2). Bevacizumab is associated with hypertensive encephalopathy (posterior reversible encephalopathy syndrome), which is characterized by subcortical white matter changes in the occipital and posterior temporoparietal lobes (51). Uncommon class-specific complications associated with antiangiogenic agents such as bevacizumab include acute cholecystitis (61).
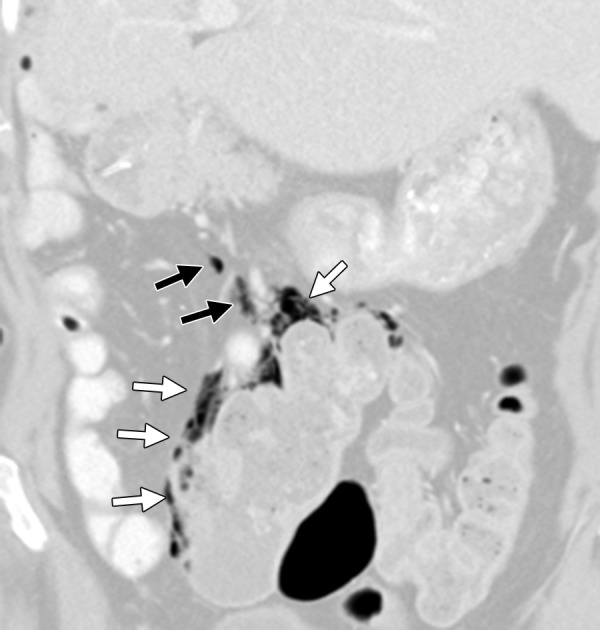
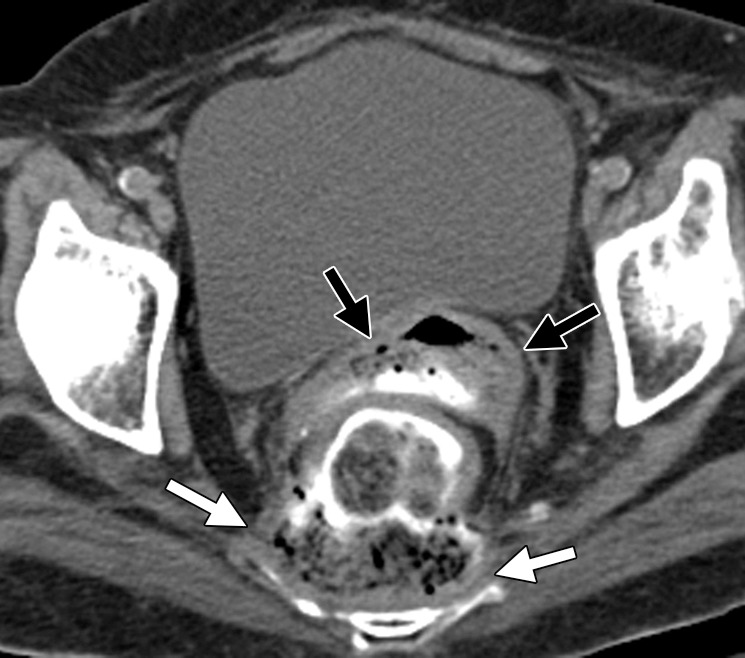
Figure 13.
Bowel perforation in a 63-year-old woman with mCRC. The patient had undergone right hemicolectomy, partial hepatectomy, and nine cycles of treatment with irinotecan and bevacizumab. Coronal reformatted contrast-enhanced CT image demonstrates pneumatosis of the colon (white arrows) and free intraperitoneal air (black arrows), findings that are suggestive of perforation.
Figure 14a.
Anastomotic dehiscence in a 76-year-old woman with rectal cancer and liver metastasis who underwent low anterior resection followed by 4 months of treatment with FOLFIRI and bevacizumab. Treatment was interrupted for 2 months for reversal of ileostomy, which resulted in progression of liver metastasis. (a) Contrast-enhanced CT image obtained 1 month after the resumption of treatment demonstrates scattered foci of air adjacent to the anastomotic site (arrows) and a small amount of presacral fluid (arrowheads). Two months after the start of treatment, the patient presented with pelvic pain and discharge of fecal matter through the vagina. (b) Unenhanced CT image obtained during this acute presentation reveals a breakdown of the anastomotic site, with a rectovaginal fistula (black arrows) and a large, presacral feculent collection containing fluid and gas (white arrows).
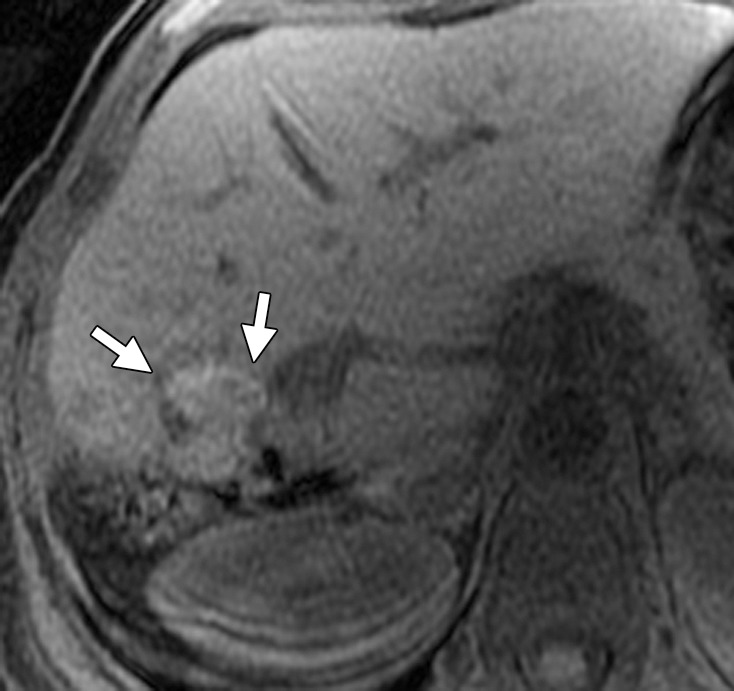
Figure 15a.
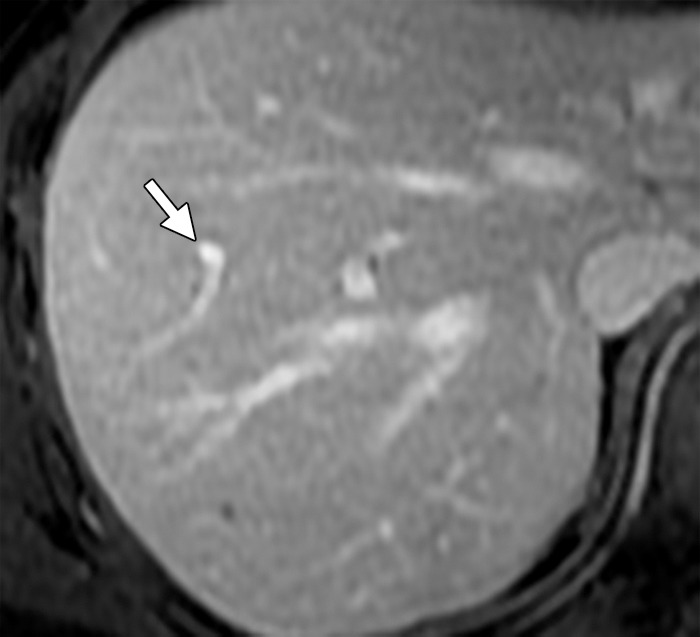
Thrombosis in a 56-year-old man with mCRC. (a) Axial gadolinium-enhanced fat-suppressed T1-weighted baseline MR image demonstrates normal enhancement of the portal vein branches (arrow). (b, c) Follow-up arterial phase (b) and equilibrium phase (c) MR images obtained with hepatocyte-specific contrast material after three cycles of treatment with FOLFOX and bevacizumab show hypointense signal voids in a segmental branch of the portal vein (arrow), a finding that is suggestive of thrombosis. Note the heterogeneous enhancement of the liver parenchyma due to the presence of additional thrombi.
Figure 14b.
Anastomotic dehiscence in a 76-year-old woman with rectal cancer and liver metastasis who underwent low anterior resection followed by 4 months of treatment with FOLFIRI and bevacizumab. Treatment was interrupted for 2 months for reversal of ileostomy, which resulted in progression of liver metastasis. (a) Contrast-enhanced CT image obtained 1 month after the resumption of treatment demonstrates scattered foci of air adjacent to the anastomotic site (arrows) and a small amount of presacral fluid (arrowheads). Two months after the start of treatment, the patient presented with pelvic pain and discharge of fecal matter through the vagina. (b) Unenhanced CT image obtained during this acute presentation reveals a breakdown of the anastomotic site, with a rectovaginal fistula (black arrows) and a large, presacral feculent collection containing fluid and gas (white arrows).
Figure 15b.
Thrombosis in a 56-year-old man with mCRC. (a) Axial gadolinium-enhanced fat-suppressed T1-weighted baseline MR image demonstrates normal enhancement of the portal vein branches (arrow). (b, c) Follow-up arterial phase (b) and equilibrium phase (c) MR images obtained with hepatocyte-specific contrast material after three cycles of treatment with FOLFOX and bevacizumab show hypointense signal voids in a segmental branch of the portal vein (arrow), a finding that is suggestive of thrombosis. Note the heterogeneous enhancement of the liver parenchyma due to the presence of additional thrombi.
Figure 15c.

Thrombosis in a 56-year-old man with mCRC. (a) Axial gadolinium-enhanced fat-suppressed T1-weighted baseline MR image demonstrates normal enhancement of the portal vein branches (arrow). (b, c) Follow-up arterial phase (b) and equilibrium phase (c) MR images obtained with hepatocyte-specific contrast material after three cycles of treatment with FOLFOX and bevacizumab show hypointense signal voids in a segmental branch of the portal vein (arrow), a finding that is suggestive of thrombosis. Note the heterogeneous enhancement of the liver parenchyma due to the presence of additional thrombi.
Cetuximab and panitumumab have been associated with severe infusion reactions in 3% and 1% of patients, respectively (62,63), and severe skin reactions have been reported with both EGFR agents. Pulmonary complications, including interstitial lung disease (Fig 16), have been reported with cetuximab (64).
Figure 16.
Interstitial lung disease in a 42-year-old man with metastatic colon cancer. The cancer was refractory to FOLFIRI and cetuximab, and the patient was switched to panitumumab. Chest CT image obtained 2 months after the start of treatment demonstrates patchy consolidation and ground-glass opacities, predominantly in the left lung (arrowheads), findings that are consistent with drug toxicity (interstitial lung disease–cryptogenic organizing pneumonia). Note the large conglomerate deposit in the right lung (arrows).
Complications Associated with Liver-directed Therapies
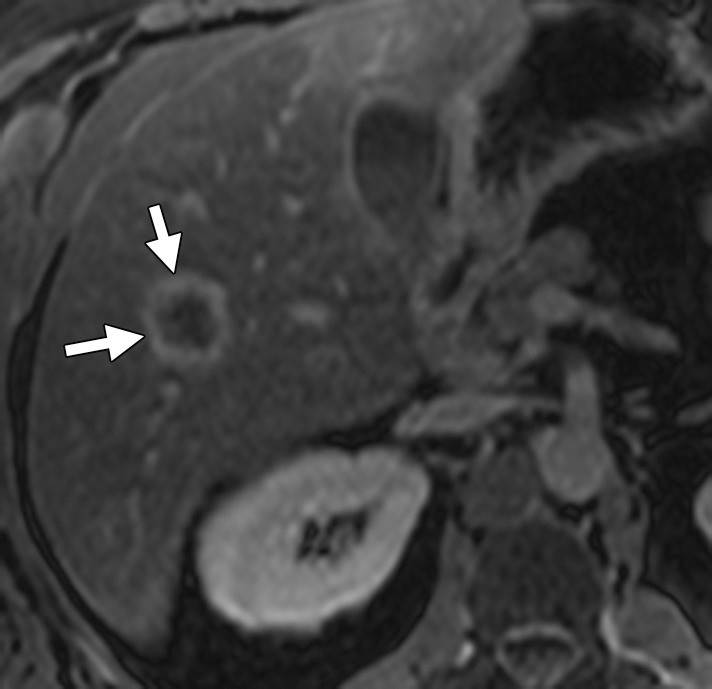
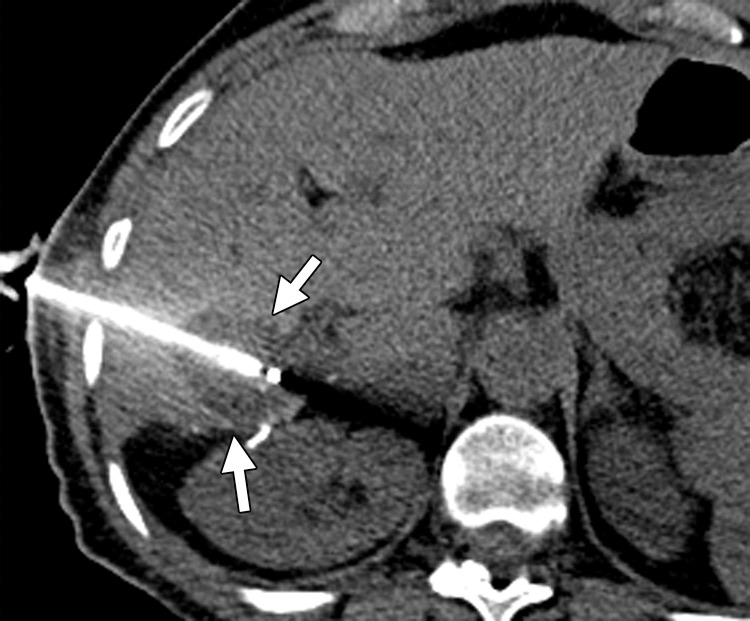
Hepatic arterial infusion has been associated with acute acalculous cholecystitis, gastrointestinal perforation, biliary ischemia, and sclerosing cholangitis (Table 3). Radioembolization and stereotactic body radiation therapy can result in radiation hepatitis, cholecystitis, gastritis, gastric and duodenal ulcers, biliary necrosis, and lobar atrophy of the liver. Late complications associated with radiation include hepatic fibrosis, bile duct necrosis, and eventual portal hypertension (34). Major complications associated with percutaneous ablation include hepatic abscess, intraperitoneal hemorrhage, biliary injury, vascular thrombosis (Fig 17), tumor seeding, liver failure, gastrointestinal perforation, and pulmonary complications such as pneumothorax and pleural effusions (65).
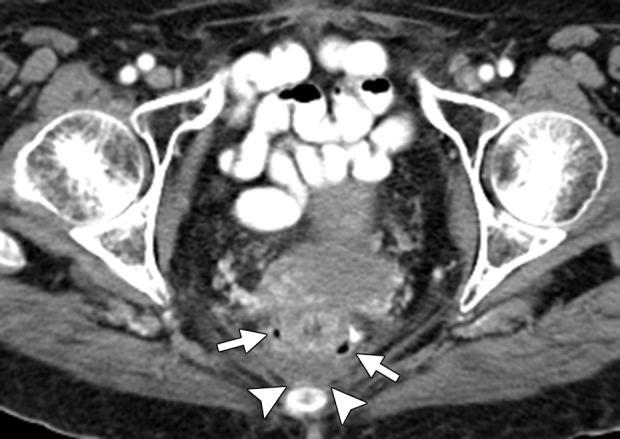
Figure 17a.
Vascular thrombosis in a 66-year-old woman with sigmoid colon cancer. (a) Contrast-enhanced baseline CT image demonstrates a hypoattenuating metastatic deposit (black arrow) in the right hepatic lobe. Note the normal enhancement of the portal vein branches (white arrow). The patient underwent laparoscopic sigmoid colectomy followed by percutaneous ablation of the liver metastasis. (b) Postablation follow-up CT image demonstrates a large, hypoattenuating ablation zone (black arrows) associated with thrombosis of the posterior division of the right branch of the portal vein (white arrow).
Figure 17b.
Vascular thrombosis in a 66-year-old woman with sigmoid colon cancer. (a) Contrast-enhanced baseline CT image demonstrates a hypoattenuating metastatic deposit (black arrow) in the right hepatic lobe. Note the normal enhancement of the portal vein branches (white arrow). The patient underwent laparoscopic sigmoid colectomy followed by percutaneous ablation of the liver metastasis. (b) Postablation follow-up CT image demonstrates a large, hypoattenuating ablation zone (black arrows) associated with thrombosis of the posterior division of the right branch of the portal vein (white arrow).
Conclusion
In this era of personalized cancer care, imaging plays a critical role in the management of patients with mCRC. The development of new treatment regimens necessitates more rigorous imaging strategies for diagnosis and surveillance of mCRC, making radiologists an integral part of the multidisciplinary team caring for these patients. Multidetector CT and MR imaging are crucial in the diagnosis and treatment evaluation of mCRC. PET/CT is useful in ruling out extrahepatic disease when hepatectomy is being considered. Patients with unresectable disease are treated with systemic chemotherapy, most commonly FOLFOX and FOLFIRI in combination with bevacizumab, cetuximab, or panitumumab. There is growing evidence that response to systemic therapy is best assessed with alternative treatment response criteria. Attention must be paid to complications and toxicities associated with treatment for mCRC when imaging studies are being interpreted.
Recipient of a Certificate of Merit award for an education exhibit at the 2012 RSNA Annual Meeting.
M.N. and A.B.S. have provided disclosures (see “Disclosures of Conflicts of Interest”); all other authors have disclosed no relevant relationships.
Funding: The research was supported by the National Cancer Institute.
Disclosures of Conflicts of Interest.—A.B.S.: Activities related to the present article: grant from the Radiological Society of North America. Activities not related to the present article: disclosed no relevant relationships. Other activities: disclosed no relevant relationships. M.N.: Activities related to the present article: grant from the National Cancer Institute. Activities not related to the present article: disclosed no relevant relationships. Other activities: disclosed no relevant relationships.
Current address: Department of Radiology and Research Institute of Radiology, University of Ulsan College of Medicine, Asan Medical Center, Seoul, South Korea.
Abbreviations:
- ADC
- apparent diffusion coefficient
- CRC
- colorectal cancer
- DW
- diffusion-weighted
- EGFR
- epidermal growth factor receptor
- FDA
- U.S. Food and Drug Administration
- FDG
- 2-[fluorine-18]fluoro-2-deoxy-d-glucose
- 5-FU/LV
- 5-fluorouracil/leucovorin
- Gd-BOPTA
- gadolinium-benzyloxypropionictetraacetate
- Gd-EOB-DTPA
- gadolinium-ethoxybenzyl-diethylenetriamine pentaacetic acid
- mCRC
- metastatic colorectal cancer
- MTT
- molecular targeted therapy
- NCCN
- National Comprehensive Cancer Network
- RECIST
- Response Evaluation Criteria in Solid Tumors
- VEGF
- vascular endothelial growth factor
References
- 1.Siegel R, Naishadham D, Jemal A. Cancer statistics, 2012. CA Cancer J Clin 2012;62(1):10–29. [DOI] [PubMed] [Google Scholar]
- 2.NCCN Clinical Practice Guidelines in Oncology Colon Cancer Version 3.2013. National Comprehensive Cancer Network Web site. http://www.nccn.org/professionals/physician_gls/pdf/colon.pdf. Published November 26, 2012. Accessed March 12, 2013. [DOI] [PubMed] [Google Scholar]
- 3.NCCN Clinical Practice Guidelines in Oncology Rectal Cancer Version 4.2013. National Comprehensive Cancer Network Web site. http://www.nccn.org/professionals/physician_gls/pdf/rectal.pdf. Published November 26, 2012. Accessed March 12, 2013. [Google Scholar]
- 4.Kopetz S, Chang GJ, Overman MJ, et al. Improved survival in metastatic colorectal cancer is associated with adoption of hepatic resection and improved chemotherapy. J Clin Oncol 2009;27(22):3677–3683. [DOI] [PMC free article] [PubMed] [Google Scholar]
- 5.Goldberg RM. Advances in the treatment of metastatic colorectal cancer. Oncologist 2005;10(suppl 3): 40–48. [DOI] [PubMed] [Google Scholar]
- 6.Fowler KJ, Linehan DC, Menias CO. Colorectal liver metastases: state of the art imaging. Ann Surg Oncol 2013;20(4):1185–1193. [DOI] [PubMed] [Google Scholar]
- 7.Chun YS, Vauthey J-N, Boonsirikamchai P, et al. Association of computed tomography morphologic criteria with pathologic response and survival in patients treated with bevacizumab for colorectal liver metastases. JAMA 2009;302(21):2338–2344. [DOI] [PMC free article] [PubMed] [Google Scholar]
- 8.O’Connor OJ, McDermott S, Slattery J, Sahani D, Blake MA. The use of PET-CT in the assessment of patients with colorectal carcinoma. Int J Surg Oncol 2011;2011:846512. [DOI] [PMC free article] [PubMed] [Google Scholar]
- 9.Tirumani SH, Fraser-Hill M, Auer R, et al. Mucinous neoplasms of the appendix: a current comprehensive clinicopathologic and imaging review. Cancer Imaging 2013;13:14–25. [DOI] [PMC free article] [PubMed] [Google Scholar]
- 10.Mongan JP, Fadul CE, Cole BF, et al. Brain metastases from colorectal cancer: risk factors, incidence, and the possible role of chemokines. Clin Colorectal Cancer 2009;8(2):100–105. [DOI] [PubMed] [Google Scholar]
- 11.Ong KO, Leen E. Radiological staging of colorectal liver metastases. Surg Oncol 2007;16(1):7–14. [DOI] [PubMed] [Google Scholar]
- 12.Rafaelsen SR, Jakobsen A. Contrast-enhanced ultrasound vs multidetector-computed tomography for detecting liver metastases in colorectal cancer: a prospective, blinded, patient-by-patient analysis. Colorectal Dis 2011;13(4):420–425. [DOI] [PubMed] [Google Scholar]
- 13.Mazzoni G, Napoli A, Mandetta S, et al. Intra-operative ultrasound for detection of liver metastases from colorectal cancer. Liver Int 2008;28(1):88–94. [DOI] [PubMed] [Google Scholar]
- 14.Ruzzenente A, Conci S, Iacono C, et al. Usefulness of contrast-enhanced intraoperative ultrasonography (CE-IOUS) in patients with colorectal liver metastases after preoperative chemotherapy. J Gastrointest Surg 2013; 17(2):281–287. [DOI] [PubMed] [Google Scholar]
- 15.Sica GT, Ji H, Ros PR. CT and MR imaging of hepatic metastases. AJR Am J Roentgenol 2000;174(3): 691–698. [DOI] [PubMed] [Google Scholar]
- 16.Soyer P, Poccard M, Boudiaf M, et al. Detection of hypovascular hepatic metastases at triple-phase helical CT: sensitivity of phases and comparison with surgical and histopathologic findings. Radiology 2004;231(2): 413–420. [DOI] [PubMed] [Google Scholar]
- 17.Schima W, Kulinna C, Langenberger H, Ba-Ssalamah A. Liver metastases of colorectal cancer: US, CT or MR? Cancer Imaging 2005;5(Spec No A):S149–S156. [DOI] [PMC free article] [PubMed] [Google Scholar]
- 18.Kulemann V, Schima W, Tamandl D, et al. Preoperative detection of colorectal liver metastases in fatty liver: MDCT or MRI? Eur J Radiol 2011;79(2):e1–e6. [DOI] [PubMed] [Google Scholar]
- 19.Bajpai S, Sahani D. Recent progress in imaging of colorectal cancer liver metastases. Curr Colorectal Cancer Rep 2009;5(2):99–107. [Google Scholar]
- 20.Löwenthal D, Zeile M, Lim WY, et al. Detection and characterisation of focal liver lesions in colorectal carcinoma patients: comparison of diffusion-weighted and Gd-EOB-DTPA enhanced MR imaging. Eur Radiol 2011;21(4):832–840. [DOI] [PubMed] [Google Scholar]
- 21.Niekel MC, Bipat S, Stoker J. Diagnostic imaging of colorectal liver metastases with CT, MR imaging, FDG PET, and/or FDG PET/CT: a meta-analysis of prospective studies including patients who have not previously undergone treatment. Radiology 2010;257(3): 674–684. [DOI] [PubMed] [Google Scholar]
- 22.Au-Yeung AW, Luk WH, Lo AX. Imaging features of colorectal liver metastasis in FDG PET-CT: a retrospective correlative analysis between CT attenuation and FDG uptake. Nucl Med Commun 2012;33(4):403–407 [DOI] [PubMed] [Google Scholar]
- 23.Xu LH, Cai SJ, Cai GX, Peng WJ. Imaging diagnosis of colorectal liver metastases. World J Gastroenterol 2011;17(42):4654–4659. [DOI] [PMC free article] [PubMed] [Google Scholar]
- 24.Robertson DJ, Stukel TA, Gottlieb DJ, Sutherland JM, Fisher ES. Survival after hepatic resection of colorectal cancer metastases: a national experience. Cancer 2009;115(4):752–759. [DOI] [PMC free article] [PubMed] [Google Scholar]
- 25.Adam R, De Gramont A, Figueras J, et al. The oncosurgery approach to managing liver metastases from colorectal cancer: a multidisciplinary international consensus. Oncologist 2012;17(10):1225–1239. [DOI] [PMC free article] [PubMed] [Google Scholar]
- 26.Leonard GD, Brenner B, Kemeny NE. Neoadjuvant chemotherapy before liver resection for patients with unresectable liver metastases from colorectal carcinoma. J Clin Oncol 2005;23(9):2038–2048. [DOI] [PubMed] [Google Scholar]
- 27.Chua TC, Pelz JO, Kerscher A, Morris DL, Esquivel J. Critical analysis of 33 patients with peritoneal carcinomatosis secondary to colorectal and appendiceal signet ring cell carcinoma. Ann Surg Oncol 2009;16(10): 2765–2770. [DOI] [PubMed] [Google Scholar]
- 28.van Kessel CS, Buckens CF, van den Bosch MA, van Leeuwen MS, van Hillegersberg R, Verkooijen HM. Preoperative imaging of colorectal liver metastases after neoadjuvant chemotherapy: a meta-analysis. Ann Surg Oncol 2012;19(9):2805–2813. [DOI] [PMC free article] [PubMed] [Google Scholar]
- 29.Karlo C, Reiner CS, Stolzmann P, et al. CT- and MRI-based volumetry of resected liver specimen: comparison to intraoperative volume and weight measurements and calculation of conversion factors. Eur J Radiol 2010;75(1):e107–e111. [DOI] [PubMed] [Google Scholar]
- 30.Misiakos EP, Karidis NP, Kouraklis G. Current treatment for colorectal liver metastases. World J Gastroenterol 2011;17(36):4067–4075. [DOI] [PMC free article] [PubMed] [Google Scholar]
- 31.Fiorentini G, Aliberti C, Tilli M, et al. Intra-arterial infusion of irinotecan-loaded drug-eluting beads (DEBIRI) versus intravenous therapy (FOLFIRI) for hepatic metastases from colorectal cancer: final results of a phase III study. Anticancer Res 2012;32(4): 1387–1395. [PubMed] [Google Scholar]
- 32.Cirocchi R, Trastulli S, Boselli C, et al. Radiofrequency ablation in the treatment of liver metastases from colorectal cancer. Cochrane Database Syst Rev 2012;6: CD006317. [DOI] [PMC free article] [PubMed] [Google Scholar]
- 33.Kim YS, Rhim H, Lim HK, Choi D, Lee MW, Park MJ. Coagulation necrosis induced by radiofrequency ablation in the liver: histopathologic and radiologic review of usual to extremely rare changes. RadioGraphics 2011;31(2):377–390. [DOI] [PubMed] [Google Scholar]
- 34.Atassi B, Bangash AK, Bahrani A, et al. Multimodality imaging following 90Y radioembolization: a comprehensive review and pictorial essay. RadioGraphics 2008;28(1):81–99. [DOI] [PubMed] [Google Scholar]
- 35.Tournigand C, André T, Achille E, et al. FOLFIRI followed by FOLFOX6 or the reverse sequence in advanced colorectal cancer: a randomized GERCOR study. J Clin Oncol 2004;22(2):229–237. [DOI] [PubMed] [Google Scholar]
- 36.Catenacci DV, Kozloff M, Kindler HL, Polite B. Personalized colon cancer care in 2010. Semin Oncol 2011;38(2):284–308. [DOI] [PMC free article] [PubMed] [Google Scholar]
- 37.Chibaudel B, Maindrault-Goebel F, Lledo G, et al. Can chemotherapy be discontinued in unresectable metastatic colorectal cancer? the GERCOR OPTIMOX2 Study. J Clin Oncol 2009;27(34):5727–5733. [DOI] [PubMed] [Google Scholar]
- 38.Tournigand C, Cervantes A, Figer A, et al. OPTIMOX1: a randomized study of FOLFOX4 or FOLFOX7 with oxaliplatin in a stop-and-go fashion in advanced colorectal cancer—a GERCOR study. J Clin Oncol 2006;24(3):394–400. [DOI] [PubMed] [Google Scholar]
- 39.Arnold D, Andre T, Bennouna J, et al. Bevacizumab (BEV) plus chemotherapy (CT) continued beyond first progression in patients with metastatic colorectal cancer (mCRC) previously treated with BEV plus CT: results of a randomized phase III intergroup study (TML study). ASCO Meeting Abstracts 2012;30(15 suppl):CRA3503. Available at: http://meetinglibrary.asco.org/content/97866-114. [Google Scholar]
- 40.Van Cutsem E, Sobrero AF, Siena S, et al. Phase III CORRECT trial of regorafenib in metastatic colorectal cancer (mCRC). J Clin Oncol 2012;30:3502. Available at: http://meetinglibrary.asco.org/content/94460-114. [Google Scholar]
- 41.Nishino M, Jagannathan JP, Ramaiya NH, Van den Abbeele AD. Revised RECIST guideline version 1.1: what oncologists want to know and what radiologists need to know. AJR Am J Roentgenol 2010;195(2):281–289. [DOI] [PubMed] [Google Scholar]
- 42.Nishino M, Jagannathan JP, Krajewski KM, et al. Personalized tumor response assessment in the era of molecular medicine: cancer-specific and therapy-specific response criteria to complement pitfalls of RECIST. AJR Am J Roentgenol 2012;198(4):737–745. [DOI] [PMC free article] [PubMed] [Google Scholar]
- 43.Choi H, Charnsangavej C, Faria SC, et al. Correlation of computed tomography and positron emission tomography in patients with metastatic gastrointestinal stromal tumor treated at a single institution with imatinib mesylate: proposal of new computed tomography response criteria. J Clin Oncol 2007;25(13): 1753–1759. [DOI] [PubMed] [Google Scholar]
- 44.Smith AD, Shah SN, Rini BI, Lieber ML, Remer EM. Morphology, attenuation, size, and structure (MASS) criteria: assessing response and predicting clinical outcome in metastatic renal cell carcinoma on antiangiogenic targeted therapy. AJR Am J Roentgenol 2010;194(6):1470–1478. [DOI] [PubMed] [Google Scholar]
- 45.Smith AD, Lieber ML, Shah SN. Assessing tumor response and detecting recurrence in metastatic renal cell carcinoma on targeted therapy: importance of size and attenuation on contrast-enhanced CT. AJR Am J Roentgenol 2010;194(1):157–165. [DOI] [PubMed] [Google Scholar]
- 46.Rubbia-Brandt L, Giostra E, Brezault C, et al. Importance of histological tumor response assessment in predicting the outcome in patients with colorectal liver metastases treated with neo-adjuvant chemotherapy followed by liver surgery. Ann Oncol 2007;18(2): 299–304. [DOI] [PubMed] [Google Scholar]
- 47.Chung WS, Park MS, Shin SJ, et al. Response evaluation in patients with colorectal liver metastases: RECIST version 1.1 versus modified CT criteria. AJR Am J Roentgenol 2012;199(4):809–815. [DOI] [PubMed] [Google Scholar]
- 48.Anzidei M, Napoli A, Zaccagna F, et al. Liver metastases from colorectal cancer treated with conventional and antiangiogenetic chemotherapy: evaluation with liver computed tomography perfusion and magnetic resonance diffusion-weighted imaging. J Comput Assist Tomogr 2011;35(6):690–696. [DOI] [PubMed] [Google Scholar]
- 49.Meijerink MR, van Waesberghe JH, van Schaik C, et al. Perfusion CT and US of colorectal cancer liver metastases: a correlative study of two dynamic imaging modalities. Ultrasound Med Biol 2010;36(10):1626–1636. [DOI] [PubMed] [Google Scholar]
- 50.Shinagare AB, Jagannathan JP, Krajewski KM, Ramaiya NH. Liver metastases in the era of molecular targeted therapy: new faces of treatment response. AJR Am J Roentgenol 2013;201(1):W15–W28. [DOI] [PubMed] [Google Scholar]
- 51.Chikarmane SA, Khurana B, Krajewski KM, et al. What the emergency radiologist needs to know about treatment-related complications from conventional chemotherapy and newer molecular targeted agents. Emerg Radiol 2012;19(6):535–546. [DOI] [PubMed] [Google Scholar]
- 52.O’Connor JP, Rose CJ, Jackson A, et al. DCE-MRI biomarkers of tumour heterogeneity predict CRC liver metastasis shrinkage following bevacizumab and FOLFOX-6. Br J Cancer 2011;105(1):139–145. [DOI] [PMC free article] [PubMed] [Google Scholar]
- 53.De Bruyne S, Van Damme N, Smeets P, et al. Value of DCE-MRI and FDG-PET/CT in the prediction of response to preoperative chemotherapy with bevacizumab for colorectal liver metastases. Br J Cancer 2012;106(12):1926–1933. [DOI] [PMC free article] [PubMed] [Google Scholar]
- 54.Heijmen L, Ter Voert EE, Nagtegaal ID, et al. Diffusion-weighted MR imaging in liver metastases of colorectal cancer: reproducibility and biological validation. Eur Radiol 2013;23(3):748–756. [DOI] [PubMed] [Google Scholar]
- 55.Li Z, Bonekamp S, Halappa VG, et al. Islet cell liver metastases: assessment of volumetric early response with functional MR imaging after transarterial chemoembolization. Radiology 2012;264(1):97–109. [DOI] [PubMed] [Google Scholar]
- 56.Cleary JM, Tanabe KT, Lauwers GY, Zhu AX. Hepatic toxicities associated with the use of preoperative systemic therapy in patients with metastatic colorectal adenocarcinoma to the liver. Oncologist 2009;14(11):1095–1105. [DOI] [PubMed] [Google Scholar]
- 57.Torrisi JM, Schwartz LH, Gollub MJ, Ginsberg MS, Bosl GJ, Hricak H. CT findings of chemotherapy-induced toxicity: what radiologists need to know about the clinical and radiologic manifestations of chemotherapy toxicity. Radiology 2011;258(1):41–56. [DOI] [PubMed] [Google Scholar]
- 58.Tirumani SH, Baez JC, Jagannathan JP, Shinagare AB, Ramaiya NH. Tumor-bowel fistula: what radiologists should know. Abdom Imaging 2013;38(5):1014–1023. [DOI] [PubMed] [Google Scholar]
- 59.Shinagare AB, Howard SA, Krajewski KM, Zukotynski KA, Jagannathan JP, Ramaiya NH. Pneumatosis intestinalis and bowel perforation associated with molecular targeted therapy: an emerging problem and the role of radiologists in its management. AJR Am J Roentgenol 2012;199(6):1259–1265. [DOI] [PubMed] [Google Scholar]
- 60.Thornton E, Howard SA, Jagannathan J, et al. Imaging features of bowel toxicities in the setting of molecular targeted therapies in cancer patients. Br J Radiol 2012;85(1018):1420–1426. [DOI] [PMC free article] [PubMed] [Google Scholar]
- 61.Howard SA, Krajewski KM, Thornton E, et al. Decade of molecular targeted therapy: abdominal manifestations of drug toxicities—what radiologists should know. AJR Am J Roentgenol 2012;199(1):58–64. [DOI] [PubMed] [Google Scholar]
- 62.Package insert . ERBITUX (cetuximab). Branchburg, NJ: Imclone Systems Incorporated Web site. http://www.accessdata.fda.gov/drugsatfda_docs/label/2012/125084s225lbl.pdf. Accessed April 5, 2013. [Google Scholar]
- 63.Package insert . Vectibix (panitumumab). Thousand Oaks, Calif: Amgen Incorporated Web site. http://www.accessdata.fda.gov/drugsatfda_docs/label/2012/125147s0148lbl.pdf. Accessed Apr 5, 2013. [Google Scholar]
- 64.Hoag JB, Azizi A, Doherty TJ, Lu J, Willis RE, Lund ME. Association of cetuximab with adverse pulmonary events in cancer patients: a comprehensive review. J Exp Clin Cancer Res 2009;28:113. [DOI] [PMC free article] [PubMed] [Google Scholar]
- 65.Bertot LC, Sato M, Tateishi R, Yoshida H, Koike K. Mortality and complication rates of percutaneous ablative techniques for the treatment of liver tumors: a systematic review. Eur Radiol 2011;21(12):2584–2596. [DOI] [PubMed] [Google Scholar]