Abstract
Magnetic Resonance images (MRI) have superior soft tissue contrast compared with CT images. Therefore, MRI might be a better imaging modality to differentiate the prostate from surrounding normal organs. Methods to accurately register MRI to simulation CT images are essential, as we transition the use of MRI into the routine clinic setting. In this study, we present a finite element method (FEM) to improve the performance of a commercially available, B-spline-based registration algorithm in the prostate region. Specifically, prostate contours were delineated independently on ten MRI and CT images using the Eclipse treatment planning system. Each pair of MRI and CT images was registered with the B-spline-based algorithm implemented in the VelocityAI system. A bounding box that contains the prostate volume in the CT image was selected and partitioned into a tetrahedral mesh. An adaptive finite element method was then developed to adjust the displacement vector fields (DVFs) of the B-spline-based registrations within the box. The B-spline and FEM-based registrations were evaluated based on the variations of prostate volume and tumor centroid, the unbalanced energy of the generated DVFs, and the clarity of the reconstructed anatomical structures. The results showed that the volumes of the prostate contours warped with the B-spline-based DVFs changed 10.2% on average, relative to the volumes of the prostate contours on the original MR images. This discrepancy was reduced to 1.5% for the FEM-based DVFs. The average unbalanced energy was 2.65 and 0.38 mJ/cm3, and the prostate centroid deviation was 0.37 and 0.28 cm, for the B-spline and FEM-based registrations, respectively. Different from the B-spline-warped MR images, the FEM-warped MR images have clear boundaries between prostates and bladders, and their internal prostatic structures are consistent with those of the original MR images. In summary, the developed adaptive FEM method preserves the prostate volume during the transformation between the MR and CT images and improves the accuracy of the B-spline registrations in the prostate region. The approach will be valuable for development of high-quality MRI-guided radiation therapy.
Keywords: MRI-guided Radiotherapy, Prostate Cancer, MR-CT Image Registration, Adaptive Finite Element Method
1. Introduction
Intensity-modulated radiation therapy (IMRT) allows dose-escalated radiation treatment to be delivered to tumor targets, while sparing surrounding normal tissues. The quality of an IMRT plan will depend mainly on the accuracy of target delineation. High accuracy contouring might help create better quality treatment plans, with potentially reduced treatment margins, and consequently decreased irradiation of healthy tissues. On prostate patient CT images, however, it is often difficult to identify prostate boundaries, especially the interface between the prostate, bladder and rectum. Magnetic Resonance imaging (MRI), on the other hand, has superior soft tissue contrast relative to CT, and consequently can help improve the accuracy of target delineation for radiation therapy. The limitation of MRI is that it does not have the necessary physical information such as electron density information for dose calculation and plan optimization. One approach to address this issue is to assign electron density values to different bones and tissues, but this approach requires careful segmentation of individual organs (Lambert et al., 2011). In addition, geometric distortion in MRI remains to be addressed (Wang et al., 2004). Until more accurate and general approaches are developed for dose calculation using MR images, it is necessary to include CT images to provide electron density information and to allow accurate delineation of bony structures and other organs for treatment planning. To take advantage of the improved soft tissue contrast with MRI, prostate contours drawn on MR images are often transferred to CT images for treatment planning. This process requires accurate image registrations between MRI and CT images (Sannazzari et al., 2002).
Several methods have been developed for MRI to CT image registration. For example, Schallenkamp et al (Schallenkamp et al., 2005) inserted gold markers into the prostate, which appear on both the MRI and CT images so that prostate motion can be accurately tracked. Amdur et al (Amdur et al., 1999) and Polo et al (Polo et al., 2004) registered MRI and CT images based on the structures of urethra and bladder base and permanent seeds. Recently, Korsager et al (Korsager et al., 2013) used a Ni-Ti prostate stent to align the MRI and CT images of prostates. Dean et al (Dean et al., 2012) evaluated four rigid registrations based on a bony pelvis alignment manually adjusted by the consensus of a group of expert physicians and physicists. To cope with organ deformation, Christensen et al (Christensen et al.) used a fluid landmark method to register MRI to CT images to track radiation dose variations in cervix brachytherapy patients; Lian et al (Lian et al., 2004) applied a thin-plate spline based algorithm to register prostate MRI and CT images, based on landmarks identified on both images. Schreibmann and Xing (Schreibmann and Xing, 2005) calculated the normalized correlation in a narrow band to improve the efficiency of the MRI and CT registrations, and later extended the narrow band to auto-selected volumes and used a maximized mutual information metric to guide free-form deformations (Schreibmann and Xing, 2006). These algorithms have addressed many clinical questions. However, due to the absence of a clear boundary in prostate CT images, deformable image registration (DIR) algorithms may fail at edges or boundary regions (Pluim et al., 2003), so a reliable DIR algorithm, especially in the prostate region, will be beneficial for MRI-guided radiotherapy.
Among the commercially available options are B-spline-based algorithms, in which the underlying B-spline coefficients are optimized by maximizing the mutual information shared by the MRI and CT images. Unlike MRI, CT images lack detailed information of the four anatomic zones inside the prostate gland, and the prostate volume in the CT images appears larger than in MRI (Villeirs et al., 2005). It has been reported that the mean prostate volume is 30% larger when defined by non-contrast CT compared to MRI (Sannazzari et al., 2002; Tanaka et al., 2011; Roach et al., 1996). Along the anterior-posterior and superior-inferior direction, the prostate volume was 5 mm larger, on average with CT than with MRI (Sannazzari et al., 2002). The areas of non-agreement tended to occur in the apex and posterior portion of the prostate as well as regions corresponding to the neurovascular bundle. The discrepancy in volume appears to result primarily from inadequate resolution of soft tissue plains between the rectum and levator ani-muscles and prostate posteriorly (Roach et al., 1996). If a registration exactly matches the prostate volume on MRI to that on CT, the advantage of MRI over CT in prostate contouring is lost, and part of the prostate volume could be mis-registered. In this case, prostate boundary information may misguide, rather than help, image intensity-based deformable registrations.
In this study, we developed an adaptive finite element method (FEM) to improve the performance of MR-CT registrations in prostate regions, and applied this method to ten prostate cancer patients treated at our institution where MR images were acquired after each patient’s CT treatment simulation scan. Due to the incompressibility of soft tissue, the prostate volume remains approximately constant between the two image datasets. An accurate deformable registration algorithm should preserve the volume. This allows the prostate volume to be used as a criterion to evaluate the performance of image registration algorithms performed in prostate regions. The performance of the FEM method was also compared to that of an intensity-based image registration algorithm based on the clarity of the warped prostate structures, changes in the centroid of prostate contours under the registrations, and unbalanced energy of the resultant registration displacements.
2. Methods and Materials
2.1 Initial registration of MRI and CT images
Ten prostate cancer patients were selected under approval from our institutional review board (IRB). Based on a clinical treatment protocol, each of these patients was scanned first by CT (Brilliance Big Bore, Philips), and then followed by MRI (The Panorama 1.0 T open MR, Philips). The CT image slices are of dimension 512×512 at the resolution of approximately 1 mm. 3D T2-weighted turbo spin echo MR images (TR/TE = 2341/80 ms) with a FOV = 190 mm (right-left), 233 mm (ant-post), and 164 mm (foot-head) were also acquired. The MRI images have a similar voxel dimension, but a higher resolution (≈ 0.66× 0.66 × 3.0 mm3), so the physical domain covered by the MRI image is smaller than that of the CT. The contours of all the region-of-interests (ROIs) including prostate were delineated on the CT images, using the Eclipse treatment planning system (TPS, Varian Medical Systems, Palo Alto CA). The prostate and normal organs were delineated also on the MRI. The contours and their associated images were exported into VelocityAI (Velocity Medical Solutions, Atlanta, GA) and an in-house TPS (Hertz), developed for adaptive treatment planning.
The navigator module in VelocityAI was used for deformable registration of the MR and CT images. Registration was performed from MRI to CT images. The module consists of manual alignment, selection of a region of interest, and rigid and B-spline-based deformable registrations. Mutual information (MI) is the similarity metric used in VelocityAI for the B-spline-based registration. The B-spline-generated displacement vector fields (DVF’s) were exported into Hertz for adaptive FEM registration and analysis.
2.2 Development of an adaptive deformable registration method
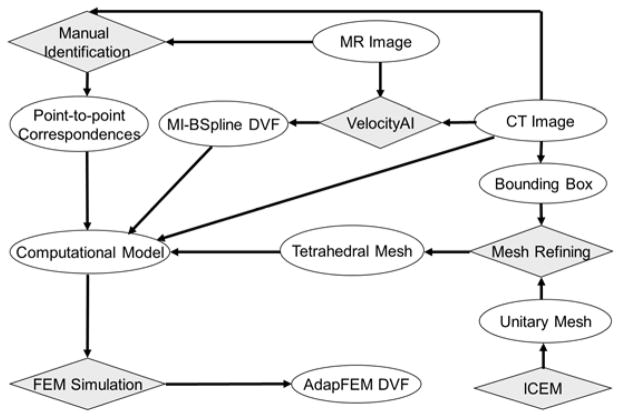
Prostate contours were converted into bit-map masks for each patient within the Hertz TPS. Around the center of the mask, a bounding box (of length between 10~15 cm) was defined within the shared CT and MRI domains. The surfaces of the box correspond to regions which have relatively high contrast in the CT image. A unitary cube was partitioned by ICEM (Ansys Inc., Canonsburg, PA) to generate a prototype tetrahedral mesh that consists of 72,500 tetrahedra and 13,500 nodes. The tetrahedral mesh was aligned to the coordinate system of the CT image, scaled to match the size of the bounding box, and then refined with the method described by Zhong et al (Zhong et al., 2012). A finite element model was developed with constraints on the boundary of the bounding box assigned from the DVF generated by the B-spline-based registrations. Point correspondences between the MRI and CT images identified within the bounding box could be used as additional boundary constraints to regulate the deformation model. In this study, we mainly used the displacements of the B-Spline-based registrations on the surface of the bounding box to drive the FEM model, and also gave an example to show that landmarks can be incorporated into the FEM computational model as additional constraints to improve the FEM accuracy. The workflow of this program is illustrated in Fig 1.
Figure 1.
The workflow of the MR-CT image registration program.
Using a formulation procedure similar to that of Zhong et al. (Zhong et al., 2005), the algebraic equations of the FEM model can be constructed at each of the tetrahedral nodes:
| (1) |
where K is the global matrix consisting of the stiffness entry gi,j defined between nodes i and j, d1,…,dk are the displacements of the nodes located at the boundary of the bounding box or the selected landmarks, and dk+1,…,dn are the displacements of free nodes in the mesh. The values of di for i=1,…,k were assigned from the displacement vectors of the B-spline registrations and the measured distance of landmarks. Within the bounding box, air and bony structures were separated from soft tissue based on their CT image intensities, and tetrahedral elements located in these structures were assigned with Young’s moduli of 1 MPa for bone and 1 kPa for soft tissue (Sarvazyan et al.). The Poisson ratio was assumed to be 0.3 for rectal gas and 0.49 for the prostate and normal tissue (Greenleaf et al., 2003). Note that there is no any artificial image force assumed in Eq. (1). This is different from the elastic body spline (EBS) implemented in Elastix (Klein et al., 2010) which assumes an artificial smooth force for the Navier equilibrium equation (Davis et al., 1997).
In this study, we used 13,500 tetrahedral nodes, and solved Eq. (1) using a conjugated gradient method. Two look-up tables were created to connect tetrahedrons and nodes to their correspondent image voxels. The computational time for solving these equations is less than 20 seconds, but the total time for the adaptive FEM correction including the pre and post-processing of the image and DVF data is up to 1.5 minutes. FEM displacements at each of the tetrahedral nodes were interpolated to image voxels within the bounding box. Since the FEM DVF is smooth in the interior of the box, and equivalent to the B-spline-computed displacements at the boundary of the box, replacing the B-spline-computed displacements with those from the FEM is unlikely to compromise the continuity of the original deformation field. However, at the boundary regions, corrections due to mis-configured constraints might be significant.
2.3 Methods for evaluation of the two registration algorithms
As prostate volumes in MR images usually are smaller than those in CT images, contour comparison between the warped MR and CT images is no longer an objective method for DIR evaluation. It is especially difficult to evaluate cross-modality image registrations. In this study, we will compare the B-spline and the FEM-based registrations using different physical and mechanical metrics.
Since the mass of the prostate does not change between the MRI and CT datasets due to the incompressibility of soft tissue, the change of the prostate volumes between the MRI and the warped MRI was used as an evaluation metric of the deformable image registration. With the masks of prostate contours generated from the CT and MRI datasets, the difference between the centroids of the CT mask and the warped MRI mask was also used to measure the accuracy of the registration. For patients with calcifications in their prostate region, these calcifications were taken as additional landmarks for registration assessments. Finally, as registration errors may cause high unbalanced energy (UE), UE values were computed and used as another metric for evaluation of registration accuracy. Details of the unbalanced energy method were described previously by Zhong et al. (Zhong et al., 2007; Li et al., 2013).
To evaluate prostate volume variations, a prostate mask was generated from prostate contours delineated on each patient’s MR image, and then warped by the registration DVFs. To improve the resolution of the mask warping, each image voxel on the CT image was divided into 10×10×10 subvoxels. The value of each subvoxel was assigned from the MRI mask, and accumulated over all the subvoxels to derive the total volume of the warped prostate. The subvoxel-based summation will minimize errors induced by the volume reconstruction process, such that the difference of the prostate volumes between the warped mask and the original mask are due only to errors in the registration DVF.
3. Results
3.1 Results of the B-spline and adaptive FEM-based registrations
For the ten patients, their prostate volumes were delineated on both MRI and CT images using the Eclipse TPS. Prostate volumes measured on MRI datasets were 22% smaller than those in the corresponding CT images. Registrations were performed from MRI to CT images using the B-spline-based algorithm in the VelocityAI system. As an illustration, the reference CT (Fig 2a) and MR (Fig 2b) images of patient 1 were registered using the B-spline-based algorithm, and the resultant DVF was used to produce the warped MR image shown in Fig 2c. Compared to Fig 2b, it was found that soft tissue contrasts were reduced in Fig 2c, especially at the posterior aspect of the prostate, and at the prostate-rectum interface.
Figure 2.
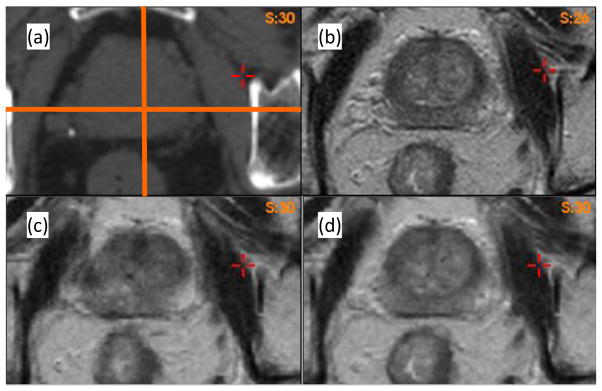
Axial images of Patient 1: (a) CT image, (b) MR image. The warped MRI datasets using (c) the B-spline-based DVF and (d) the adaptive FEM DVF.
To identify the cause of the poor image reconstruction, the B-spline-based DVF was analyzed along the lines demarcated in Fig 2(a). The displacement profiles along the lines for the B-spline and FEM-based registrations are shown in Fig 3. The B-spline-based displacements show large variations in the prostate region (Fig 3a and 3b). These variations caused the image values of Fig 2c to be reconstructed from largely dispersed locations in the MR image, resulting in the loss of soft tissue contrast noted in Fig 2c. This problem was corrected by the adaptive FEM-based DVF. The boundary and internal structures of the prostate in the FEM-reconstructed MR image (Fig 2d) are clearer than those shown in Fig 2c.
Figure 3.
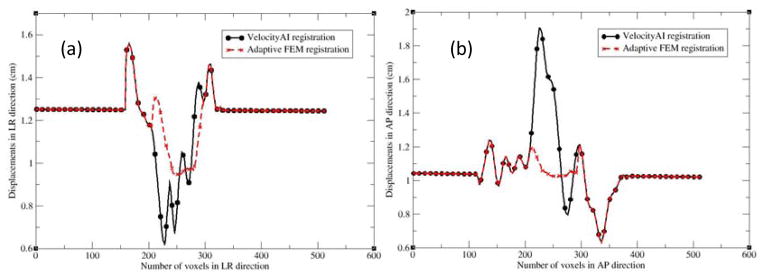
The profiles along the lines demarcated in Fig. 2(a): (a) left to right and (b) anterior to posterior. LR and AP represent the left-right and anterior-posterior directions, respectively.
3.2 Registration error-induced changes in prostate volume
The MR images were warped using the B-spline and FEM-based DVFs, respectively. The warped prostate volumes were compared to those on the original MR images. The percentage differences of these volumes for the ten patients were reported in Table 1. The average of the differences was 10.2±6.3% when the B-spline-based DVFs were used, whereas it was 1.5±1.4% for the FEM-based DVFs.
Table 1.
The percentage difference in prostate volume between the warped MR image and the original MR image was calculated for the ten MR-CT registrations.
| (%) | P1 | P2 | P3 | P4 | P5 | P6 | P7 | P8 | P9 | P10 | Aver±Stdev |
|---|---|---|---|---|---|---|---|---|---|---|---|
| VelocityAI | 13.5 | 22.5 | 8.4 | 7.1 | 15.0 | 3.8 | 14.6 | 8.7 | 6.6 | 1.5 | 10.2±6.3 |
| AdapFEM | 3.4 | 1.3 | 4.1 | 0.2 | 0.7 | 2.9 | 0.3 | 0.9 | 0.4 | 0.5 | 1.5±1.4 |
For patient 2, the prostate volume in the B-spline reconstructed MR image dataset (Fig 4b) did not match that in the CT dataset (Fig 4a). This registration error was corrected by the adaptive FEM method as shown in Fig 4c. To quantify the volume change, a prostate mask (Fig 4d) was segmented on the MR image, and warped using the two DVFs. The volume of the warped prostate mask increased 22.5% and 1.3% for the B-spline-based (Fig 4e) and adaptive FEM-based (Fig 4f) registrations, respectively.
Figure 4.
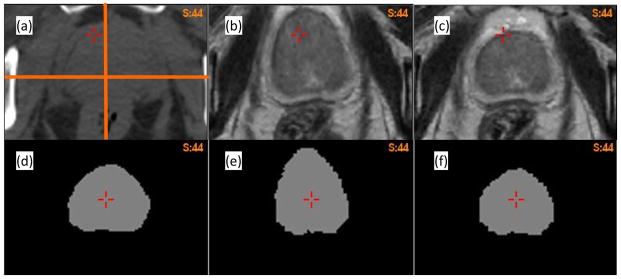
(a) Axial CT image of patient 2; (b) and (c) the warped MR images using the B-spline-based and adaptive FEM-based DVFs, respectively; (d) the prostate mask segmented on the MR image; (e) and (f) the corresponding masks warped by the B-spline-based and FEM-based DVFs, respectively.
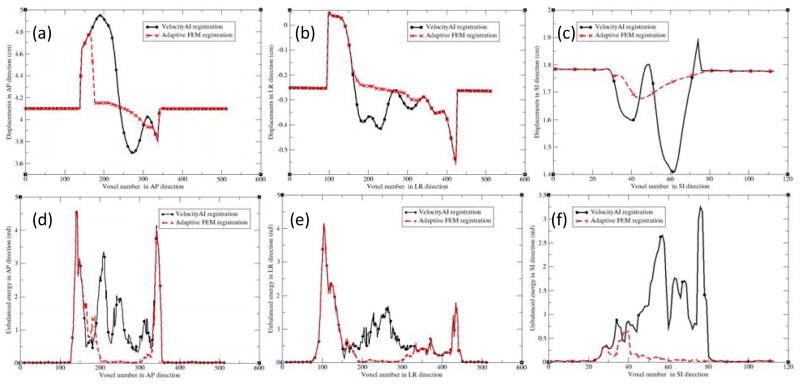
Figures 5(a), (b) and (c) show the profiles of the registration displacements along the lines across the prostate in Fig 4(a) for patient 2 in the anterior-posterior (AP), left-right (LR) and superior-inferior (SI) directions, respectively. Recall that in the VelocityAI registration module, a rigid registration was performed first, and followed by a B-spline-based deformable registration performed in a region of interest. It can be observed that the B-spline-based DVF is discontinuous at voxels 140 and 350 in Fig 5a, and at voxels 100 and 420 in Fig 5b. These voxels are corresponding to the boundary of the region selected for DIR. For the FEM algorithm, a smaller region was selected between voxels 160 and 320 in Fig 5a, and voxels 150 and 320 in Fig 5b. In this region, the displacement uncertainty was largely reduced for the FEM-based registration, as demonstrated in Fig 5a and 5c. The largest difference between the two DVFs was 0.8 cm in the AP direction, which lead to the large changes in the prostate volumes, as shown Fig 4d and 4e.
Figure 5.
The profiles along the demarcated lines (Fig 4a) for patient 2 in the directions: (a) AP, (b) LR, and (c) SI; AP, LR and SI represent the anterior-posterior, left-right, and superior-inferior directions, respectively. (d–f) are the corresponding unbalanced energy (UE) values for Fig 4(a–c).
The centroids of the prostate gland on the warped MR images computed using the B-spline-based and FEM-based DVFs and the original CT images were calculated for each patient. Mean differences were 0.37 (max. = 0.7) and 0.28 (max. =0.47) cm for the B-spline-based and adaptive FEM-based DVFs, respectively. The computed results for all the patients are listed in Table 2.
Table 2.
The distance between the centroids of the prostate volumes on the CT images and the warped MR images was calculated for the ten patients.
| (cm) | P1 | P2 | P3 | P4 | P5 | P6 | P7 | P8 | P9 | P10 | Aver±Stdev |
|---|---|---|---|---|---|---|---|---|---|---|---|
| VelocityAI | 0.47 | 0.28 | 0.27 | 0.17 | 0.52 | 0.60 | 0.14 | 0.32 | 0.7 | 0.22 | 0.37±0.19 |
| adapFEM | 0.47 | 0.23 | 0.26 | 0.15 | 0.16 | 0.44 | 0.28 | 0.26 | 0.40 | 0.23 | 0.28±0.11 |
3.3 Registration error-induced unbalanced energy
In addition to the prostate volume and centroid comparisons, unbalanced energy was also calculated for these registrations. As shown in Fig 5, for the B-spline-based DVF, the discontinuity at voxels 140 and 350 in Fig 5a results in the large UE values around these voxels (Fig 5d). The same is true for Fig 5b with the corresponding UE values shown in Fig 5e. While Fig 5c does not have sharp discontinuities, the significant variation of displacements still results in large UE values, as shown in Fig 5f. In contrast, these UE values were dramatically reduced for the adaptive FEM registration, as shown in Fig 5(d–f). Using the DVFs generated by the B-spline-based and adaptive FEM-based registrations, UE was calculated and averaged in the prostate volumes for the ten patients, and reported in Table 3. The UE values for the B-spline-based and FEM-based registrations are 2.65±1.32 and 0.38±0.24 mJ/cm3, respectively.
Table 3.
Unbalanced energy was calculated for the B-spline-based VelocityAI registrations and the adaptive FEM-based registrations.
| (mJ/cm3) | P1 | P2 | P3 | P4 | P5 | P6 | P7 | P8 | P9 | P10 | Aver±Stdev |
|---|---|---|---|---|---|---|---|---|---|---|---|
| VelocityAI | 1.67 | 2.15 | 5.19 | 2.3 | 4.42 | 1.45 | 2.49 | 3.64 | 1.56 | 1.63 | 2.65±1.32 |
| AdapFEM | 0.26 | 0.09 | 0.34 | 0.36 | 0.56 | 0.30 | 0.91 | 0.24 | 0.21 | 0.58 | 0.38±0.24 |
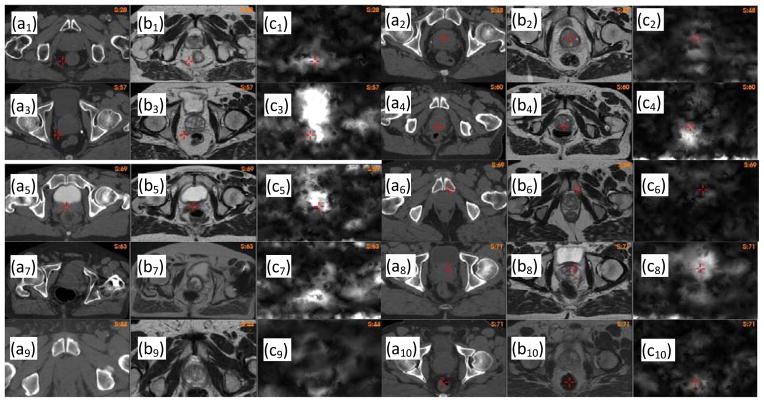
In general, high UE values indicate regions of large registration errors. In Fig 6, (ai) is the CT image of patient i, (bi) the warped MR image using the B-spline-based registration, and (ci) the UE image of this registration. By the visual comparison between the CT and the warped MR images, it can be found that regions with high UE values are corresponding to large registration errors.
Figure 6.
Unbalanced energy calculated for patient i, i=1,…,10: (ai) the CT image, (bi) the warped MR image with the B-spline-based DVF, (ci) the unbalanced energy of the B-spline-based DVF.
3.4 Deformable image registrations for organs with volume changes
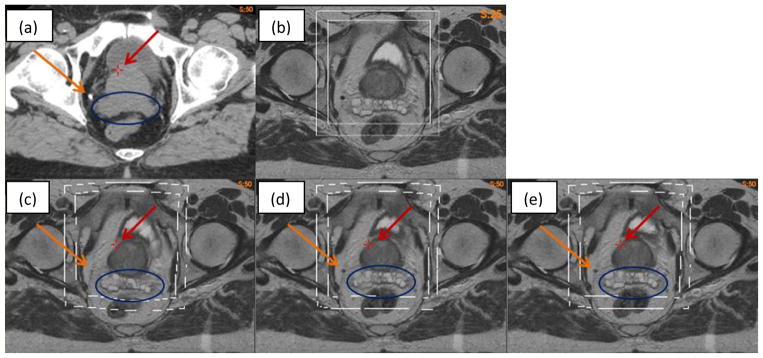
Deformable image registration of the prostate volumes can be compromised by volumetic changes experienced by surrounding organs. As shown in Fig 7, the rectum volumes are different between the MR (Fig 7a) and CT (Fig 7b) images. The VelocityAI registration reduced the rectum volume in the MR image to match the target rectum in the CT image, but the prostate volume was increased (Fig 7c). Using a bounding box around the prostate, the FEM algorithm corrected the VelocityAI-enlarged prostate volume and, at the same time, kept the desired volume reduction in the rectum as achieved by the VelocityAI algorithm (Fig 7d). For comparison, the MR and CT images were also registered using the open-source, Elastix, program (Klein et al., 2010), where a four-resolution B-Spline registration algorithm was configured with the optimizer StandardGradientDescent and the similarity metric AdvancedMattesMutualInformation. The result shows that the performance of the Elastix registration in the rectum region is worse than that of the VelocityAI registration. While the prostate volume was preserved with Elastix, the rectum volume was not, resulting in a significant anterior shift in the entire prostate gland.
Figure 7.
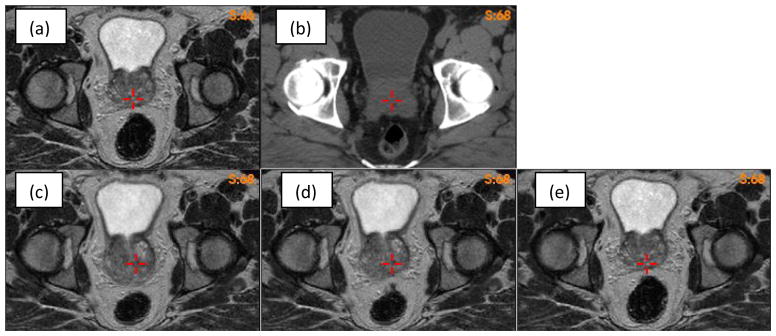
(a)(b) MR and CT images with different rectum volumes; (c)(d)(e) the MR image warped by the Velocity, FEM and elastix DVFs, respectively.
Different from the prostate, the rectum has its volume changed largely between CT and MRI. To make a deformable registration work for both the prostate and rectum, the B-Spline registration algorithms may require different constraints to be assigned to individual organs. Consequently finding optimal parameters for each of these organs is difficult (kim et al., 2013). The proposed adaptive method, which uses the less regulated B-Spline algorithm in VelocityAI to deformably align most of these organs, and then uses the FEM to make corrections in the prostate region, will likely provide an alternative solution to this issue.
3.5 Impact of landmark and boundary constraints on FEM simulation results
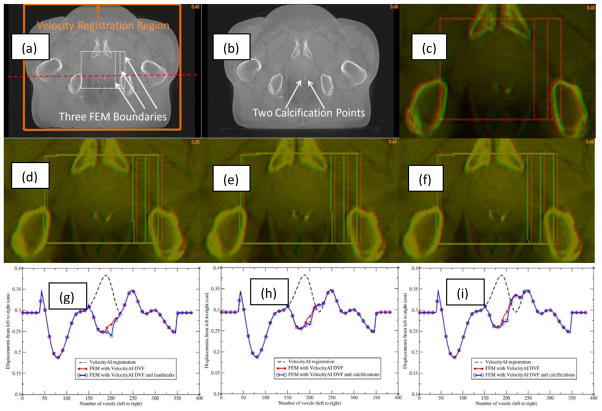
The impact of landmark and boundary constraints on the FEM simulations was evaluated with a pair of prostate CBCT images which have two calcification points in the prostate. The calcification points were 2.4 mm apart laterally between the two images (Fig 8c). A B-spline-based VelocityAI registration was performed from the moving image (Fig 8b) to the reference image (Fig 8a). This registration produced lateral displacements of 3.8 mm at the calcification points, resulting in a 1.4 mm over-correction at these points (Fig 8d). A small bounding box around the prostate was selected from voxel 150 to voxel 220 in both the left-right and anterior-posterior directions (Fig 8a). The right surface of this box was extended from voxel 220 to voxels 230 and 240, respectively, to form a middle box and a large box. The corresponding B-Spline-generated displacements were assigned to the surface of each box to evaluate the impact of different boundary constraints on FEM simulations. The resultant DVFs, namely FEM-DVFsmall, FEM-DVFmiddle, and FEM-DVFlarge for the three bounding boxes, respectively, all have ~2.7 mm lateral displacements at the calcification points. The moving images warped by the FEM-DVFsmall and FEM-DVFlarge, respectively, were overlaid on the reference image, showing a good agreement at the calcification points (Fig 8e and 8f). The displacement profiles corresponding to the dashed line across a calcification point in Fig 8a were displayed in Fig 8(g–i). The bounding boxes were marked with 1000 (HU) in the reference image and the warped moving images after the B-Spline and FEM-based registrations were finished.
Figure 8.
(a) Reference image with three bounding boxes marked; (b) moving image; (c) reference (red) and moving (green) images overlaid before registration; (d) reference image (red) and moving image (green) overlaid after the B-spline-based VelocityAI registration; (e) and (f) reference image (red) and moving image (green) overlaid after registration with the FEM-DVFsmall and FEM-DVFlarge, respectively; The profiles of the B-spline-based DVF, FEM DVF and calcification point-enhanced FEM DVF along the red horizontal line marked in (a) were illustrated in (g), (h) and (i) which correspond to the small, middle and large bounding boxes, respectively.
The results of the FEM simulation could be impacted by the location of the bounding box. As mentioned above, the right surfaces of the three bounding boxes are at voxels 220, 230 and 240, respectively, where the lateral displacements of the B-Spline-based DVF are 2.9, 3.1 and 3.4 mm which were assigned to their corresponding FEM nodes. The profiles of the resultant DVFs are shown in Fig 8(g–i). The different boundary constraints changed the FEM-computed displacements at the voxels mainly located at the boundaries of the bounding boxes. For the large box, differences in voxel displacements due to the shifted boundary occurred primarily in the vicinity of the bone tissue. In the region of the calcification points, the displacements quickly dropped from 3.4 mm to 2.7 mm. In comparison to the thousands of boundary nodes, the two calcification points only slightly influenced the FEM simulations in the vicility of these points.
The hybrid registration algorithm was further evaluated with a pair of CT (Fig 9a) and MR (Fig 9b) images which have one calcification point (~5 mm in diameter) outside the prostate, as denoted by the yellow arrow in Fig 9a. The MR image was registered to the CT using the B-spline based VelocityAI algorithm. The resultant DVF was corrected by the adaptive FEM with two bounding boxes. As the bounding boxes were defined in the shared MRI and CT domain, they could be visualized in the original MRI (Fig 9b) and three warped MR images (Fig 9c–e).
Figure 9.
(a) CT image; (b) MR image; (c) warped MR image with VelocityAI DVF; (d) and (e) warped MR image with FEM corrected DVF on the large and small boxes, respectively.
The MR images warped with the B-spline and adaptive FEM-based DVFs are shown in Fig 9(c–e). A cross point marked on the three warped images (Fig 9c–e) have the same coordinates as that of the prostate boundary in Fig 9a. It is noted that this point remains almost constant at the prostate boundary in the FEM-warped images, but is off approximately 5 mm in the B-spline-warped image (Fig 9c). Also the calcification point is shown clearly on the FEM-warped images (Fig 9d and 9e), but barely can be seen in Fig 9c, suggesting that the B-spline-based registration is less accurate than the FEM at this point. Furthermore, the seminal vesicles are distorted in the B-spline-based registration (Fig 9c), and this distortion is corrected by the FEM method as shown in Fig 9d and 9e. Note that the prostate and seminal vesicles in Figs 9d and 9e are nearly identical. This indicates that the impact of different bounding boxes on the FEM computed results is small.
4. Discussion
In conventional external beam radiotherapy, it is difficult to delineate prostate contours due to low CT image gradients in regions between prostate and other organs such as the bladder or rectum. On the other hand, MR imaging has a superior soft tissue contrast that may help differentiate tumor boundaries from surrounding healthy tissue. As deformable image registration techniques get improved, contours delineated on MR images can be mapped accurately to their corresponding CT datasets which could be subsequently used to develop high quality treatment plans. For cross-modality deformable registrations, mutual information and B-spline-based algorithms are often used. Due to different physics properties being represented, the MR and CT images may not have sufficient mutual information to share in regions such as the boundaries between prostate and bladder (Pluim et al., 2003). Also low CT image gradients make the B-spline algorithms difficult to control the movement of image voxels in these regions, and consequently may result in large displacement variations. If the B-spline displacements were used in adaptive radiotherapy, such variations may cause large errors in accumulated dose (Zhong and Siebers, 2009).
In the B-Spline registration, different regularization terms or Jacobian constraints can be assigned to different regions of interest to achieve desired rigidities or compression ratios. However, these terms must be customized to physical deformations caused by different physiological or positioning changes. Furthermore, the effects of the regularization terms may depend on the similarity of the two registered images and the weights assigned to each of these terms (kim et al., 2013). Finding optimal parameters for individual B-Spline-based registrations may require other approaches than implementing the FEM-based correction method, because the latter is independent of the image similarity and has regularization constraints inherent in the elasticity model. In this study, we employed an FEM-based elasticity tissue model to regulate the movement of image voxels in these regions. The results showed that the FEM correction can make prostate structures clearer in the reconstructed images (Fig 2), and reduce the mean unbalanced energy of the B-spline registrations from 2.65 to 0.38 mJ/cm3 for the ten patients.
The FEM method is independent of image intensities, and can be quickly performed with a tetrahedral mesh that covers a small region. In this study, this region was selected using a bounding box around the prostate. The rationale of using a bounding box rather than prostate boundaries is that prostate volumes appear different between MR and CT images, and this difference may misguide the B-spline-based registration algorithm, causing the volume of prostate contours changed after registration. For the ten B-spline-based image registrations, the prostate volume changed about 10% on average with the maximum up to 22.5% for patient 2 (Fig 4). After the FEM correction, the average volume variation was reduced to 1.5%, so the correction method helped improve the quality of the mutual information and B-spline-based registrations efficiently in the prostate region, especially with respect to prostate volume consistency and deformation regularity as shown in Tables 1 and 3.
For the ten B-spline-based registrations, their displacement uncertainties may result in blurred prostate/seminal vesicles in the warped images (Figs 2 and 9). The blurred structures are associated with large deformable image registration errors which can be detected and evaluated using the images of unbalanced energy (Li et al., 2013). It has been demonstrated that anatomical structures in the prostate region can be reconstructed clearly with the FEM computed displacements rather than with the B-spline-based registrations (Figs 2 and 9). It should be mentioned that it is possible to improve the performance of the B-Spline-based registrations with different regularization terms. Finding optimal weights and parameters for these terms is a difficult task (kim et al., 2013). The adaptive FEM will likely serve as an alternative method to quickly correct errors generated by the B-Spline based registration algorithms that have default regularization terms and parameters for clinical use.
Boundary constraints could make the FEM computational model difficult to converge if the assigned displacements are mechanically unachievable. However, for the displacements derived from the B-spline-based registrations, the FEM model can converge within 20 seconds. The fast convergence is due to the smooth B-spline displacements on the surface of the bounding box. While the B-spline-based registrations may have errors at some surface nodes, the influence of the errors is limited to the vicinity of these points. Tissue deformation in regions away from these points is less subject to these boundary constraints. This has been demonstrated in Figs 8 and 9. The fast FEM convergence is also due to the small size of the tetrahedral mesh. The surface of the mesh used in this study consists of 2846 tetrahedral nodes which is ten times smaller than that used in our previous study for covering the whole image domains (Zhong et al., 2012). Since for a given number of the mesh nodes n, the model’s computation time is at least in the order of n2 log(n) (Zhong et al., 2005), the small mesh-based correction method can greatly save the model’s computation time.
5. Conclusions
In MRI-guided radiation therapy, prostate contours accurately delineated in MR images could be changed by inaccurate MR-CT image registrations. This might reduce the benefit of MRI guidance. The proposed FEM method may help improve the MR-CT image registrations in the prostate region. Consequently, our approach will be valuable for development of high-quality MR-guided radiotherapy for prostate cancer patients.
Acknowledgments
The authors acknowledge the financial support from the National Institutes of Health grant number R01 CA140341.
Footnotes
Conflict of Interest: None
References
- Amdur RJ, Gladstone D, Leopold KA, Harris RD. Prostate seed implant quality assessment using MR and CT image fusion. Int J Radiat Oncol Biol Phys. 1999;43:67–72. doi: 10.1016/s0360-3016(98)00372-1. [DOI] [PubMed] [Google Scholar]
- Christensen GE, Yin P, Vannier MW, Chao KSC, Dempsey JF, Williamson JF. Large-deformation image registration using fluid landmarks. 4th IEEE Southwest Symposium on Image Analysis and Interpretation (SSIAI 2000); Austin, TX: IEEE Computer Society; pp. 269–73. [Google Scholar]
- Davis MH, Khotanzad A, Flamig DP, Harms SE. A physics-based coordinate transformation for 3-D image matching. IEEE transactions on medical imaging. 1997;16:317–28. doi: 10.1109/42.585766. [DOI] [PubMed] [Google Scholar]
- Dean CJ, Sykes JR, Cooper RA, Hatfield P, Carey B, Swift S, Bacon SE, Thwaites D, Sebag-Montefiore D, Morgan AM. An evaluation of four CT-MRI co-registration techniques for radiotherapy treatment planning of prone rectal cancer patients. Br J Radiol. 2012;85:61–8. doi: 10.1259/bjr/11855927. [DOI] [PMC free article] [PubMed] [Google Scholar]
- Greenleaf JF, Fatemi M, Insana M. SELECTED METHODS FOR IMAGING ELASTIC PROPERTIES OF BIOLOGICAL TISSUES. In. Annual Review of Biomedical Engineering: Annual Reviews. 2003:57–78. doi: 10.1146/annurev.bioeng.5.040202.121623. [DOI] [PubMed] [Google Scholar]
- kim J, Kumar S, Liu C, Zhong H, Robbins J, Pradhan D, Elshaikh MA, Chetty IJ. A Novel Approach for Establishing Benchmark CBCT/CT Deformable Image Registrations in Prostate Cancer Radiation Therapy. International journal of radiation oncology, biology, physics. 2013;87:S713. doi: 10.1088/0031-9155/58/22/8077. [DOI] [PMC free article] [PubMed] [Google Scholar]
- Klein S, Staring M, Murphy K, Viergever MA, Pluim JP. elastix: a toolbox for intensity-based medical image registration. IEEE transactions on medical imaging. 2010;29:196–205. doi: 10.1109/TMI.2009.2035616. [DOI] [PubMed] [Google Scholar]
- Korsager AS, Carl J, Ostergaard LR. MR-CT registration using a Ni-Ti prostate stent in image-guided radiotherapy of prostate cancer. Med Phys. 2013;40:061907. doi: 10.1118/1.4807087. [DOI] [PubMed] [Google Scholar]
- Lambert J, Greer PB, Menk F, Patterson J, Parker J, Dahl K, Gupta S, Capp A, Wratten C, Tang C, Kumar M, Dowling J, Hauville S, Hughes C, Fisher K, Lau P, Denham JW, Salvado O. MRI-guided prostate radiation therapy planning: Investigation of dosimetric accuracy of MRI-based dose planning. Radiother Oncol. 2011;98:330–4. doi: 10.1016/j.radonc.2011.01.012. [DOI] [PubMed] [Google Scholar]
- Li S, Glide-Hurst C, Lu M, Kim J, Wen N, Adams JN, Gordon J, Chetty IJ, Zhong H. Voxel-based statistical analysis of uncertainties associated with deformable image registration. Phys Med Biol. 2013;58:6481–94. doi: 10.1088/0031-9155/58/18/6481. [DOI] [PMC free article] [PubMed] [Google Scholar]
- Lian J, Xing L, Hunjan S, Dumoulin C, Levin J, Lo A, Watkins R, Rohling K, Giaquinto R, Kim D, Spielman D, Daniel B. Mapping of the prostate in endorectal coil-based MRI/MRSI and CT: a deformable registration and validation study. Med Phys. 2004;31:3087–94. doi: 10.1118/1.1806292. [DOI] [PubMed] [Google Scholar]
- Pluim JP, Maintz JB, Viergever MA. Mutual-information-based registration of medical images: a survey. IEEE Trans Med Imaging. 2003;22:986–1004. doi: 10.1109/TMI.2003.815867. [DOI] [PubMed] [Google Scholar]
- Polo A, Cattani F, Vavassori A, Origgi D, Villa G, Marsiglia H, Bellomi M, Tosi G, De CO, Orecchia R. MR and CT image fusion for postimplant analysis in permanent prostate seed implants. Int J Radiat Oncol Biol Phys. 2004;60:1572–9. doi: 10.1016/j.ijrobp.2004.08.033. [DOI] [PubMed] [Google Scholar]
- Roach M, III, Faillace-Akazawa P, Malfatti C, Holland J, Hricak H. Prostate volumes defined by magnetic resonance imaging and computerized tomographic scans for three-dimensional conformal radiotherapy. Int J Radiat Oncol Biol Phys. 1996;35:1011–8. doi: 10.1016/0360-3016(96)00232-5. [DOI] [PubMed] [Google Scholar]
- Sannazzari GL, Ragona R, Ruo Redda MG, Giglioli FR, Isolato G, Guarneri A. CT-MRI image fusion for delineation of volumes in three-dimensional conformal radiation therapy in the treatment of localized prostate cancer. Br J Radiol. 2002;75:603–7. doi: 10.1259/bjr.75.895.750603. [DOI] [PubMed] [Google Scholar]
- Sarvazyan T, Stolarsky V, Fishman V, Sarvazyan A. Development of mechanical models of breast and prostate with palpable nodules. :736–9. [Google Scholar]
- Schallenkamp JM, Herman MG, Kruse JJ, Pisansky TM. Prostate position relative to pelvic bony anatomy based on intraprostatic gold markers and electronic portal imaging. Int J Radiat Oncol Biol Phys. 2005;63:800–11. doi: 10.1016/j.ijrobp.2005.02.022. [DOI] [PubMed] [Google Scholar]
- Schreibmann E, Xing L. Narrow band deformable registration of prostate magnetic resonance imaging, magnetic resonance spectroscopic imaging, and computed tomography studies. Int J Radiat Oncol Biol Phys. 2005;62:595–605. doi: 10.1016/j.ijrobp.2005.02.001. [DOI] [PubMed] [Google Scholar]
- Schreibmann E, Xing L. Image registration with auto-mapped control volumes. Med Phys. 2006;33:1165–79. doi: 10.1118/1.2184440. [DOI] [PubMed] [Google Scholar]
- Tanaka H, Hayashi S, Ohtakara K, Hoshi H, Iida T. Usefulness of CT-MRI fusion in radiotherapy planning for localized prostate cancer. Journal of radiation research. 2011;52:782–8. doi: 10.1269/jrr.11053. [DOI] [PubMed] [Google Scholar]
- Villeirs GM, Van Vaerenbergh K, Vakaet L, Bral S, Claus F, De Neve WJ, Verstraete KL, De Meerleer GO. Interobserver delineation variation using CT versus combined CT + MRI in intensity-modulated radiotherapy for prostate cancer. Strahlentherapie und Onkologie: Organ der Deutschen Rontgengesellschaft … [et al] 2005;181:424–30. doi: 10.1007/s00066-005-1383-x. [DOI] [PubMed] [Google Scholar]
- Wang D, Strugnell W, Cowin G, Doddrell DM, Slaughter R. Geometric distortion in clinical MRI systems Part I: evaluation using a 3D phantom. Magn Reson Imaging. 2004;22:1211–21. doi: 10.1016/j.mri.2004.08.012. [DOI] [PubMed] [Google Scholar]
- Zhong H, Kim J, Li H, Nurushev T, Movsas B, Chetty IJ. A finite element method to correct deformable image registration errors in low-contrast regions. Phys Med Biol. 2012;57:3499–515. doi: 10.1088/0031-9155/57/11/3499. [DOI] [PMC free article] [PubMed] [Google Scholar]
- Zhong H, Peters T, Siebers JV. FEM-based evaluation of deformable image registration for radiation therapy. Phys Med Biol. 2007;52:4721–38. doi: 10.1088/0031-9155/52/16/001. [DOI] [PubMed] [Google Scholar]
- Zhong H, Siebers JV. Monte Carlo dose mapping on deforming anatomy. Phys Med Biol. 2009;54:5815–30. doi: 10.1088/0031-9155/54/19/010. [DOI] [PMC free article] [PubMed] [Google Scholar]
- Zhong H, Wachowiak MP, Peters TM. A real time finite element based tissue simulation method incorporating nonlinear elastic behavior. Comput Methods Biomech Biomed Engin. 2005;8:177–89. doi: 10.1080/10255840500295852. [DOI] [PubMed] [Google Scholar]


