

Abstract
We examined the topographic organization of the connections of the CA3 field of the macaque monkey hippocampus. Discrete anterograde and retrograde tracer injections were made at various positions within CA3 and CA1. The projections from CA3 to CA1 (Schaffer collaterals), which terminate in the strata radiatum, pyramidale, and oriens, are present throughout the entire transverse extent of CA1. Projections extend both rostrally and caudally from the injection site for as much as three-fourths of the longitudinal extent of the hippocampus. The associational projections from CA3 to CA3 also travel extensively along the longitudinal axis. CA3 gives rise to more substantial projections to CA1 than to CA3. CA3 projections that originate at the level of the uncus tend to be more restricted to the rostral portions of CA1 and CA3. As in the rodent brain, projections from CA3 to CA1 are distributed along a radial gradient, depending on the transverse location of the cells of origin. CA3 cells located near the dentate gyrus generate projections that more densely terminate superficially in the terminal zone of CA1, whereas CA3 cells located closer to CA1 give rise to projections that more heavily terminate deeply in the terminal zone of CA1. The present results indicate that in the monkey, as in the rat, CA3 cells give rise to extensive projections to CA1 and CA3. Interestingly, radial, transverse, and longitudinal gradients of CA3 fiber distribution, so clear in the rat, are much more subtle in the nonhuman primate brain.
Indexing terms: hippocampus, CA1, primate, Schaffer collaterals, associational projections, dentate gyrus, longitudinal connections, recurrent connections, medial temporal lobe
The hippocampal formation comprises a group of cortical regions including the dentate gyrus, hippocampus (CA3, CA2, CA1), subiculum, presubiculum, parasubiculum, and the entorhinal cortex (Amaral and Lavenex, 2007). Damage to these structures in adult humans and animals causes a profound loss of declarative memory function (Milner et al., 1998). Hippocampal damage causes an episodic memory deficit in adult humans (Squire and Zola, 1996) and prevents the establishment or use of spatial relational memory in adult nonhuman primates (Lavenex et al., 2006; Lavenex and Lavenex, 2008).
The hippocampal formation contains a unique set of largely unidirectional excitatory pathways (Amaral and Lavenex, 2007). The entorhinal cortex provides the major input to the dentate gyrus, hippocampus, and the subiculum. The dentate gyrus, which does not project back to the entorhinal cortex, projects to the CA3 field of the hippocampus, and CA3, in turn, projects to CA1 (Lavenex and Amaral, 2000). While these pathways have been carefully analyzed in rodents, the neuroanatomical organization of the major connections of the primate hippocampus have received relatively meager investigation in monkeys (Rosene and Van Hoesen, 1977, 1987) and in humans (Lim et al., 1997). Without such information, it is impossible to evaluate whether the fundamental principles of neuroanatomical organization are conserved across species. It is therefore also very difficult to assess the significance of functional or neuropathological information derived from rodent studies for human clinical conditions.
Previous studies in rats have shown that cells of the CA3 field of the hippocampus give rise to extensive projections to the CA1 field (Schaffer collaterals) and to the CA3 field itself (associational projections) (Hjorth-Simonsen, 1973; Swanson et al., 1978; Laurberg, 1979; Laurberg and Sorensen, 1981; Amaral and Witter, 1989; Ishizuka et al., 1990; Li et al., 1994; Witter, 2007; Wittner et al., 2007). Hjorth-Simonsen (1973) reported, using the Fink and Heimer degeneration method for analysis in rats, that the CA3 projections to CA1 and to CA3 terminate both in the stratum oriens and stratum radiatum and extend for 4–5 mm along the longitudinal axis of the hippocampus (40–50% of the full septotemporal length). Swanson et al. (1978) used the autoradiographic technique in rats to show that CA3 cells located at mid-septotemporal levels give rise to projections extending to the septal pole of the hippocampus and innervate fully two-thirds of the septotemporal extent of fields CA1 and CA3. CA3 cells in the temporal third of the hippocampus gave rise to more restricted projections that were confined to the temporal third of CA1 and CA3. Laurberg and Sorensen (1981) used retrograde tracer techniques and demonstrated that a particular region of CA1 received input from CA3 cells located as far as 6.0 mm away (or 60% of the full septotemporal length). In a remarkable study, Li et al. (1994) analyzed the distribution of axons from single, intracellularly labeled CA3 pyramidal cells; collaterals from single neurons were traced to as much as two-thirds of the septotemporal extent of CA1.
Ishizuka et al. (1990) used the anterograde tracer PHA-L (Phaseolus vulgaris leucoagglutinin) to evaluate the topographic organization of the CA3 projections in rats. Cells from mid and septal parts of CA3 gave rise to extensive projections that terminated throughout as much as three-fourths of the entire septotemporal extent of CA1. In addition, the CA3 projections to CA1 were found to terminate along definite radial, transverse, and septotemporal gradients, depending on the transverse location of the cells of origin within CA3. CA3 cells located close to the dentate gyrus gave rise to projections that terminated more densely in superficial layers of CA1, in the distal transverse portion of the field, and septally to the injection site. CA3 cells located close to CA1, in contrast, gave rise to projections that terminated more densely deeply within CA1, within proximal portions of the field, and temporally to the injection site.
There are only a few published studies of these connections in the monkey brain (Rosene and Van Hoesen, 1977, 1987; Buckmaster and Amaral, 2001). Rosene and Van Hoesen (1977, 1987), using 3H-amino acid autoradiography in the macaque monkey, showed that CA3 projects to the strata radiatum, pyramidale, and oriens of CA3, CA2, and CA1. They also described that the CA3 projections originating in the uncus are restricted to the rostral portion of the hippocampus. These studies, however, had relatively few experimental cases, and the question remains whether the major principles of topographical organization observed in the rat can be applied to the primate brain. Buckmaster and Amaral (2001) used intracellular recording and biocytin labeling to examine the local circuitry of proximal CA3 pyramidal neurons. In macaques, three types of proximal CA3 pyramidal neurons are found: classical pyramidal cells, neurons with their dendrites confined to the CA3 pyramidal cell layer, and CA3 cells whose apical dendrites extend into and ramify within the polymorphic, granule cell, and molecular layers of the dentate gyrus. The basic electrophysiological properties of proximal CA3 pyramidal neurons are similar to those reported for the rodent. Although this study revealed more heterogeneity and the potential for richer interconnections in the monkey proximal CA3 region, it did not provide any information about the topographical organization of the CA3 pyramidal neuron projections in primates.
In this study we used discrete anterograde and retrograde tracers to characterize the topographical organization of the major connections of the macaque monkey CA3, namely, the Schaffer collaterals (CA3 projections to CA1) and the associational projections of CA3 (CA3 projections to CA3).
MATERIALS AND METHODS
Surgery
All surgical and experimental procedures were approved by the Institutional Animal Care and Use Committees of the University of California, Davis, and conform to National Institutes of Health (NIH) guidelines. Twenty-one Macaca fascicularis monkeys of either sex, weighing 3–8 kg at the time of surgery, were used in these studies.
For all monkeys that underwent surgery between 2001–2003, magnetic resonance imaging (MRI) scans were performed prior to surgery to define the surgical coordinates for tracer injections (Lavenex et al., 2004b). Monkeys were anesthetized with ketamine hydrochloride (15 mg/kg i.m.) and medetomidine (30 μg/kg) and placed in an MRI-compatible stereotaxic apparatus (Crist Instruments, Damascus, MD). Brain images were acquired on a General Electric (Milwaukee, WI) 1.5 T Gyroscan magnet; 1.00 mm thick sections were taken using a T1-weighted inversion recovery pulse sequence (TR = 21, TE = 7.9, NEX 4, FOV =16 cm, matrix 256 × 256). The MRI images were analyzed and a stereotaxic atlas was prepared to determine the coordinates for injection of the neuroanatomical tracers. For all monkeys that underwent surgery in 1992–1993, the standard atlas of Szabo and Cowan (1984) was used to determine the coordinates for injection of the neuroanatomical tracers (Lavenex et al., 2002).
For surgery, animals were preanesthetized with ketamine hydrochloride (8 mg/kg i.m.), intubated with a tracheal cannula, and mounted in a stereotaxic apparatus. The animals were then placed on a mechanical ventilator where a surgical level of anesthesia was maintained with a combination of isoflurane (1%) and intravenous infusion of fentanyl (7–10 μg/kg/h) for cases in 2001–2003, or isoflurane alone (1–3% as needed) for cases in 1992–1993. Using sterile procedures, the skull was exposed and a small hole was made at a site appropriate for the injection. Electrophysiological recordings were performed to confirm the appropriate dorsoventral coordinate for placement of the injection. Neuroanatomical tracers were iontophoretically injected (see below). After the last injection, the wound was sutured in three layers and the animal recovered from anesthesia. Analgesics (0.15 mg/kg of oxymorphone given three times daily; or buprenorphine 0.02 mg/kg twice daily) were administered immediately postsurgically. A prophylactic regime of antibiotics (20 mg/kg of Cefazolin, three times daily) was also administered during the first 5 days of the survival period.
Neuroanatomical tracer injections
Each monkey received up to two different, discrete, anterograde tracer injections of PHA-L (Vector Laboratories, Burlingame, CA; 2.5% solution in 0.1 M PO4 buffer, pH 7.4) or biotinylated dextran amine (BDA, Molecular Probes Eugene, OR; 10% solution in 0.1 M PO4 buffer, pH 7.4) into various transverse and rostrocaudal portions of CA3 (one on each side of the brain), and some monkeys received retrograde tracer injections of cholera toxin subunit B (CTB, Molecular Probes; 20% solution in 0.1 M PO4 buffer, pH 7.2) and Fluoro-Ruby (FR, Molecular Probes; 10% solution in 0.1 M PO4 buffer, pH 7.4) in CA1 and CA3. We had previously determined that projections arising from the caudal two-thirds of the monkey hippocampus were largely ipsilateral (Amaral et al., 1984), thus allowing uncompromised hippocampal injections of the same tracer bilaterally. All tracer substances were iontophoretically dispensed (30–45-minute injections with 5 μAmp DC pulses; 7 seconds ON, 7 seconds OFF) through glass micropipettes (20–30 μm tips). Following injection of the tracer, the pipette was withdrawn in three stages to minimize leakage along the pipette tract. First, it was left at the injection site for 1 minute, then raised 100 μm and left there for 5 minutes. Finally, the pipette was slowly withdrawn from the brain at a rate of about 2 mm per minute. Animals survived for 14 days, were deeply anesthetized with pentobarbital (50 mg/kg i.v., Fatal-Plus, Vortech Pharmaceuticals, Dearborn, MI), and perfused transcardially with 1% and 4% paraformaldehyde in 0.1 M phosphate buffer (pH 7.4). The brains were postfixed for 6 hours in the same fixative, cryoprotected in 10% and 20% glycerol solutions in 0.1 M phosphate buffer (pH 7.4; for 24 and 72 hours, respectively), rapidly frozen in isopentane, and stored at −70°C until sectioning. Sections were cut at 30 μm on a freezing, sliding microtome and processed for the visualization of the tracer substances.
Tissue processing
Free-floating sections from cases that contained discrete anterograde tracer injections of PHA-L and BDA were processed with constant agitation, at room temperature (unless specified otherwise), for the detection of the transported substance (Lavenex et al., 2004b). Immunohistochemistry for PHA-L, CTB, and FR was carried out as follows. Sections were rinsed 3 × 10 minutes in 0.02 M potassium phosphate-buffered saline (KPBS, pH 7.4), incubated 15 minutes in 0.5% H2O2, washed 6×5 minutes in 0.02 M KPBS, and incubated for 4 hours in a blocking solution made of 0.5% Triton X-100 (TX-100; Fisher Scientific, Pittsburgh, PA), with 5% normal goat serum (NGS; Chemicon, Temecula, CA) in 0.02 M KPBS. Sections were then incubated for 40 hours at 4°C in a solution containing a primary antibody against the tracer substance (rabbit anti-PHA-L at 1:12,000 from Vector Laboratories; rabbit anti-CTB at 1:2,500 from Fitzgerald, Concord, MA; rabbit anti-Fluoro-Ruby at 1:40,000 from Molecular Probes; in 0.3% TX-100, 2% NGS in 0.02 M KPBS). After incubation in primary antiserum, sections were washed 3 × 10 minutes in 0.02 M KPBS containing 2% NGS and incubated for 1 hour in a solution containing a biotinylated secondary antibody against rabbit (goat antirabbit IgG at 1:227 from Vector Laboratories; in 0.3% TX-100, 2% NGS in 0.02 M KPBS). Sections were rinsed 3 × 10 minutes in 0.02 M KPBS containing 2% NGS and incubated for 45 minutes in a solution containing an avidin-biotin complex (Biomeda, Foster City, CA, Biostain Super ABC Kit; in 0.02 M KPBS). Sections were rinsed 3 × 10 minutes in 0.02 M KPBS containing 2% NGS and incubated for another 45 minutes in a solution containing the biotinylated secondary antibody (goat antirabbit IgG at 1:227, 0.3% TX-100, 2% NGS in 0.02 M KPBS). Sections were rinsed 3 × 10 minutes in 0.02 M KPBS (with no NGS) and incubated for another 30 minutes in the solution containing the avidin-biotin complex. Sections were rinsed 3 × 10 minutes in 50 mM Tris buffer (pH 7.4) and incubated for 45 minutes in a DAB-peroxidase solution containing 0.05% DAB (0.5 mg/mL of 3,3′-diaminobenzidine, Fisher Scientific) and 0.04% H2O2 in Tris buffer. Finally, sections were rinsed 2 × 10 minutes in Tris buffer, 1 × 10 minutes in 0.02 M KPBS, mounted on gelatin-coated slides, and dried at 37°C overnight. The mounted sections were then processed for intensification of the DAB reaction product and coverslipped as described previously (Lavenex et al., 2004b).
BDA processing was as follows. Sections were rinsed 3 × 10 minutes in 0.02 M KPBS, incubated 15 minutes in 0.5% H2O2, washed 6×5 minutes in 0.02 M KPBS, and incubated for 1 hour in a solution comprised of 1% Triton X-100 (TX-100; Fisher Scientific) in 0.02 M KPBS. Sections were then incubated overnight at 4°C in a solution made of an avidin-biotin complex (Biomeda Biostain Super ABC Kit), 0.3% TX-100 in 0.02 M KPBS. Sections were rinsed 3 × 10 minutes in 50 mM Tris buffer and incubated for 45 minutes in a DAB-peroxidase solution containing 0.05% DAB, 0.015% H2O2 in Tris buffer. Sections were rinsed 2×10 minutes in Tris buffer, 1×10 minutes in 0.02 M KPBS, mounted on gelatin-coated slides, and placed at 37°C overnight. The mounted sections were then processed for intensification of the DAB reaction product and coverslipped as described previously (Lavenex et al., 2004b).
We have studied immunohistological preparations stained with antibodies directed at the nonphosphorylated high-molecular-weight neurofilament protein (SMI32 antibody; Lavenex et al., 2007; Lavenex et al., 2009) and for calretinin to help define the boundaries of the CA3 field with the polymorphic layer of the dentate gyrus and the CA1 field of the hippocampus. Procedures for such immunohistochemical staining have been described in previous publications (Lavenex et al., 2004a, 2009). The monoclonal antibody SMI-32 (Sternberger Monoclonals, Lutherville, MD, Cat. no. SMI-32, lot 16) was raised in mouse against the nonphosphorylated 200-kDa heavy neurofilament. On conventional immunoblots, SMI-32 visualizes two bands (200 and 180 kDa), which merge into a single NFH line on two-dimensional blots. This antibody has been shown to react with nonphosphorylated high-molecular-weight neurofilaments of most mammalian species, including rats, cats, dogs, monkeys, and humans, and may also show some limited cross reactivity with nonphosphorylated medium-molecular weight-neurofilaments. The anticalretinin monoclonal antibody (SWANT, Bellinzona, Switzerland; Cat. no. 6B3, lot 010399) was raised in mouse by immunization with recombinant human calretinin-22k. Calretinin-22k is an alternative splice product of the calretinin gene and identical to calretinin up to Arg178. After fusion, hybridoma cells were screened with human recombinant calretinin as target, the clone 6B3 was selected, and ascites was produced. The antibody 6B3 recognizes an epitope within the first four EF-hands domains common to both calretinin and calretinin-22k. This antibody does not crossreact with calbindin-D28K or other known calcium binding-proteins, as determined by immunoblots (SWANT).
Data analysis
The distribution of anterogradely labeled fibers throughout the hippocampus was analyzed using darkfield optics. To represent the gradients of fiber termination in CA1 and CA3, low-magnification photomicrographs were taken of representative coronal sections for each case. Photomicrographs were taken using LEITZ DMRD and Leica MZ9.5 microscopes. Photomicrographic images were imported into Adobe Photoshop (v. 8.0, San Jose, CA) and contrast and brightness were adjusted. Plotting of retrogradely labeled cells for CTB and FR was done using the Neurolucida computer-aided microscope system (MicroBrightField, Colchester, VT). We estimated the lengths of CA3 projections to CA1 and CA3 along the longitudinal axis by multiplying the number of coronal sections where labeling was observed by the distance between sections. In order to describe the locations of the injection sites more precisely, we calculated the ratio of the distance from the rostral edge of the hippocampus to the center of the injection site divided by the full rostrocaudal distance of the hippocampus (the anterior–posterior or AP ratio). An AP ratio less than 0.33 indicates an injection site that was located in the rostral third of CA3; an AP ratio between 0.33 and 0.66 indicates an injection site located in the mid-third; and an AP ratio larger than 0.66 indicates an injection site that was located in the caudal third of CA3 (Kondo et al., 2008).
RESULTS
Cytoarchitecture of CA3, CA2, and CA1
The nomenclature and cytoarchitectonic subdivisions of the monkey hippocampal formation have been described previously (Amaral et al., 1984; Pitkanen and Amaral, 1993; Kobayashi and Amaral, 1999; Amaral and Lavenex, 2007). The subdivisions of the monkey hippocampal formation are indicated in Figure 1. Coronal sections stained for Nissl, calretinin, and the nonphosphorylated high-molecular-weight neurofilaments are shown in Figure 2. The latter two stains help define the border of CA3 with the polymorphic layer of the dentate gyrus and the border of CA1 with the subiculum, respectively.
Figure 1.

Photomicrographs of Nissl-stained coronal sections of the Macaca fascicularis monkey hippocampal formation arranged from rostral (A) to caudal (D). Line drawings in the right panels (E–H) illustrate the cytoarchitectonic divisions within the hippocampal formation. Black profile indicates the granule cell layer of the dentate gyrus and gray profile indicates the pyramidal cell layer of the hippocampus and subiculum. CA1, CA2, CA3, fields of the hippocampus; DG, dentate gyrus; PrS, presubiculum; S, subiculum. Scale bar = 1 mm.
Figure 2.

Photomicrographs of adjacent coronal sections through the Macaca fascicularis monkey hippocampal formation. A: Nissl-stained section. The pyramidal cell layer of the hippocampus and subiculum is demarcated with a black outline. B: Immunohistochemically stained section for the identification of the calcium-binding protein calretinin. White arrowheads indicate the moderately stained mossy fibers (mf). The border of the proximal portion of CA3 and the polymorphic layer (pl) of the dentate gyrus is indicated with black arrows. Dense staining of the inner third of the molecular layer (ml) is indicated with black arrowheads. Note that calretinin-like immunoreactivity is denser in the polymorphic layer of the dentate gyrus and thus defines the boundary between CA3 and the dentate gyrus C: Immunohistochemically stained section for the identification of nonphosphorylated high-molecular-weight neurofilaments (SMI32 antibody). Note that there is dark staining of the CA3 and CA2 pyramidal layers but there is little or no staining in CA1. This provides a stark contrast with the subiculum that contains moderately stained pyramidal cell bodies and heavily stained dendritic processes. The difference between the lack of staining in CA1 and the heavy labeling of the subiculum allows the precise determination of the oblique border between these fields (arrows). gcl, granule cell layer. Scale bar = 1 mm.
Briefly, the hippocampus is divided into three distinct fields: CA3, CA2, and CA1. Fields CA3 and CA2 have large pyramidal cells; CA2 is differentiated from CA3 by its lack of mossy fiber input (projections from the dentate gyrus granule cells). Field CA1 is populated by smaller pyramidal cells and the pyramidal cell layer is substantially thicker than in CA3 and CA2. The hippocampus is also divided into a number of laminae that run parallel to the pyramidal cell layer. The narrow, relatively cell-free layer located deep to the pyramidal cell layer is called the stratum oriens. Deep to the stratum oriens is the fiber-containing alveus. Superficial to the pyramidal cell layer in CA3 is the stratum lucidum in which mossy fibers travel. Stratum radiatum is located superficial to stratum lucidum in CA3 and immediately above the pyramidal cell layer in CA2 and CA1. The most superficial layer of the hippocampus is called the stratum lacunosum-moleculare. The border of the CA1 field with the subiculum is quite oblique, with the progressively thinner CA1 pyramidal cell layer extending over the initial portion of the subiculum. The border between the subiculum and CA1 is sometimes marked by a narrow obliquely oriented cell-free zone in Nissl preparations. The SMI-32 preparations clearly mark this oblique border since the CA1 cells are unlabeled, while the subicular pyramidal cell bodies and proximal dendrites are moderately-to-densely labeled (Fig. 2).
Within the hippocampus, we use the term “superficial” to mean toward the hippocampal fissure and the term “deep” to indicate the opposite direction. The long axis of the hippocampus is referred to as the longitudinal or rostrocaudal axis (equivalent to the septotemporal axis in rats). The rostral portion of the monkey hippocampus corresponds to the temporal portion of the rat hippocampus, and the caudal portion of the monkey hippocampus to the septal portion of the rat hippocampus. The axis orthogonal to the longitudinal axis is the transverse axis. Within any particular field of the hippocampal formation, the portion closer to the dentate gyrus is said to be proximal and that closer to the entorhinal cortex is distal. Thus, in CA3 the portion close to the dentate gyrus is called the proximal portion of CA3 and the CA3 region near CA2 is called the distal portion of CA3. In the CA1 region the portion close to CA2 is called the proximal portion of CA1 and the region near the subiculum is called the distal portion of CA1.
We call the most medial portion of the rostral hippocampus the uncus. It is important to note that the uncus is actually the most “rostral” portion of the hippocampus along the longitudinal axis. The flexed, rostrally located portion that runs mediolaterally is called the genu and the laterally situated, main portion of the hippocampus, is the body. At the rostral levels where the hippocampus flexes medially and then caudally, it is difficult, when viewed in coronal sections, to specify the identity and borders of the subdivisions of the hippocampus. However, adjacent coronal sections stained with the SMI32 antibody provide helpful cues to defining the limits of hippocampal fields in Nissl-stained sections. The CA3 region is present within the uncus but the CA1 field is not.
Description of the injection sites
Figure 3 presents the locations of the 16 anterograde tracer injections analyzed in this study. Of the 16 injections, nine were used previously in a study describing the connections of the dentate gyrus (Kondo et al., 2008). We placed five anterograde tracer injections in the rostral third of CA3 (Tables 1, 2). The PHA-L injection in case M-03-02 involved strata radiatum, lucidum, lacunosum-moleculare, and the pyramidal cell layer of CA3 and also involved the molecular and granule cell layers of the dentate gyrus. The PHA-L injection in case M-01-02 involved the pyramidal cell layer, stratum oriens, and the deep portion of stratum radiatum of CA3 at the border between the uncus and the genu. The PHA-L injection in case M-02-02 was located in the proximal portion of CA3 and involved all layers of the adjacent dentate gyrus. The PHA-L injection in case M-11-92 located in the rostral body of CA3 mainly involved strata radiatum and lucunosum-moleculare as well as the adjacent dentate gyrus. The PHA-L injection in case M-12-92 was located in the proximal portion of the pyramidal cell layer of CA3 and involved all layers of the dentate gyrus.
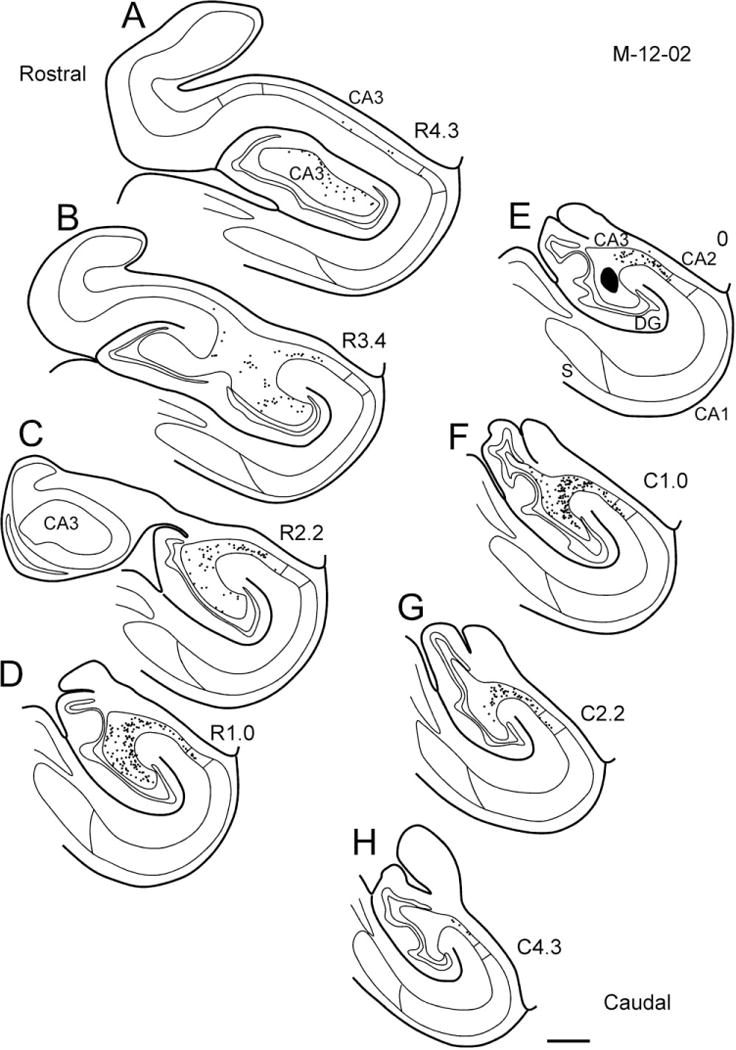
Figure 3.

Series of line drawings of coronal sections through the monkey hippocampal formation arranged from rostral (A) to caudal (H). The locations and approximate sizes of the central portions of the anterograde tracer injections for cases analyzed in this study are plotted at appropriate levels. Injection sites in both left and right hemispheres are plotted on sections drawn from the left hemisphere. Scale bar = 1 mm.
TABLE 1.
Rostrocaudal Length of CA3 Projections to CA1
| Case | Tracer | AP ratio | Transverse location | Rostral length (mm) | Caudal length (mm) | Rostrocaudal length (mm) | Ratio of the projection to the full hippocampal length |
|---|---|---|---|---|---|---|---|
| Rostral | |||||||
| M-03-02 | PHA-L | 0.15 | D | 1.9 | 5.5 | 7.4 | 0.48 |
| M-01-02 | PHA-L | 0.21 | NA | 2.4 | 2.6 | 5 | 0.38 |
| M-02-02 | PHA-L | 0.19 | P | 2.4 | 9.6 | 12 | 0.78 |
| M-11-92 | PHA-L | 0.32 | M-P | 3.8 | 8.9 | 12.7 | 0.93 |
| M-12-92 | PHA-L | 0.33 | P | 4.6 | 8.2 | 12.7 | 0.93 |
| Average | 0.24 | 3.0 | 7.0 | 10.0 | 0.70 | ||
| Median | 0.21 | 2.4 | 8.2 | 12.0 | 0.78 | ||
| SD | 0.08 | 1.1 | 2.9 | 3.5 | 0.26 | ||
| Mid | |||||||
| M-05-02 | PHA-L | 0.34 | M | 5 | 7.9 | 13 | 0.89 |
| M-09-93 | BDA | 0.36 | M | 4.8 | 8.6 | 13.4 | 0.95 |
| M-06-92 | PHA-L | 0.39 | M | 5.3 | 8.4 | 13.7 | 1.00 |
| M-10-93-R | BDA | 0.42 | CA2 | 6 | 5.8 | 11.8 | 0.82 |
| M-10-93-L | BDA | 0.44 | P | 5.5 | 7.9 | 13.4 | 0.92 |
| M-09-92 | PHA-L | 0.44 | D | 6.7 | 7.9 | 14.6 | 0.97 |
| M-02-92 | PHA-L | 0.55 | NA | 7.7 | 7 | 14.6 | 0.95 |
| M-02-04 | BDA | 0.65 | D | 7.9 | 5.3 | 13.2 | 0.89 |
| Average | 0.45 | 6.1 | 7.4 | 13.5 | 0.92 | ||
| Median | 0.43 | 5.8 | 7.9 | 13.4 | 0.94 | ||
| SD | 0.10 | 1.2 | 1.2 | 0.9 | 0.06 | ||
| Caudal | |||||||
| M-09-03 | BDA | 0.75 | M-P | 6.2 | 3.8 | 10.1 | 0.74 |
| M-10-02 | BDA | 0.77 | M-P | 8.9 | 3.4 | 12.2 | 0.84 |
| M-07-03 | PHA-L | 0.82 | D | 9.1 | 2.6 | 11.8 | 0.89 |
| Average | 0.78 | 8.1 | 3.3 | 11.4 | 0.82 | ||
| Median | 0.77 | 8.9 | 3.4 | 11.8 | 0.84 | ||
| SD | 0.04 | 1.6 | 0.6 | 1.1 | 0.08 |
P, Proximal CA3; M, Mid CA3; D, Distal CA3.
TABLE 2.
Rostrocaudal Length of CA3 Projections to CA3
| Case | Tracer | AP ratio | Transverse location | Rostral length (mm) | Caudal length (mm) | Rostrocaudal length (mm) | Ratio of the projection to the full hippocampal length |
|---|---|---|---|---|---|---|---|
| Rostral | |||||||
| M-03-02 | PHA-L | 0.15 | D | 1 | 6.7 | 7.7 | 0.49 |
| M-01-02 | PHA-L | 0.21 | NA | 2.2 | 1.4 | 3.6 | 0.27 |
| M-02-02 | PHA-L | 0.19 | P | 1.2 | 7.2 | 8.4 | 0.55 |
| M-11-92 | PHA-L | 0.32 | M-P | 2.9 | 6.2 | 9.1 | 0.67 |
| M-12-92 | PHA-L | 0.33 | P | 3.1 | 5 | 8.2 | 0.6 |
| Average | 0.24 | 2.1 | 5.3 | 7.4 | 0.52 | ||
| Median | 0.21 | 2.2 | 6.2 | 8.2 | 0.55 | ||
| SD | 0.08 | 1.0 | 2.3 | 2.2 | 0.15 | ||
| Mid | |||||||
| M-05-02 | PHA-L | 0.34 | M | 3.1 | 6.2 | 9.4 | 0.64 |
| M-09-93 | BDA | 0.36 | M | 3.6 | 7.4 | 11 | 0.78 |
| M-06-92 | PHA-L | 0.39 | M | 4.1 | 7.2 | 11.3 | 0.82 |
| M-10-93-R | BDA | 0.42 | CA2 | 4.6 | 5.5 | 10.1 | 0.7 |
| M-10-93-L | BDA | 0.44 | P | 5 | 6 | 11 | 0.76 |
| M-09-92 | PHA-L | 0.44 | D | 5.5 | 7.2 | 12.7 | 0.84 |
| M-02-92 | PHA-L | 0.55 | NA | 7.2 | 5.5 | 12.7 | 0.83 |
| M-02-04 | BDA | 0.65 | D | 6.7 | 4.3 | 11 | 0.74 |
| Average | 0.45 | 5.0 | 6.2 | 11.2 | 0.76 | ||
| Median | 0.43 | 4.8 | 6.1 | 11.0 | 0.77 | ||
| SD | 0.10 | 1.4 | 1.1 | 1.1 | 0.07 | ||
| Caudal | |||||||
| M-09-03 | BDA | 0.75 | M-P | 9.1 | 2.9 | 12 | 0.88 |
| M-10-02 | BDA | 0.77 | M-P | 9.6 | 2.9 | 12.5 | 0.85 |
| M-07-03 | PHA-L | 0.82 | D | 9.8 | 1.4 | 11.3 | 0.85 |
| Average | 0.78 | 9.5 | 2.4 | 11.9 | 0.86 | ||
| Median | 0.77 | 9.6 | 2.9 | 12.0 | 0.85 | ||
| SD | 0.04 | 0.4 | 0.9 | 0.6 | 0.02 |
P, Proximal CA3; M, Mid CA3; D, Distal CA3.
Eight anterograde tracer injections were made in the mid-rostrocaudal third of the CA3 field (Fig. 3; Tables 1, 2). The PHA-L injection in case M-05-02 involved all layers of the mid-transverse portion of CA3. The BDA injection in case M-09-93 involved the pyramidal cell layer of CA3 at a mid-transverse location as well as all layers of the infrapyramidal blade of the dentate gyrus. The PHA-L injection in case M-06-92 involved the pyramidal cell layer and strata oriens and radiatum in the mid-transverse portion of CA3. The BDA injection in case M-10-93-R was located in the pyramidal cell layer and stratum radiatum of CA2. The BDA injection in case M-10-93-L involved the pyramidal cell layer in the proximal portion of CA3 and all layers in the crest of the dentate gyrus. The PHA-L injection in case M-09-92 involved all layers in the distal portion of CA3 and CA2. The PHA-L injection in case M-02-92 involved the pyramidal cell layer in the proximal portion of CA3 as well as all layers of the suprapyramidal blade of the dentate gyrus. The BDA injection in case M-02-04 involved the pyramidal cell layer and strata lucidum and radiatum in the distal portion of CA3.
Three anterograde tracer injections were made into the caudal third of the CA3 field (Fig. 3; Tables 1, 2). The BDA injection in case M-09-03 involved all layers in the proximal to mid-portions of CA3 as well as all layers in the lateral part of the dentate gyrus. The BDA injection in case M-10-02 involved all layers in the proximal and mid-portions of CA3 as well as all layers in the dentate gyrus. The PHA-L injection in case M-07-03 involved all layers of the distal portion of CA3 as well as all layers in CA2 and the proximal portion of CA1. Taken together, these 16 anterograde tracer injections provided the opportunity to assess projections arising from CA3 throughout its rostrocaudal and transverse extents.
We also made six retrograde tracer injections into CA1 (five CTB and one FR) and five retrograde tracer injections into CA3 (all CTB) at various rostrocaudal levels of the hippocampal formation (Table 3). The aim of these injections was to confirm the cells of origin and the rostrocaudal distribution of the CA3 projections to CA1 and CA3.
TABLE 3.
Retrograde Tracer Injections in CA1 and CA3
| Case | Tracer | AP ratio | Transverse location |
|---|---|---|---|
| CA1 Injection | |||
| M-01-01 | FR | 0.04 | NA |
| M-02-02 | Ctb | 0.32 | D-M |
| M-07-03-L | Ctb | 0.42 | P-M |
| M-08-03-L | Ctb | 0.56 | D |
| M-14-03 | Ctb | 0.64 | M-D |
| M-01-04 | Ctb | NA | M-D |
| CA3 Injection | |||
| M-09-03 | Ctb | 0.38 | P |
| M-12-02-R | Ctb | 0.41 | P-M |
| M-04-02-L | Ctb | 0.54 | P |
| M-04-02-R | Ctb | 0.68 | P |
| M-08-03-R | Ctb | NA | P |
P, Proximal; M, Mid; D, Distal.
CA3 projections to CA1
In all cases examined in this study we observed CA3 projections that were extensively distributed throughout the transverse and longitudinal axes of the CA1 field of the hippocampus. A general overview of the prototypical pattern of projections is presented in Figure 4. The PHA-L injection in this case (M-06-92; Fig. 4B) gave rise to axonal and terminal labeling that was distributed throughout the entire transverse extent of CA1. Labeling was observed in all layers of CA1 except for stratum lacunosum-moleculare. The dense labeling within CA1 stopped precisely at the border of CA1 with the subiculum. This general pattern of labeling was observed in all cases with an injection in the CA3 field of the hippocampus. Projections from the CA2 field were observed to be quite similar to those from distal CA3. In the remaining portion of this section we review the topography of CA3 to CA1 and CA3 to CA3 projections as well as the gradients of distribution that were associated with the transverse location of the injection site.
Figure 4.
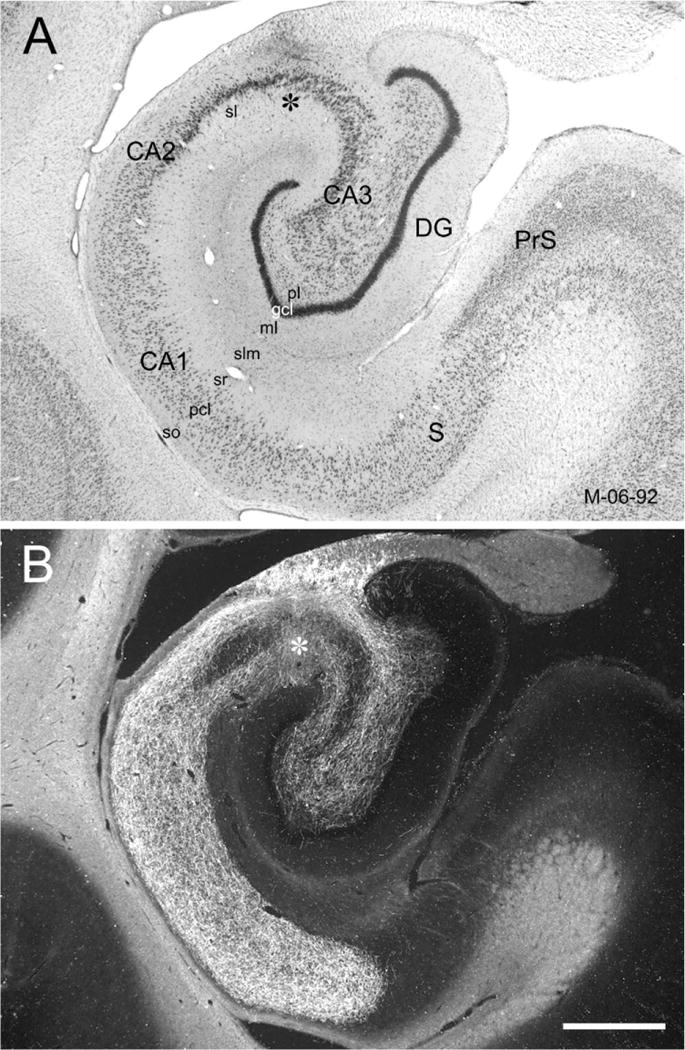
General overview of the CA3 projections to CA1 and CA3 (case M-06-92). A PHA-L injection is located in the mid-transverse portion of CA3 at a mid-rostrocaudal level of the hippocampus (asterisk in B). A: Brightfield photomicrograph of a Nissl-stained coronal section of the hippocampal formation at a mid-rostrocaudal level. B: Darkfield photomicrograph of a section adjacent to the one shown in A that illustrates PHA-L labeled CA3 projections to CA1 (Schaffer collaterals) and to CA3 (associational projections). Note the very substantial projections through the full transverse extents of CA1, CA2, and CA3. Labeled fibers and terminals are present in the strata radiatum (sr), pyramidale, and oriens (so) in all hippocampal fields. The band of densely labeled fibers and terminals ends exactly at the border between CA1 and the subiculum. Labeled axons are also present in the polymorphic layer of the dentate gyrus. pcl, pyramidal cell layer; sl, stratum lucidum; slm, stratum lacunosum-moleculare. Scale bar = 1 mm.
Longitudinal projections from CA3 to CA1
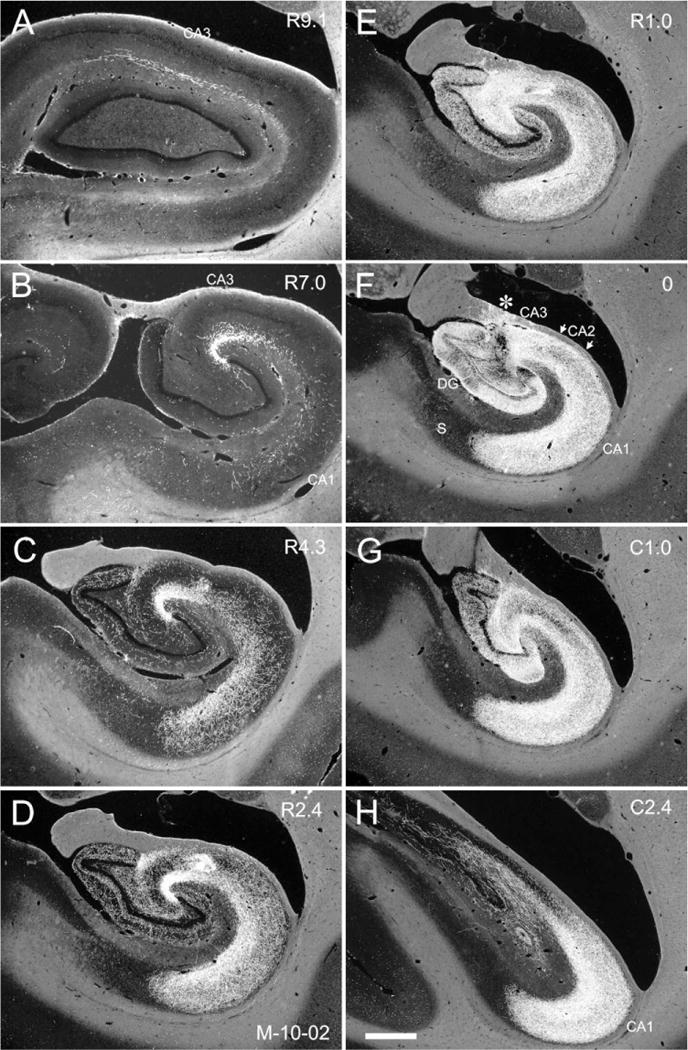
One of the most striking findings concerning the CA3 projections to CA1 is how extensively axons are distributed both rostrally and caudally from the injection site. In Figure 5 the distribution of labeled axons and terminals is shown for case M-06-92 (the same case as illustrated in Fig. 4). In this case, which had a PHA-L injection at mid-transverse and mid-rostrocaudal levels (Fig. 5C), a very high density of axon and terminal labeling was observed both at the level of the injection and for a couple of millimeters in both the rostral and caudal directions (Fig. 5B–D). Beyond the zone of the highest density of labeling, there appeared to be a gradual decrease in axonal and terminal labeling at progressively greater distances (Fig. 5A,E–H). The projections extended for ≈5.3 mm rostrally and 8.4 mm caudally for a total distance of 13.7 mm rostrocaudally or about the full rostrocaudal extent of the hippocampus (Table 1). Only the CA1 region located at the medial portion of the genu (Fig. 5A) was devoid of labeled fibers and terminals.
Figure 5.

Darkfield photomicrographs of sections of the hippocampal formation arranged from rostral (A) to caudal (H) showing the distribution of PHA-L labeled fibers and terminals in case M-06-92. The injection is located in the mid-transverse portion of CA3 at a mid-rostrocaudal level of the hippocampus (asterisk in C, same as B in Fig. 4). The number to the right of each panel indicates the distance, in millimeters, of the photographed section from the injection site. R and C indicate rostral and caudal to the injection site, respectively. Note that the CA3 projections to CA1 and CA3 are distributed very extensively along the rostrocaudal axis. Scale bar = 1 mm.
Similarly widespread projections were observed when injections involved proximal or distal portions of CA3 at the mid-rostrocaudal level (Figs. 6, 7). In cases M-10-93-L and M-09-92, projections extended for 13.4 mm (92% of the full rostrocaudal length of the hippocampus) and 14.6 mm (97% of the full rostrocaudal length of the hippocampus), respectively (Table 1). A BDA injection in CA2 (case M-10-93-R; Fig. 8D) also labeled CA1 extensively along the long axis. In fact, for all cases located at these mid-rostrocaudal levels, the total rostrocaudal length of the CA3 and CA2 projections to CA1 ranged from 11.8–14.6 mm (mean 13.5 mm or ≈92% of the full rostrocaudal extent).
Figure 6.
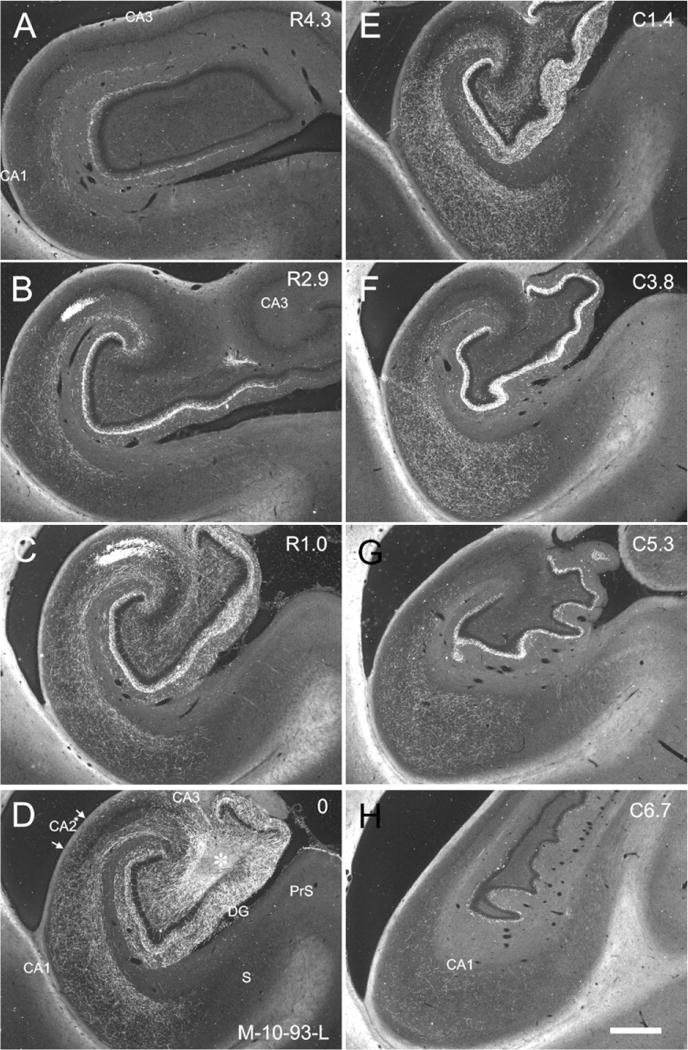
Darkfield photomicrographs of sections of the hippocampal formation arranged from rostral (A) to caudal (H) showing the distribution of BDA labeled fibers and terminals in case M-10-93-L. The injection is located in the proximal portion of CA3 at a mid-rostrocaudal level of the hippocampus (asterisk in D). Note that labeled fibers in CA1, CA2, and CA3 are denser in the superficial portion of stratum radiatum. The CA3 projections to CA1 are more substantial and extensive than the CA3 projections to CA3. Scale bar = 1 mm.
Figure 7.

Darkfield photomicrographs of sections of the hippocampal formation arranged from rostral (A) to caudal (H) showing the distribution of PHA-L labeled fibers and terminals in case M-09-92. The injection is located in the distal portion of CA3 and CA2 at a mid-rostrocaudal level of the hippocampus (asterisk in D). Note that in contrast to the proximal CA3 injection illustrated in Figure 6, the labeled fibers terminate more densely in the deep portion of the terminal zone in CA1. Scale bar = 1 mm.
Figure 8.

Darkfield photomicrographs of sections of the hippocampal formation arranged from rostral (A) to caudal (H) showing the distribution of BDA-labeled fibers and terminals in case M-10-93-R. The injection is located in CA2 at a mid-rostrocaudal level of the hippocampus (asterisk in D). Note that labeling is present in CA1, CA2, and CA3. Labeled fibers terminate more densely in the deep portion of the terminal zone in CA1, which is similar to the pattern of labeling following an injection into the distal portion of CA3 (Fig. 7). Scale bar = 1 mm.
In cases in which the anterograde tracer injection was located at the most rostral levels of CA3 (uncus and medial genu), we observed much more limited projections restricted to the rostral portions of CA1. Figure 9 illustrates the projections from a PHA-L injection located in the distal portion of CA3 at the level of the genu (case M-03-02). Dense labeling was restricted to rostral levels of CA1 (Fig. 9A,B). Figure 10 illustrates a case with a PHA-L injection that involved the uncal portion of CA3 (M-01-02). This case demonstrated a very restricted projection to rostral levels of CA1. However, when the injection was situated a bit more caudally in the rostral body of the hippocampus (case M-02-02; Fig. 11), the projections to CA1 were again very extensive along the rostrocaudal axis (Table 1). Indeed, for cases with injections located in the genu of the hippocampus (cases M-03-02 and M-01-02), the total rostrocaudal distance of the projections ranged from 5.0–7.4 mm (or ≈38–48% of the rostrocaudal extent of the hippocampus). However, when the injection involved the rostral body of the hippocampus (cases M-02-02, M-11-92, M-12-92), the projection extended for 12.0–12.7 mm (or ≈78–93% of the rostrocaudal extent of the hippocampus).
Figure 9.
Darkfield photomicrographs of sections of the hippocampal formation arranged from rostral (A) to caudal (H) showing the distribution of PHA-L labeled fibers and terminals in case M-03-02. The injection is located in the distal portion of CA3 as well as in the adjacent dentate gyrus at the level of the genu of the hippocampus (asterisk in B). Note that compared with other cases, the CA3 projections to CA1 and CA3 are restricted to the rostral portions of the hippocampus. Labeling does extend, however, far rostrally within the uncal portion of CA3 (right side of panels in C,D). Scale bar = 1 mm.
Figure 10.
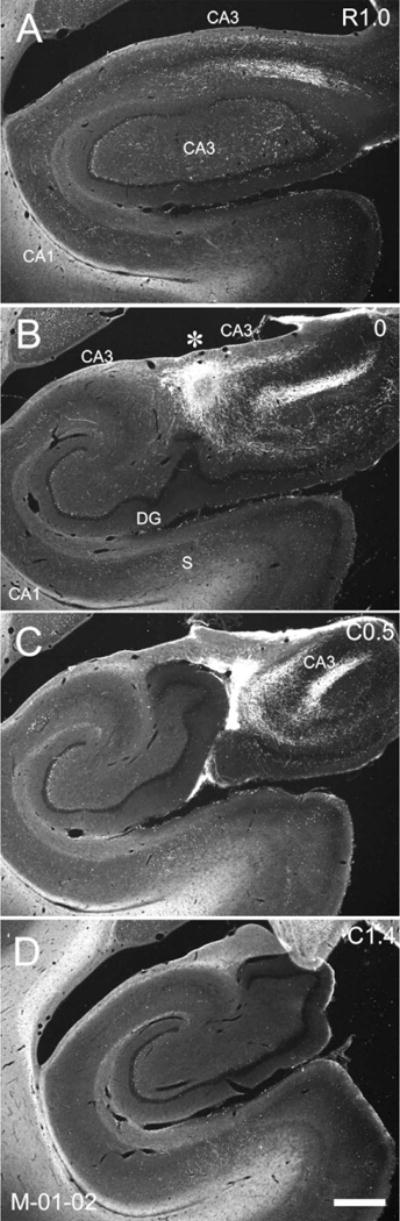
Darkfield photomicrographs of sections of the hippocampal formation arranged from rostral (A) to caudal (D) showing the distribution of PHA-L labeled fibers and terminals in case M-01-02. The injection is located in the uncus/genu portion of the hippocampal formation (asterisk in B). Note that CA3 projections to CA1 and CA3 are restricted to rostral levels of the hippocampus. Labeling is present in CA3 at the level of the uncus (B,C) and the genu (A) of the hippocampus. Scale bar = 1 mm.
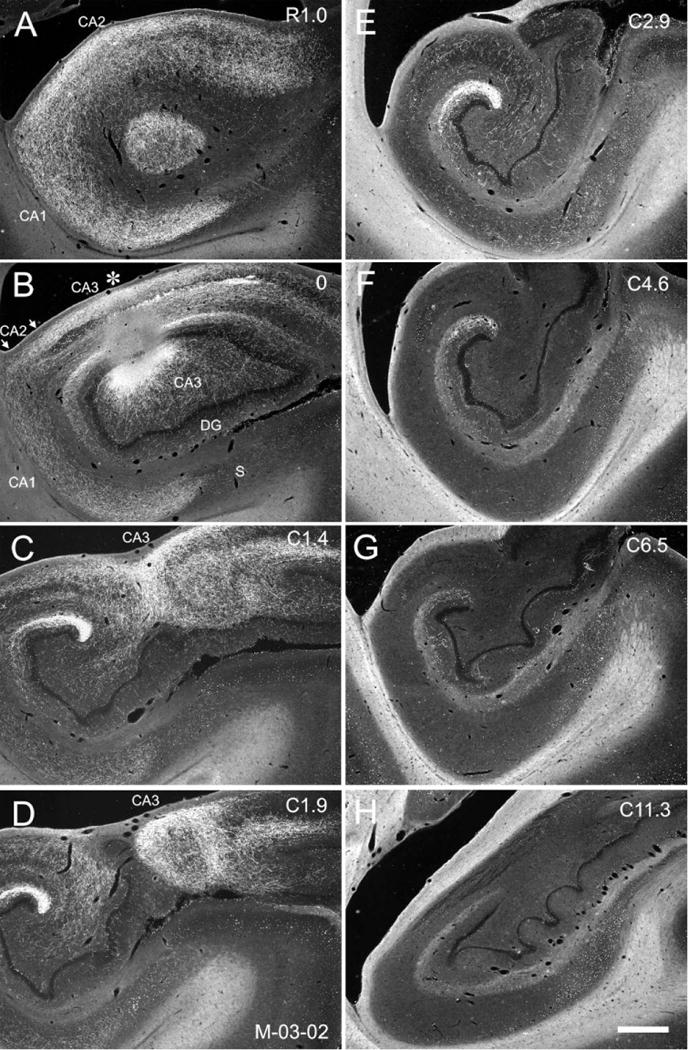
Figure 11.

Darkfield photomicrographs of sections of the hippocampal formation arranged from rostral (A) to caudal (H) showing the distribution of PHA-L labeled fibers and terminals in case M-02-02. The injection is located in the proximal portion of CA3 as well as in the adjacent dentate gyrus at the rostral portion of the body of the hippocampus (asterisk in B). Note that the CA3 projections to CA1 are distributed very extensively along the rostrocaudal axis. Typical of injections into the proximal part of CA3, the labeled fibers are denser in the superficial portions of terminal zones in CA1, CA2, and CA3. Scale bar = 1 mm.
We evaluated three cases in which the injections were located in the caudal third of CA3 (Table 1). In case M-10-02, the BDA injection in the proximal and mid-portions of CA3 gave rise to projections that were densest caudal to the level of the injection site (Fig. 12). The CA3 projections to CA1 in this case extended for ≈8.9 mm rostrally and 3.4 mm caudally to the injection site, for a total distance of 12.2 mm (≈84% of the rostrocaudal extent of the hippocampus). Taking all of the cases of the caudal injections together, the full length of the projections to CA1 ranged from 10.1–12.2 mm (from 74–89% of the rostrocaudal extent of the hippocampus).
Figure 12.
Darkfield photomicrographs of sections of the hippocampal formation arranged from rostral (A) to caudal (H) showing the distribution of BDA labeled fibers and terminals in case M-10-02. The injection is located in the proximal and mid-portions of CA3 as well as in the adjacent dentate gyrus at a caudal level through the hippocampus (asterisk in F). Note that the CA3 projections to CA1 and CA3 are extensive along the rostrocaudal axis. Stronger labeling is observed in the superficial portion of the terminal zone and becomes increasingly more restricted to this region at progressively more rostral levels from the injection site. Scale bar = 1 mm.
In sum, projection of CA3 pyramidal neurons located at the level of the genu and the uncus were largely limited to the rostral half of the hippocampus. In general, however, CA3 pyramidal neurons located in the body of the hippocampus gave rise to very extensive Schaffer collateral projections to CA1 that covered between 74–100% of the entire rostrocaudal length of the hippocampus (Table 1).
Radial gradient of CA3 projections to CA1
In the monkey, as in the rat, projections from CA3 are very extensive along the rostrocaudal axis of CA1. When these projections were analyzed in the rat (Ishizuka et al., 1990), there were both radial and transverse gradients to the pattern of fiber termination. And these patterns depended on the transverse location of the injection site. Thus, CA3 cells located proximally in CA3 tended to project more superficially in CA1 and more distally within the field. CA3 cells located closer to CA2 projected deeper within CA1 and more proximally within the field. The pattern of termination also varied in a systematic fashion as one proceeded septally or temporally from the level of the injection site. While we have seen evidence of these gradients of termination in the monkey hippocampus, they are nowhere near as clear-cut as in the rat brain.
When the injection is located proximally in CA3, the highest density of fiber and terminal labeling in CA1 is located in the superficial portion of the terminal zone (Fig. 6), although there is at least light labeling through much of the laminar extent of CA1. As one proceeds caudally from the level of the injection, there is a subtle shift from the superficial to the deep portion of the zone of fiber and terminal labeling (Fig. 6D–G), so that the labeling becomes more homogeneous throughout the termination zone. Conversely, as one proceeds rostrally from the level of the injection, fiber and terminal labeling consolidates within the superficial portion of stratum radiatum (Fig. 6A–D). A similar pattern of labeling was observed in cases in which the injection was located proximally in CA3 at rostral or caudal levels of the hippocampus (Figs. 11 and 12, respectively).
When the injection involved distal portions of the CA3 field, in contrast, the highest density of labeling was in the deeper portions of the zone of labeled fibers and terminals (Figs. 7, 9), i.e., within strata oriens and pyramidale, and the deep part of stratum radiatum. Figure 13 presents higher-magnification photomicrographs illustrating this difference in radial distribution of projections in cases with the proximal (case M-12-92; Fig. 13A,C) and distal CA3 (case M-03-02; Fig. 13B,D) injections. Injections involving mid-transverse regions of CA3 produced labeling that was distributed more or less evenly across all layers within CA1 (Fig. 5). A BDA injection that was nearly confined to the CA2 field (case M-10-93-R) revealed projections that were denser in the deep portions of the terminal zone in CA1, especially at levels caudal to the injection (Fig. 8). This pattern of labeling is therefore very similar to that seen following distal CA3 injections.
Figure 13.

This figure illustrates the different radial termination patterns determined by the location of injected CA3 pyramidal cells along the transverse axis. Darkfield photomicrographs (A,B) show the radial gradient of labeled fibers in CA1 after PHA-L injections in the proximal (A) and distal (B) portions of CA3 in cases M-12-92 and M-03-02, respectively. Adjacent Nissl-stained sections (C,D). Note that the density of labeled fibers is greater in the superficial layers (stratum radiatum) in the proximal injection (A), whereas labeled fiber density is greater in the deep layers in the distal injection (B). Scale bar = 250 μm.
Retrograde tracer injections in CA1
To obtain information on the distribution of CA3 cells projecting to a particular position within CA1, we carried out a series of six experiments in which the retrograde tracers CTB and FR were injected into various portions of CA1 (Table 3). An example of an injection site (Fig. 14A, asterisk) and retrogradely labeled cells (Fig. 14B) has been illustrated for case M-07-03, with an injection located at a mid-rostrocaudal level. The full distribution of retrogradely labeled cells for this case is represented in a series of line drawings of coronal sections (Fig. 15). Retrogradely labeled cells were observed throughout the CA3 and CA2 fields, for much of the rostrocaudal extent of the hippocampus. There was, however, some indication of topography to this projection. Thus, at the level of the genu, labeled cells were found within the proximal portion of CA3 but not within the distal portion (Fig. 15A). This indicates that cells in the proximal portion of CA3 project further caudally than cells in the distal portion of CA3. When one examines sections through caudal levels of this case, in contrast, labeled cells were observed in the distal portion of CA3 and CA2 but not in the proximal portion of CA3 (Fig. 15H). This again indicates that cells within the distal portion of CA3 in the caudal hippocampal formation give rise to more extensive projections in the rostral direction than cells within the proximal portion of CA3. Nevertheless, labeled cells were present throughout much of the rostrocaudal and transverse extent of the hippocampus (Fig. 15B–G).
Figure 14.
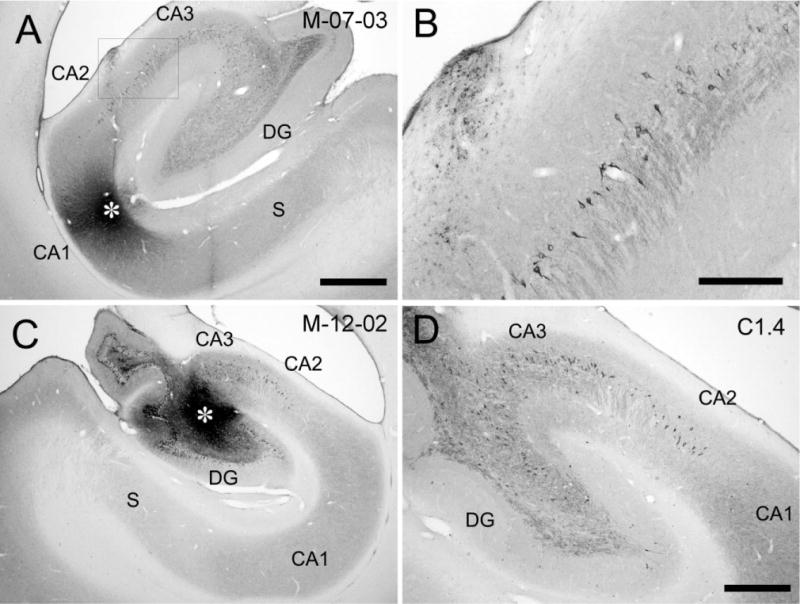
Brightfield photomicrographs of sections of the hippocampal formation showing a CTB injection in CA1 (A) and the resulting retrogradely labeled CA3 pyramidal cells (B) in case M-07-03-L. The injection is located at a mid-transverse portion of CA1 at a mid-rostrocaudal level of the hippocampus (asterisk in A). The box in A is shown at higher magnification in B and illustrates CTB-labeled pyramidal cells in the distal portion of CA3. C: Brightfield photomicrograph showing a CTB injection (asterisk) in the proximal portion of CA3 and labeled cells in CA3 and CA2 in case M-12-02-R (D). The section shown in D illustrates CTB-labeled pyramidal cells located 1.4 mm caudal to the injection. Scale bars = 1 mm in A (applies to C); 0.25 mm in B; 0.5 mm in D.
Figure 15.

Line drawing of sections through the hippocampal formation arranged from rostral (A) to caudal (H) illustrating the distribution of retrogradely labeled cells after a CTB injection in the mid-transverse portion at a mid-rostrocaudal level of CA1 (case M-07-03-L). The injection site is indicated by a black profile in panel D. Note that there are retrogradely labeled cells throughout much of the rostrocaudal extent of the hippocampus. Only the uncus is devoid of retrogradely labeled cells. Labeled cells are denser in the proximal portion of CA3 rostrally (A) and in the distal portion of CA3 caudally (H). Scale bar = 1 mm.
Similar patterns of retrogradely labeled cells were observed when the tracer injection was placed in rostral or caudal levels of CA1. Figure 16 shows the distribution of retrogradely labeled cells in CA3 and CA2 resulting from an FR injection in CA1 at the level of the genu (case M-01-01; Fig. 16A). Labeled cells in CA3 were observed at the level of the uncus (Fig. 16D), and as one proceeds caudally labeled cells were preferentially located in the distal portion of CA3 as well as in CA2. Figure 17 shows the distribution of retrogradely labeled cells in CA3 and CA2 after a CTB injection in the caudal portion of CA1 (case M-14-03). Large numbers of retrogradely labeled cells were observed for about 4 mm rostral to the level of the injection site and the labeled cells tended to be located preferentially in the proximal portion of CA3 at the more rostral levels. There were fewer retrogradely labeled cells caudal to the injection site and these tended to be located in the distal part of CA3.
Figure 16.
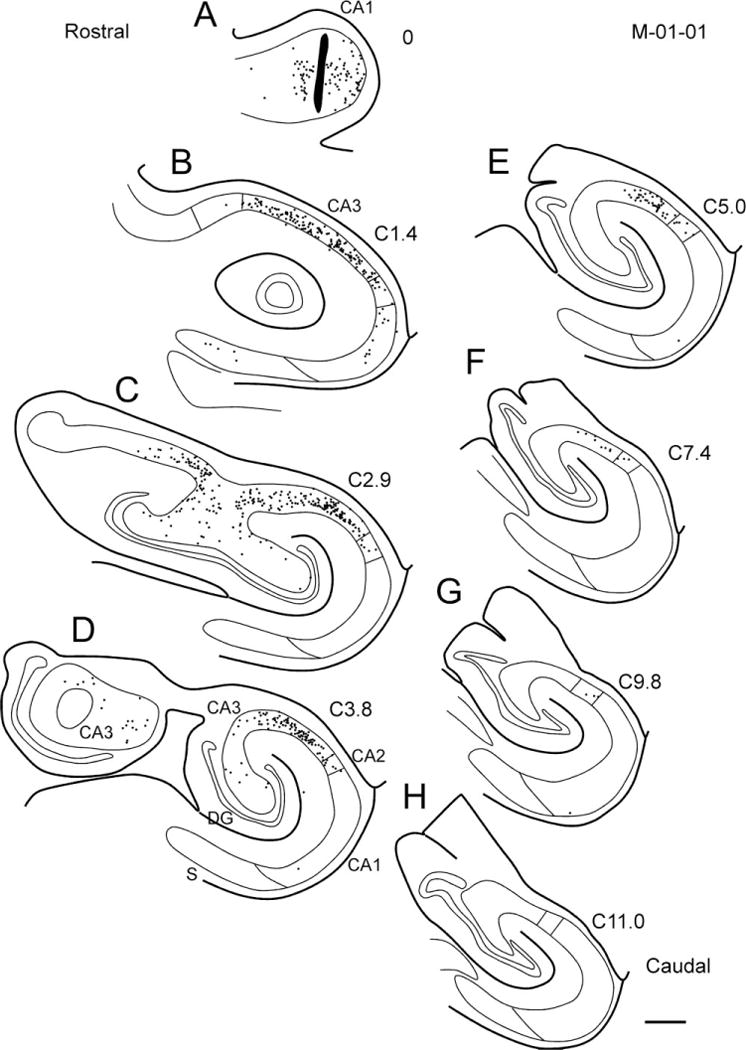
Line drawing of sections through the hippocampal formation arranged from rostral (A) to caudal (H) illustrating the distribution of retrogradely labeled cells after a Fluoro-Ruby injection into CA1 at the level of the genu (case M-01-01). The injection site is indicated by a black profile in panel A. Retrogradely labeled cells are more restricted to rostral portions of CA3 and CA2. Caudally, labeled cells are present in the distal but not the proximal portion of CA3. Scale bar = 1 mm.
Figure 17.
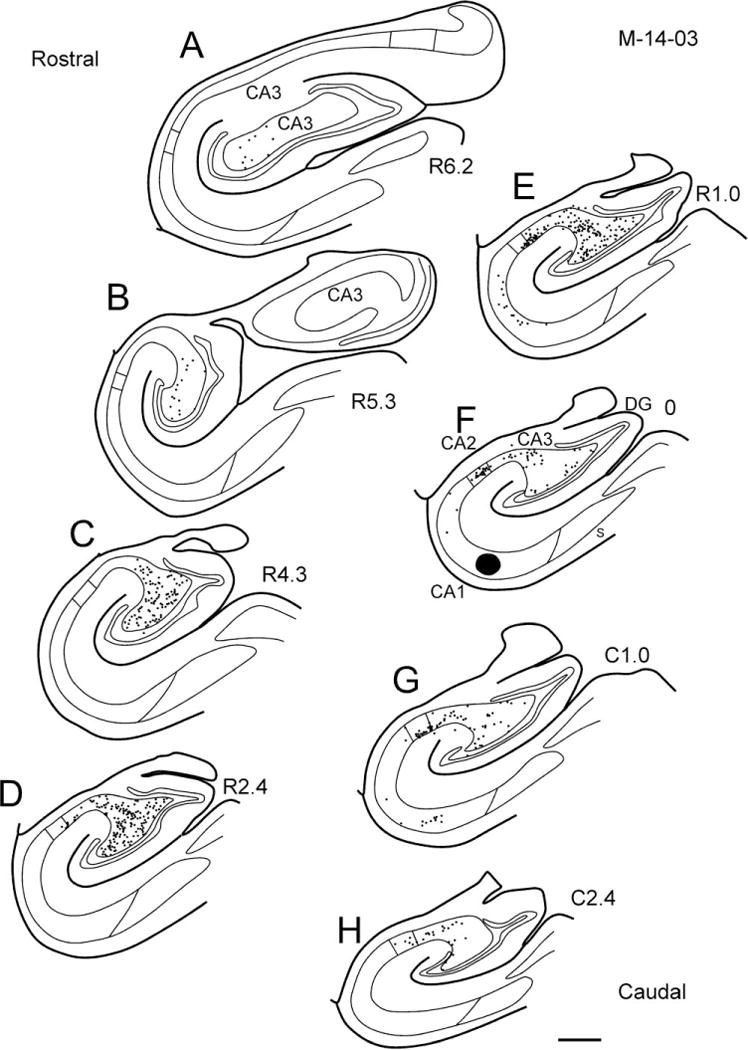
Line drawing of sections through the hippocampal formation arranged from rostral (A) to caudal (H) illustrating the distribution of retrogradely labeled cells resulting from a CTB injection in the caudal portion of CA1 (case M-14-03). The injection site is indicated as a black profile in F. Note that there are retrogradely labeled cells throughout much of the rostrocaudal extent of CA3 and CA2 that project to this caudal portion of CA1. At rostral levels, the labeled cells tend to be located in the proximal portion of CA3, whereas at caudal levels the labeled cells are preferentially located in distal CA3 and CA2. Scale bar = 1 mm.
CA3 projections to CA3 (associational projections)
An anterograde tracer injection into any rostrocaudal or transverse portion of CA3 gave rise to associational projections to CA3. As with the CA3 to CA1 projections, the CA3 associational projections were distributed extensively along the longitudinal axis (Table 2). However, the projections from CA3 to CA3 were overall less substantial than those from CA3 to CA1.
The general distribution of labeled axons and terminals in CA3 can be seen in a representative case (M-06-92) at the level of the injection site (Fig. 4). This PHA-L injection was in the mid-transverse portion of CA3 and labeled associational projections that terminated in the strata radiatum, oriens, and the pyramidal cell layer in CA3 and CA2. Few labeled fibers were observed in the stratum lucidum and the part of the pyramidal cell layer where the mossy fibers travel (Fig. 4). We observed that the most substantial associational connections resulted from injections located in the mid-transverse portion of CA3 (Fig. 5). Injections in the proximal portion of CA3 gave rise to rather weak associational projections (Fig. 6). While we only have one case with a BDA injection confined to CA2, it is clear that it also gives rise to associational projections to CA2 and CA3 (Fig. 8). The projections were heaviest to mid and distal portions of CA3 and much lighter to proximal portions.
Longitudinal projections from CA3 to CA3
As in the CA3 projection to CA1, one of the most striking findings of the CA3 associational projections to CA3 was how extensive they are distributed along the rostrocaudal axis. In case M-06-92 (Fig. 5), for example, the PHA-L injection gave rise to associational projections that extended ≈4.1 mm rostrally and 7.2 mm caudally for a total distance of 11.3 mm (82% of the full rostrocaudal extent of the hippocampus; Table 2). Labeled axons were more prominent in the stratum radiatum at rostral levels (Fig. 5A) and there was relatively meager labeling in the proximal portion of CA3 at caudal levels (Fig. 5E). Figure 5G also shows meager projections to distal CA3. In contrast to the CA3 projections to CA1, CA3 projections to CA3 were observed to be weaker as one moved caudally from the injection site (Fig. 5C–G). This observation was confirmed in several other cases (Figs. 6, 7).
The rostrocaudal distance of the associational projections arising from the proximal and distal portions of CA3 at the mid-rostrocaudal level was ≈11.0 and 12.7 mm, respectively (76% and 84% of the full rostrocaudal extent of the hippocampus, respectively; Table 2). Projections from CA2 to CA2 and CA3 were also extensive along the long axis, occupying 70% of the full rostrocaudal extent of the hippocampus (case M-10-93-R). For all mid-rostrocaudal injections, the total rostrocaudal distance of the CA3 associational projections ranged from 9.4–12.7 mm, average = 11.2 mm (or ≈76% of the full rostrocaudal extent of the hippocampus; Table 2).
As in the CA3 projections to CA1, CA3 associational projections to CA3 were also observed to be more restricted to the rostral portions of CA3 in cases in which the tracer was located at the level of the genu or the uncus (Fig. 10). In case M-03-02, a PHA-L injection in the distal portion of CA3 at the level of the genu gave rise to anterograde labeling in CA3 largely restricted to the level of the genu and uncus (Fig. 9B–D). The density of labeling in CA3 was lower as one proceeded caudal to the genu of the hippocampus (Fig. 9E). In case M-01-02, a PHA-L injection in CA3 at the level of the uncus produced restricted labeling in CA3 at the uncus and genu (Fig. 10). However, a PHA-L injection in the proximal portion of CA3, in the most rostral portion of the body of the hippocampus, gave rise to more extensive labeling in CA3, covering about 55% of the rostrocaudal extent of the hippocampus (Fig. 11; Table 2).
Figure 12 illustrates the projections from a BDA injection located at a mid-transverse level in the caudal third of CA3 (case M-10-02). Similar to the mid-rostrocaudal injection, labeling was found widely both rostrally and caudally along the long axis of the hippocampus (Fig. 12). At rostral levels, labeling was present in the superficial portion of the stratum radiatum (Fig. 12A,B). The projection extended for ≈12.5 mm rostrocaudally (85% of the full rostrocaudal extent of the hippocampus).
Radial gradient of CA3 associational projections
As in the CA3 projection to CA1, cells located proximally in CA3 projected more heavily to the superficial portion of the terminal zone (Figs. 6, 11), whereas cells in the mid and distal portions of CA3 give rise to more homogeneous projections throughout the terminal zone (Figs. 5, 7, 9). In many cases, labeled axons and terminals were observed mainly in stratum radiatum at rostral levels (Figs. 5, 6, 11).
Retrograde tracer injections in CA3
To identify the cells of origin of the CA3 associational projections, we made five retrograde tracer (CTB) injections into different portions of CA3. One of these injections and some of the retrogradely labeled CA3 cells are illustrated in Figure 14C,D. In this and all other cases with CA3 injections, labeled pyramidal cells were observed in CA3 and CA2 (Figs. 14D, 18). Figure 18 shows the distribution of retrogradely labeled cells in CA3 and CA2 resulting from a CTB injection in case M-12-02-R, located at mid-transverse and mid-rostrocaudal levels in CA3. Labeled cells were observed throughout the full rostrocaudal extent of CA3 except very caudally. Near the injection site, labeled cells were distributed throughout the full transverse extent of CA3 and CA2. The density of labeled cells was highest within 1 mm rostrocaudally of the injection site and decreased at progressively greater distances away from the injection site. As with the CA1 injections, labeled cells were mainly seen in distal portions of CA3 at caudal levels. In contrast, labeled cells were distributed through the entire transverse axis of CA3 at rostral levels.
Figure 18.
Line drawings of sections through the hippocampal formation arranged from rostral (A) to caudal (H) illustrating the distribution of retrogradely labeled cells resulting from a CTB injection in CA3 (case M-12-02-R). The injection site is located in the proximal-mid-portion of CA3 at a mid-rostrocaudal level of the hippocampus (black profile in E). Note that CA3 receives inputs from CA3 and CA2 cells located throughout much of the rostrocaudal extent of the hippocampal formation. As with the CA1 injections, labeled cells tend to be located distally at caudal levels and proximally at rostral levels. No labeled cells were present in CA1. Labeled cells in the dentate gyrus are not illustrated. Scale bar = 1 mm.
CA3 projections to the polymorphic layer of the dentate gyrus
Our library of injections was not opportune for evaluating back projections from CA3 to the dentate gyrus. In most cases, it was not possible to evaluate the projections from proximal CA3 to the dentate gyrus because the injections also involved the polymorphic or the granule cell layer. However, CA3 projections to the polymorphic layer were observed in some cases. An example of this is illustrated in Figures 4 and 5. In this case, a PHA-L injection was located in the mid-transverse portion at the mid-rostrocaudal level. A relatively small number of labeled axons were mostly observed in the polymorphic layer (Fig. 4). Very weak projections from CA3 to the polymorphic layer were observed in cases M-01-02, M-09-92, and M-10-93-R.
DISCUSSION
In the present study we investigated the topographical organization of the CA3 projections to CA1 and CA3 in the macaque monkey hippocampus using anterograde and retrograde tracers. The major findings of the present study are as follows. Any transverse portion of CA3 sends projections to CA1, CA2, and CA3. CA3 cells give rise to projections to CA1 (Schaffer collaterals) that distribute throughout the full transverse extent of CA1 and extensively along the rostrocaudal axis (Figs. 4, 19). These projections terminate in strata radiatum and oriens and the pyramidal cell layer. Projections generally extend more than three-fourths of the full rostrocaudal extent of the hippocampus (Fig. 19; Table 1). The only exception to this pattern was seen with projections originating from the uncus that are restricted to the rostral portion of CA1 (Fig. 19). These extensive longitudinal projections from CA3 to CA1 indicate that CA3 pyramidal neurons at any particular rostrocaudal level send divergent projections to CA1 pyramidal neurons at various rostrocaudal levels. Conversely, CA1 pyramidal neurons at any particular rostrocaudal level receive convergent projections from CA3 pyramidal neurons at various rostrocaudal levels. The associational projections from CA3 to CA3 are also distributed extensively along the longitudinal axis (Fig. 19). However, it appears that the overall projections from CA3 to CA3 are less substantial than those from CA3 to CA1. While we only had one case with an injection confined to CA2, the projections in that case to CA1, CA2, and CA3 are quite similar to those arising from distal CA3.
Figure 19.
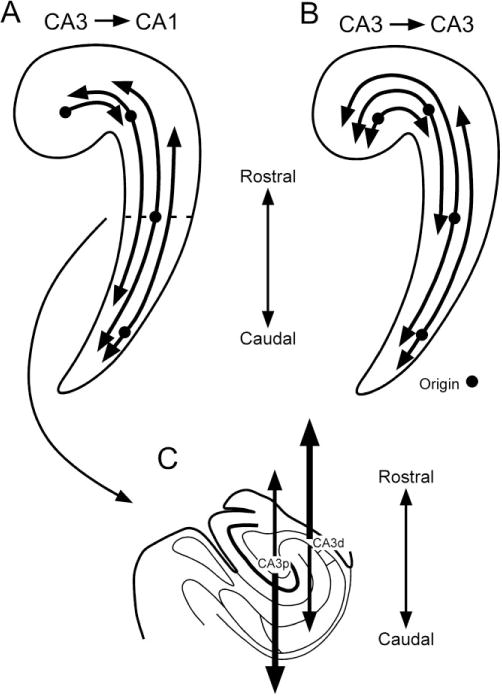
Summary diagrams showing CA3 projections to CA1 (A) and to CA3 (B) along the longitudinal axis. Representative origins of the projection are shown as circles. Note that the CA3 projections to CA1 and CA3 extend very widely both rostrally and caudally. However, the projections from CA3 cells at the level of the uncus are restricted to the rostral portions of the hippocampus. C: Proximal CA3 (CA3p) gives rise to more extensive projections in the caudal direction than distal CA3 (CA3d), whereas distal CA3 projects more extensively in the rostral direction than proximal CA3.
The termination of projections from CA3 to CA1 shows a radial gradient depending on the transverse location of the cells of origin (Fig. 13). Projections of proximal CA3 cells, i.e., those located near the dentate gyrus, tend to terminate more densely in the superficial portion of the terminal zone in CA1. Cells located distally in CA3, i.e., near CA1, in contrast, give rise to projections that are shifted toward the deep portion of the terminal zone. We also observed that proximal CA3 neurons project more extensively caudally than distal CA3 cells at the same rostrocaudal level, whereas distally located CA3 cells project more extensively rostrally than proximal CA3 cells.
Comparisons with previous studies in monkeys and humans
Previous studies of the CA3 projections to CA1 in the non-human primate are rather limited. Rosene and Van Hoesen (1977, 1987) used the autoradiographic method and clearly demonstrated that these projections exist in the monkey hippocampus. CA3 projects to the strata radiatum, oriens, and the pyramidal cell layer in CA1, CA2, and CA3 but not to the subiculum. They illustrated one case in which the injection was located in the uncus and showed that the projections from CA3 were directed caudally. And this caudally directed projection was restricted to the rostral portion of the hippocampus (Rosene and Van Hoesen, 1987). This result is consistent with ours showing that the uncal portion of CA3 has limited connections with the genu and the rostral body of the hippocampus. We further demonstrated that all portions of CA3 within the body of the hippocampus gave rise to extensive projections in both rostral and caudal directions and that the CA3 projections showed distinct topographic organization depending on the transverse location of the cells of origin.
Buckmaster and Amaral (2001) demonstrated, using an intracellular injection technique with biocytin in the monkey hippocampal slice, that single proximal CA3 pyramidal cells give rise to collateral projections toward CA1 and to the polymorphic layer of the dentate gyrus. Although in the present study it was not possible to comprehensively evaluate back projections from proximal CA3 to the dentate gyrus, many cases provided evidence for CA3 projections to at least the polymorphic layer. Buckmaster and Amaral (2001) described three morphologically different types of proximal CA3 pyramidal cells in monkeys. All three types of pyramidal cells of proximal CA3 were found to send Schaffer collaterals toward CA1 and projections to the polymorphic layer of the dentate gyrus. One type of proximal CA3 pyramidal cell in monkeys extended their apical dendrites in the granule cell and molecular layers of the dentate gyrus, which has not been described in rats. Further, they showed that the electrophysiological characteristics of the proximal CA3 pyramidal cells were different from that of the dentate gyrus mossy cells. In the present study, labeled cells were observed continuously from distal CA3 and CA2 to proximal CA3 but not in the polymorphic layer of the dentate gyrus after retrograde tracer injections in CA1. Together with the morphological and neurochemical differences between mossy cells and proximal CA3 cells (Buckmaster and Amaral, 2001), these results provide further evidence that proximal CA3 is distinct from the polymorphic layer of the dentate gyrus.
A study by Lim et al. (1997) provided a unique glimpse of the projections of the CA3 region in the human hippocampus. These investigators used either Dil in fixed human hippocampal tissues or biocytin in the in vitro hippocampal slice preparation to place tracer injections into various regions of the CA3 field. Axons originating from the proximal portion of CA3 were seen to project via the alveus and stratum oriens in CA3 in what was called the endfolial fiber pathway. Then, these axons cross the pyramidal cell layer in distal CA3 and terminate in the stratum radiatum of CA1. The endfolial fiber projection shows a laminar organization parallel to the transverse axis until it reaches distal CA3 and changes direction in the longitudinal axis after crossing the CA3 pyramidal cell layer. In addition, injections into the granule cell layer or the polymorphic layer of the dentate gyrus failed to label the endfolial fiber projections, suggesting that these projections originate from proximal CA3. None of the pathways that we observed emanating from the proximal portion of the CA3 field in the monkey had this trajectory, raising the prospect that this pathway is unique to the human hippocampal formation.
Comparisons with previous studies in rats
A number of previous neuroanatomical studies have shown that the CA3 region of the rat hippocampus gives rise to projections to CA1, CA2, and CA3 (Hjorth-Simonsen, 1973; Swanson et al., 1978; Laurberg, 1979; Laurberg and Sorensen, 1981; Finch et al., 1983; Amaral and Witter, 1989; Ishizuka et al., 1990; Li et al., 1994; Wittner et al., 2007). A true appreciation of the complexity of the projections originating from CA3 cells comes from the elegant work of Wittner et al. (2007). They intracellularly injected biocytin into CA3 cells in the intact, in vivo rat hippocampus and quantitatively measured the axonal extent in serial coronal sections through the entire hippocampus. In one highlighted CA3 pyramidal neuron located in proximal CA3, axonal collaterals were observed to extend for two-thirds of the longitudinal extent of CA1. This neuron gave rise to an axonal plexus that, in aggregate, exceeded one-half meter in length and generated at least 40,000 synaptic boutons. Interestingly, while 70% of the axonal length was distributed to CA1, only about 28% was distributed to CA3. This matches our impression from observations in the monkey that CA3 projections to CA1 are much more substantial than those to CA3.
Previous studies in the rat have demonstrated that the CA3 projections to CA1 and CA3 extend very widely along the septotemporal axis (corresponding to the rostrocaudal axis in the monkey) (Hjorth-Simonsen, 1973; Swanson et al., 1978; Laurberg, 1979; Laurberg and Sorensen, 1981; Amaral and Witter, 1989; Ishizuka et al., 1990; Li et al., 1994; Wittner et al., 2007). Projections consistently were shown to innervate approximately two-thirds of the full septotemporal extent of the CA1 and CA3 fields (Swanson et al., 1978; Ishizuka et al., 1990; Li et al., 1994; Wittner et al., 2007). Our results in the monkey are in good agreement with these findings in the rat. An exception to the widespread longitudinal projections is found in the temporal portion of the rat hippocampus. Anterograde tracer injections in the temporal part of CA3 give rise to restricted projections only to the temporal portions of CA1 and CA3 in rats (Swanson et al., 1978; Ishizuka et al., 1990). Again, our findings in the monkey with injections in the most rostral portion of the CA3 field, specifically the uncus and the genu, are quite similar. Thus, whereas neurons in the septal two-thirds in the rat and the caudal two-thirds of the monkey hippocampus are extensively interconnected, neurons located in the temporal third of the rat or the rostral extreme of the monkey hippocampus have a much more limited spatial interaction with other hippocampal pyramidal cells in the same fields.
Previous studies of the rat CA3 region show the exquisite topography of its projections to CA1 and CA3 (Hjorth-Simonsen, 1973; Swanson et al., 1978; Laurberg, 1979; Amaral and Witter, 1989; Ishizuka et al., 1990; Li et al., 1994; Wittner et al., 2007). Ishizuka et al. (1990) found, for example, that at, or close to, the septotemporal level of the cells of origin, those cells located proximally in CA3 give rise to collaterals that tend to terminate superficially in the stratum radiatum and distally within CA1. Conversely, cells located more distally in CA3 give rise to projections that terminate deeper in the stratum radiatum and stratum oriens in the proximal portion of CA1. This laminar and transverse topography was not nearly as clear in preparations from the macaque monkey. It is true that there was a laminar preference of the termination field, depending on the origin of the projection (Fig. 13), and this resembled the observations in the rat brain. But, regardless of the transverse location of the injection in CA3, the transverse distribution of fiber and terminal labeling within CA1 was fairly widespread. As for the rostrocaudal topography in the monkey, proximal CA3 projects to CA1 more extensively in the caudal direction than distal CA3 at the same rostrocaudal level. Conversely, distal CA3 projects more extensively in the rostral direction than proximal CA3. This is consistent with the findings in the rat that the terminal zone in CA1 is shifted to the septal direction as the injection moves from the distal to proximal portion of CA3 (Ishizuka et al., 1990).
Previous studies in rats showed that CA3 gives rise to projections back to the polymorphic layer of the dentate gyrus (Ishizuka et al., 1990; Li et al., 1994). Proximal and ventral portions of CA3 have more numerous collaterals to the polymorphic layer of the dentate gyrus than distal and dorsal portions of CA3 (Li et al., 1994). In the present study, we were not able to evaluate the projections from the proximal or rostral part of CA3 to the polymorphic layer of the dentate gyrus because our proximal injections involved the dentate gyrus. However, we did see evidence of very light projections to the polymorphic layer following injections located at mid-transverse portion of CA3 at mid-rostrocaudal levels of the hippocampus; this is consistent with findings reported by Li et al. (1994) in rats.
In rats, CA2 projects to CA1, CA2, and CA3 and the pattern of CA2 connections is similar to that of distal CA3 (Ishizuka et al., 1990). This is consistent with present results in monkeys, suggesting that the CA2 region in both species more resembles the distal portion of CA3 than CA1 in its intrinsic connectivity.
Functional considerations
Both the CA3 and the CA1 regions of the hippocampus receive projections from the entorhinal cortex (Witter and Amaral, 1991). CA3 receives projections mainly from layer II cells within the entorhinal cortex while CA1 receives projections mainly from layer III entorhinal cells (Steward and Scoville, 1976; Witter and Amaral, 1991). Beyond these parallel entorhinal connections, the CA3 field receives major but limited projections from the mossy fibers of the dentate gyrus. In the rat, for example, only about 60 granule cells synapse with a particular pyramidal cell (Amaral et al., 1990). The major input to CA3 cells is from other CA3 cells; it has been estimated that as many as 80% of the synapses on a typical CA3 pyramidal cell originates from the association projections from other CA3 neurons (Amaral and Witter, 1989). The CA1 field of the hippocampus receives its major input from CA3 cells rather than other CA1 cells (Ishizuka et al., 1990). In fact, CA1 neurons have few, if any, recurrent collaterals (Amaral et al., 1991).
The CA3 field is thought to play a critical role in the formation and retrieval of certain forms of memory (Rolls, 1996, 2007). The extensive associational connections have prompted theorists to conclude that the neuroanatomy of the CA3 associative network is ideal for forming new associations between ongoing experiences and substantial research is consistent with this view. In primates, Rolls and colleagues (Rolls et al., 2005; Rolls and Xiang, 2005) have demonstrated, for example, that single neurons in the primate hippocampus including CA3 and CA1 can respond to the combination of spatial view and specific object or of spatial view and reward. They also suggested that CA1 then recodes information from CA3 and conveys associatively learned information back to the neocortex. Interestingly, Nakashiba et al. (2008) have recently used transgenic mouse models to dissociate the contribution of CA3 and CA1 to memory production. By selectively turning CA3 “on and off,” they demonstrated that CA3 is not essential for spatial learning and recall in the standard “place learning” procedure of the Morris water maze. This behavior could presumably be mediated by direct projections from the entorhinal cortex to CA1. However, CA3 was essential for rapid one-trial contextual fear learning, for pattern completion based memory recall, and for spatial tuning of CA1 cells during exploration of a novel environment. Other evidence in the mouse demonstrates that disruption of the activation of the CA3 to CA1 synapse can markedly impair associative conditioning (Gruart et al., 2006). The body of literature addressing the differential role and computation of CA3 and CA1 is vast (Leutgeb et al., 2004; Nakazawa et al., 2004) and ultimately relies on the distinctive neuroanatomy of the CA3 associational projections and the CA3 projections to CA1 as well as the differential inputs from layers II and III of the entorhinal cortex. Most of these data were based on findings in the rat but the results of the studies reported in the current article provide confirmation that the general principles of these connections are similar in the nonhuman primate brain and thus presumably the human hippocampus. One would expect, therefore, that the human CA3 and CA1 region would be carrying out computations similar to those demonstrated in the rodent brain.
One of the neuroanatomical principles that are preserved across species is that CA3 neurons convey information along much of the rostrocaudal axis of the hippocampus. Thus, a CA3 pyramidal cell or a CA1 pyramidal cell located in the middle of the hippocampus could potentially receive synaptic input from other CA3 cells located throughout the caudal three-fourths of the hippocampus. What would happen if the longitudinal component of the CA3 projections was transected? According to Steffenach et al. (2002), this greatly impairs the retention of spatial memory in rats. They found that disruption of the longitudinal CA3 projections in the septal hippocampus of rats, which produced only a 3% loss of hippocampal volume, nonetheless massively disrupted pre-operatively learned spatial information from the water maze. The exact micro-organization of the longitudinal pathways has not yet been worked out in detail. Previous multielectrode recording studies suggested that there may be a periodicity to neuronal response patterns along the long axis of the hippocampus (Hampson et al., 1999). However, neither our own data (Ishizuka et al., 1990) nor intracellular labeling studies (Wittner et al., 2007) strongly suggest an orderly periodic distribution of CA3 axon terminals along the long axis of the hippocampus. It thus remains a challenge to adequately model how information flow along the long axis of the hippocampus contributes to normal associative function.
One other principle of organization that is conserved between rodents and nonhuman primates is that the ventral hippocampus in rodents or the most rostral portion of the hippocampus in monkeys (i.e., the genu and the uncus) is less connected with other regions of the hippocampus and has its own associational system of connections. Increasingly, the septal two-thirds of the rat hippocampus is thought to play a more prominent role in spatial learning (Moser and Moser, 1998; Bannerman et al., 2004). In the monkey, Colombo et al. (1998) have explicitly recorded neurons from different rostrocaudal levels of the hippocampus while the experimental animals are performing a spatial memory task. The authors concluded that the hippocampus is functionally heterogeneous and that posterior regions may be more important for processing spatial information. More recently, several investigators have concluded that the ventral hippocampus in rats plays a role in emotional processing particularly of fear and anxiety (Kjelstrup et al., 2002; Bannerman et al., 2003).
To conclude, it is not a foregone conclusion that the neu-roanatomy of the nonhuman primate hippocampal formation will be similar to that observed in the rodent brain. The lack of commissural connections in the caudal two-thirds of the primate and human hippocampus (Amaral et al., 1984; Wilson et al., 1987) is a striking difference from the situation in the rodent brain. However, our recent analysis of the connections of the dentate gyrus (Kondo et al., 2008) and the current study of the projections of CA3 both suggest that the major intrinsic connections of the dentate gyrus and hippocampus are quite similar across species. Thus, functional analyses of these intrinsic connections in the rodent brain should produce data that are quite appropriate for extrapolation to the human brain.
Acknowledgments
The authors thank Jeffery L. Bennett and Pamela C. Tennant for surgical and immunohistochemical assistance and José R. Alonso, Jennifer L. Freese, Pamela Banta Lavenex, Brian W. Leonard, Lisa Stefanacci, and Wendy A. Suzuki for surgical assistance.
Grant sponsor: National Institutes of Health (NIH); Grant number: R01-NS16980 (to D.G.A.); Grant sponsor: Swiss National Science Foundation; Grant number: PP00A-106701 (to P.L.). The work was conducted, in part, at the California National Primate Research Center (RR00169).
LITERATURE CITED
- Amaral DG, Lavenex P. Hippocampal neuroanatomy. In: Andersen P, Morris R, Amaral D, Bliss T, O’Keefe J, editors. The hippocampus book. New York: Oxford University Press; 2007. pp. 37–114. [Google Scholar]
- Amaral DG, Witter MP. The three-dimensional organization of the hippocampal formation: a review of anatomical data. Neuroscience. 1989;31:571–591. doi: 10.1016/0306-4522(89)90424-7. [DOI] [PubMed] [Google Scholar]
- Amaral DG, Insausti R, Cowan WM. The commissural connections of the monkey hippocampal formation. J Comp Neurol. 1984;224:307–336. doi: 10.1002/cne.902240302. [DOI] [PubMed] [Google Scholar]
- Amaral DG, Ishizuka N, Claiborne B. Neurons, numbers and the hippocampal network. Prog Brain Res. 1990;83:1–11. doi: 10.1016/s0079-6123(08)61237-6. [DOI] [PubMed] [Google Scholar]
- Amaral DG, Dolorfo C, Alvarez-Royo P. Organization of CA1 projections to the subiculum: a PHA-L analysis in the rat. Hippocampus. 1991;1:415–435. doi: 10.1002/hipo.450010410. [DOI] [PubMed] [Google Scholar]
- Bannerman DM, Grubb M, Deacon RM, Yee BK, Feldon J, Rawlins JN. Ventral hippocampal lesions affect anxiety but not spatial learning. Behav Brain Res. 2003;139:197–213. doi: 10.1016/s0166-4328(02)00268-1. [DOI] [PubMed] [Google Scholar]
- Bannerman DM, Rawlins JN, McHugh SB, Deacon RM, Yee BK, Bast T, Zhang WN, Pothuizen HH, Feldon J. Regional dissociations within the hippocampus—memory and anxiety. Neurosci Biobehav Rev. 2004;28:273–283. doi: 10.1016/j.neubiorev.2004.03.004. [DOI] [PubMed] [Google Scholar]
- Buckmaster PS, Amaral DG. Intracellular recording and labeling of mossy cells and proximal CA3 pyramidal cells in macaque monkeys. J Comp Neurol. 2001;430:264–281. doi: 10.1002/1096-9861(20010205)430:2<264::aid-cne1030>3.0.co;2-3. [DOI] [PubMed] [Google Scholar]
- Colombo M, Fernandez T, Nakamura K, Gross CG. Functional differentiation along the anterior-posterior axis of the hippocampus in monkeys. J Neurophysiol. 1998;80:1002–1005. doi: 10.1152/jn.1998.80.2.1002. [DOI] [PubMed] [Google Scholar]
- Finch DM, Nowlin NL, Babb TL. Demonstration of axonal projections of neurons in the rat hippocampus and subiculum by intracellular injection of HRP. Brain Res. 1983;271:201–216. doi: 10.1016/0006-8993(83)90283-4. [DOI] [PubMed] [Google Scholar]
- Gruart A, Munoz MD, Delgado-Garcia JM. Involvement of the CA3-CA1 synapse in the acquisition of associative learning in behaving mice. J Neurosci. 2006;26:1077–1087. doi: 10.1523/JNEUROSCI.2834-05.2006. [DOI] [PMC free article] [PubMed] [Google Scholar]
- Hampson RE, Simeral JD, Deadwyler SA. Distribution of spatial and nonspatial information in dorsal hippocampus. Nature. 1999;402:610–614. doi: 10.1038/45154. [DOI] [PubMed] [Google Scholar]
- Hjorth-Simonsen A. Some intrinsic connections of the hippocampus in the rat: an experimental analysis. J Comp Neurol. 1973;147:145–161. doi: 10.1002/cne.901470202. [DOI] [PubMed] [Google Scholar]
- Ishizuka N, Weber J, Amaral DG. Organization of intrahippocampal projections originating from CA3 pyramidal cells in the rat. J Comp Neurol. 1990;295:580–623. doi: 10.1002/cne.902950407. [DOI] [PubMed] [Google Scholar]
- Kjelstrup KG, Tuvnes FA, Steffenach HA, Murison R, Moser EI, Moser MB. Reduced fear expression after lesions of the ventral hippocampus. Proc Natl Acad Sci U S A. 2002;99:10825–10830. doi: 10.1073/pnas.152112399. [DOI] [PMC free article] [PubMed] [Google Scholar]
- Kobayashi Y, Amaral DG. Chemical neuroanatomy of the hippocampal formation and the perirhinal and parahippocampal cortices. Handbook Chem Neuroanat. 1999;15:285–337. [Google Scholar]
- Kondo H, Lavenex P, Amaral DG. Intrinsic connections of the macaque monkey hippocampal formation: I. Dentate gyrus. J Comp Neurol. 2008;511:497–520. doi: 10.1002/cne.21825. [DOI] [PMC free article] [PubMed] [Google Scholar]
- Laurberg S. Commissural and intrinsic connections of the rat hippocampus. J Comp Neurol. 1979;184:685–708. doi: 10.1002/cne.901840405. [DOI] [PubMed] [Google Scholar]
- Laurberg S, Sorensen KE. Associational and commissural collaterals of neurons in the hippocampal formation (hilus fasciae dentatae and subfield CA3) Brain Res. 1981;212:287–300. doi: 10.1016/0006-8993(81)90463-7. [DOI] [PubMed] [Google Scholar]
- Lavenex P, Amaral DG. Hippocampal-neocortical interaction: a hierarchy of associativity. Hippocampus. 2000;10:420–430. doi: 10.1002/1098-1063(2000)10:4<420::AID-HIPO8>3.0.CO;2-5. [DOI] [PubMed] [Google Scholar]
- Lavenex PB, Lavenex P. Spatial memory and the monkey hippocampus: Not all space is created equal. Hippocampus. 2008;19:8–19. doi: 10.1002/hipo.20485. [DOI] [PubMed] [Google Scholar]
- Lavenex P, Suzuki WA, Amaral DG. Perirhinal and parahippocampal cortices of the macaque monkey: projections to the neocortex. J Comp Neurol. 2002;447:394–420. doi: 10.1002/cne.10243. [DOI] [PubMed] [Google Scholar]
- Lavenex P, Lavenex PB, Amaral DG. Nonphosphorylated high-molecular-weight neurofilament expression suggests early maturation of the monkey subiculum. Hippocampus. 2004a;14:797–801. doi: 10.1002/hipo.20028. [DOI] [PubMed] [Google Scholar]
- Lavenex P, Suzuki WA, Amaral DG. Perirhinal and parahippocampal cortices of the macaque monkey: intrinsic projections and interconnections. J Comp Neurol. 2004b;472:371–394. doi: 10.1002/cne.20079. [DOI] [PubMed] [Google Scholar]
- Lavenex PB, Amaral DG, Lavenex P. Hippocampal lesion prevents spatial relational learning in adult macaque monkeys. J Neurosci. 2006;26:4546–4558. doi: 10.1523/JNEUROSCI.5412-05.2006. [DOI] [PMC free article] [PubMed] [Google Scholar]
- Lavenex P, Banta Lavenex P, Amaral DG. Postnatal development of the primate hippocampal formation. Dev Neurosci. 2007;29:179–192. doi: 10.1159/000096222. [DOI] [PubMed] [Google Scholar]
- Lavenex P, Lavenex PB, Bennett JL, Amaral DG. Postmortem changes in the neuroanatomical characteristics of the primate brain: hippocampal formation. J Comp Neurol. 2009;512:27–51. doi: 10.1002/cne.21906. [DOI] [PMC free article] [PubMed] [Google Scholar]
- Leutgeb S, Leutgeb JK, Treves A, Moser MB, Moser EI. Distinct ensemble codes in hippocampal areas CA3 and CA1. Science. 2004;305:1295–1298. doi: 10.1126/science.1100265. [DOI] [PubMed] [Google Scholar]
- Li XG, Somogyi P, Ylinen A, Buzsaki G. The hippocampal CA3 network: an in vivo intracellular labeling study. J Comp Neurol. 1994;339:181–208. doi: 10.1002/cne.903390204. [DOI] [PubMed] [Google Scholar]
- Lim C, Mufson EJ, Kordower JH, Blume HW, Madsen JR, Saper CB. Connections of the hippocampal formation in humans: II. The endfolial fiber pathway. J Comp Neurol. 1997;385:352–371. [PubMed] [Google Scholar]
- Milner B, Squire LR, Kandel ER. Cognitive neuroscience and the study of memory. Neuron. 1998;20:445–468. doi: 10.1016/s0896-6273(00)80987-3. [DOI] [PubMed] [Google Scholar]
- Moser MB, Moser EI. Functional differentiation in the hippocampus. Hippocampus. 1998;8:608–619. doi: 10.1002/(SICI)1098-1063(1998)8:6<608::AID-HIPO3>3.0.CO;2-7. [DOI] [PubMed] [Google Scholar]
- Nakashiba T, Young JZ, McHugh TJ, Buhl DL, Tonegawa S. Transgenic inhibition of synaptic transmission reveals role of CA3 output in hippocampal learning. Science. 2008;319:1260–1264. doi: 10.1126/science.1151120. [DOI] [PubMed] [Google Scholar]
- Nakazawa K, McHugh TJ, Wilson MA, Tonegawa S. NMDA receptors, place cells and hippocampal spatial memory. Nat Rev Neurosci. 2004;5:361–372. doi: 10.1038/nrn1385. [DOI] [PubMed] [Google Scholar]
- Pitkanen A, Amaral DG. Distribution of parvalbumin-immunoreactive cells and fibers in the monkey temporal lobe: the hippocampal formation. J Comp Neurol. 1993;331:37–74. doi: 10.1002/cne.903310104. [DOI] [PubMed] [Google Scholar]
- Rolls ET. A theory of hippocampal function in memory. Hippocampus. 1996;6:601–620. doi: 10.1002/(SICI)1098-1063(1996)6:6<601::AID-HIPO5>3.0.CO;2-J. [DOI] [PubMed] [Google Scholar]
- Rolls ET. An attractor network in the hippocampus: theory and neurophysiology. Learn Mem. 2007;14:714–731. doi: 10.1101/lm.631207. [DOI] [PubMed] [Google Scholar]
- Rolls ET, Xiang JZ. Reward-spatial view representations and learning in the primate hippocampus. J Neurosci. 2005;25:6167–6174. doi: 10.1523/JNEUROSCI.1481-05.2005. [DOI] [PMC free article] [PubMed] [Google Scholar]
- Rolls ET, Xiang J, Franco L. Object, space, and object-space representations in the primate hippocampus. J Neurophysiol. 2005;94:833–844. doi: 10.1152/jn.01063.2004. [DOI] [PubMed] [Google Scholar]
- Rosene DL, Van Hoesen GW. Hippocampal efferents reach widespread areas of cerebral cortex and amygdala in the rhesus monkey. Science. 1977;198:315–317. doi: 10.1126/science.410102. [DOI] [PubMed] [Google Scholar]
- Rosene DL, Van Hoesen GW. The hippocampal formation of the primate brain. A review of some comparative aspects of cytoarchitecture and connections. In: Jones EG, Peters A, editors. Cerebral cortex. New York: Plenum; 1987. pp. 345–456. [Google Scholar]
- Squire LR, Zola SM. Structure and function of declarative and nondeclarative memory systems. Proc Natl Acad Sci U S A. 1996;93:13515–13522. doi: 10.1073/pnas.93.24.13515. [DOI] [PMC free article] [PubMed] [Google Scholar]
- Steffenach HA, Sloviter RS, Moser EI, Moser MB. Impaired retention of spatial memory after transection of longitudinally oriented axons of hippocampal CA3 pyramidal cells. Proc Natl Acad Sci U S A. 2002;99:3194–3198. doi: 10.1073/pnas.042700999. [DOI] [PMC free article] [PubMed] [Google Scholar]
- Steward O, Scoville SA. Cells of origin of entorhinal cortical afferents to the hippocampus and fascia dentata of the rat. J Comp Neurol. 1976;169:347–370. doi: 10.1002/cne.901690306. [DOI] [PubMed] [Google Scholar]
- Swanson LW, Wyss JM, Cowan WM. An autoradiographic study of the organization of intrahippocampal association pathways in the rat. J Comp Neurol. 1978;181:681–715. doi: 10.1002/cne.901810402. [DOI] [PubMed] [Google Scholar]
- Szabo J, Cowan WM. A stereotaxic atlas of the brain of the cynomolgus monkey (Macaca fascicularis) J Comp Neurol. 1984;222:265–300. doi: 10.1002/cne.902220208. [DOI] [PubMed] [Google Scholar]
- Wilson CL, Isokawa-Akesson M, Babb TL, Engel J, Jr, Cahan LD, Crandall PH. A comparative view of local and interhemispheric limbic pathways in humans: an evoked potential analysis. In: Engel J Jr, editor. Fundamental mechanisms of human brain function: opportunities of direct investigation in association with the surgical treatment of epilepsy. New York: Raven Press; 1987. [Google Scholar]
- Witter MP. Intrinsic and extrinsic wiring of CA3: indications for connectional heterogeneity. Learn Mem. 2007;14:705–713. doi: 10.1101/lm.725207. [DOI] [PubMed] [Google Scholar]
- Witter MP, Amaral DG. Entorhinal cortex of the monkey: V. Projections to the dentate gyrus, hippocampus, and subicular complex. J Comp Neurol. 1991;307:437–459. doi: 10.1002/cne.903070308. [DOI] [PubMed] [Google Scholar]
- Wittner L, Henze DA, Zaborszky L, Buzsaki G. Three-dimensional reconstruction of the axon arbor of a CA3 pyramidal cell recorded and filled in vivo. Brain Struct Funct. 2007;212:75–83. doi: 10.1007/s00429-007-0148-y. [DOI] [PMC free article] [PubMed] [Google Scholar]