

Abstract
Key points
Kv7 (KCNQ/M) channels are known to control excitability and generate subthreshold M-resonance in CA1 hippocampal pyramidal cells, but their properties and functions have not previously been compared along the dorsoventral (septotemporal) axis
We used whole-cell recordings to compare electrophysiological properties of dorsal and ventral CA1 pyramidal cells in hippocampal slices from 3- to 4-week-old rats
Blockade of Kv7/M-channels with 10,10-bis(4-pyridinylmethyl)-9(10H)-anthracenone dihydrochloride (XE991) had a stronger impact on electrical properties in dorsal than ventral pyramidal cells, including input resistance, temporal summation, M-resonance, spike threshold, medium after-hyperpolarization, excitability, and spike frequency adaptation.
Voltage-clamp recordings revealed a larger amplitude and left-shifted voltage dependence of XE991-sensitive current (IM) in dorsal vs. ventral cells.
IM-dependent differences in excitability and resonance may be important for rate and phase coding of CA1 place cells along the dorsoventral axis and may enhance epileptiform activity in ventral pyramidal cells.
Abstract
In rodent hippocampi, the connections, gene expression and functions differ along the dorsoventral (D–V) axis. CA1 pyramidal cells show increasing excitability along the D–V axis, although the underlying mechanism is not known. In the present study, we investigated how the M-current (IM), caused by Kv7/M (KCNQ) potassium channels, and known to often control neuronal excitability, contributes to D–V differences in intrinsic properties of CA1 pyramidal cells. Using whole-cell patch clamp recordings and the selective Kv7/M blocker 10,10-bis(4-pyridinylmethyl)-9(10H)-anthracenone dihydrochloride (XE991) in hippocampal slices from 3- to 4-week-old rats, we found that: (i) IM had a stronger impact on subthreshold electrical properties in dorsal than ventral CA1 pyramidal cells, including input resistance, temporal summation of artificial synaptic potentials, and M-resonance; (ii) IM activated at more negative potentials (left-shifted) and had larger peak amplitude in the dorsal than ventral CA1; and (iii) the initial spike threshold (during ramp depolarizations) was elevated, and the medium after-hyperpolarization and spike frequency adaptation were increased (i.e. excitability was lower) in the dorsal rather than ventral CA1. These differences were abolished or reduced by application of XE991, indicating that they were caused by IM. Thus, it appears that IM has stronger effects in dorsal than in ventral rat CA1 pyramidal cells because of a larger maximal M-conductance and left-shifted activation curve in the dorsal cells. These mechanisms may contribute to D–V differences in the rate and phase coding of position by CA1 place cells, and may also enhance epileptiform activity in ventral CA1.
Introduction
Convergent evidence indicates that the functions of the mammalian hippocampus are segregated into separate zones along the dorsoventral (D–V) axis (Moser & Moser, 1998; Bannerman et al. 2004; Fanselow & Dong, 2010). The septal zone (dorsal in rodents, caudal in primates) serves cognitive functions such as spatial and declarative memory, whereas the temporal zone (ventral in rodents, rostral in primates) is involved in emotional processes such as anxiety, stress and depression (Bannerman et al. 2004; Fanselow & Dong, 2010). An intermediate zone linking the two extremes has also been defined (Dong et al. 2009; Fanselow & Dong, 2010). These subfields of the hippocampus show distinct anatomical connections (Swanson & Cowan, 1977; Witter et al. 1989; Risold & Swanson, 1996; Dolorfo & Amaral, 1998; Prasad & Chudasama, 2013) and gene expression patterns (Lein et al. 2007; Dong et al. 2009).
Hippocampal pyramidal neurons have spatially selective firing fields (O'Keefe & Dostrovsky, 1971) and their field size increases almost linearly along the D–V axis (Jung et al. 1994; Maurer et al. 2005; Kjelstrup et al. 2008; Royer et al. 2010). In the medial entorhinal cortex (MEC), spatial positions are encoded by grid cells that show a similar increase in grid field spacing along the D–V axis (Hafting et al. 2005). These D–V differences in the MEC network are paralleled by differences in intrinsic properties of the MEC L2 stellate cells, in particular differences in HCN and leak conductances (Garden et al. 2008), as well as related functions such as HCN channel-dependent subthreshold resonance in the theta frequency range (Giocomo et al. 2007; Giocomo & Hasselmo, 2009), and synaptic integration (Garden et al. 2008).
Also in the hippocampus, there is some evidence that dorsal and ventral CA1 pyramidal cells differ in synaptic plasticity and their intrinsic properties, (Papatheodoropoulos & Kostopoulos, 2000; Maggio & Segal, 2007; Dougherty et al. 2012; Marcelin et al. 2012a; Marcelin et al. 2012b; Dougherty et al. 2013). Those findings include D–V differences in excitability (Dougherty et al. 2012); expression of HCN genes; HCN-dependent h-current (Ih) and related functions, such as Ih-dependent H-resonance; and Ih–modulated synaptic integration (Marcelin et al. 2012a,b; Dougherty et al. 2013). These studies found more pronounced Ih-related properties in dorsal than ventral CA1 pyramidal cells in the first 2 postnatal weeks (Marcelin et al. 2012a), although more in ventral than dorsal cells in weeks 4–8 (Marcelin et al. 2012b; Dougherty et al. 2013). Also, Kv4.2 protein expression and Kv4.2 currents were larger in dorsal than ventral CA1 pyramidal cells of adult rats (Marcelin et al. 2012b).
However, these studies did not examine the other main current operating in the subthreshold voltage range in CA1 pyramidal cells: the M-current (IM) (Halliwell & Adams, 1982; Storm, 1990). IM is generated by heteromultimeric Kv7/M-channels encoded by Kcnq genes (mainly Kv7.2, Kv7.3, Kv7.5; Kcnq2, 3, 5) (Wang et al. 1998; Schroeder et al. 2000; Shah et al. 2002) and expressed at high densities in the axon initial segment (AIS) and axonal nodes of Ranvier (Devaux et al. 2004; Pan et al. 2006; Chung et al. 2006; Battefeld et al. 2014). IM strongly modulates the overall excitability and burst-firing of pyramidal cells by controlling the afterdepolarization, axonal resting membrane potential and spike threshold (Madison & Nicoll, 1984; Yue & Yaari, 2004; Shah et al. 2008; Battefeld et al. 2014). IM also underlies spike frequency adaptation (Madison & Nicoll, 1984) and the medium after-hyperpolarization (mAHP) Storm, 1989; Storm, 1990; Gu et al. 2005, 2008), as well as theta resonance at depolarized potentials (M-resonance) where Ih is not active, in both the soma and dendrites of CA1 pyramidal cells (Hu et al. 2002; Peters et al. 2005; Hu et al. 2009). Furthermore, IM modulates presynaptic excitability, resonance properties and transmitter release of hippocampal axons and terminals (Vervaeke et al. 2006a; Alle et al. 2009; Sun & Kapur, 2012). Accordingly, several mutations in Kcnq genes result in hereditary epilepsy in humans (Jentsch, 2000; Steinlein, 2004).
Because KV7/M-channels are so important for hippocampal pyramidal cells, including several properties that differ along the D–V axis and are strongly related to those of Ih, we aimed to determine whether there are D–V differences in IM and its multiple functions, in 3- to 4-week-old rats. This age is favourable for patch clamp recording in slices under visual control, and IM-related properties are well established in CA1 pyramidal cells (Hu et al. 2002; Gu et al. 2005). Indirect evidence for D–V differences in Kv7/M expression is suggested by the apparently higher Kcnq mRNA density in D than V CA1 in 8-week-old mice, as seen in the Allen Mouse Brain Atlas (Lein et al. 2007; http://mouse.brain-map.org). Because previous studies reported that D–V gradients of Ih- related properties are reversed between 2-week-old rats (Marcelin et al. 2012a) and 4- to 8-week-old/adult rats (Marcelin et al. 2012b; Dougherty et al. 2013), we also investigated basic Ih related properties in the 3- to 4-week-old rats used in the present study.
The main results of the present study have been reported in abstract form (Hönigsperger et al. 2012; Marosi et al. 2012).
Methods
Ethical approval
All experimental procedures were approved by the responsible veterinarian of the Institute, in accordance with the statute regulating animal experimentation given by the Norwegian Ministry of Agriculture, 1996. The experiments reported in the present study comply with the policies and regulations of The Journal of Physiology (Drummond, 2009).
Hippocampal slice preparation
Young male Wistar rats (aged 21–28 days) were deeply anaesthetized with Suprane (Baxter Medical AB SE, Kista, Sweden) before decapitation. The brain was removed and transferred to ice-cold cutting solution containing (in mm): 1.25 KCl, 1.25 KH2PO4, 87 NaCl, 25 NaHCO3, 7 MgCl2, 0.5 CaCl2, 16 glucose and 75 sucrose, saturated with 95% O2/5% CO2. Acute hippocampal slices (350–400 μm) from the dorsal (coronal plane) and ventral (horizontal plane) hippocampus were cut in ice-cold cutting saline with a vibratome (VT1200S; Leica Microsystems, Wetzlar, Germany). The slices were immediately transferred to a submerged holding chamber and incubated at ∼33°C for 30 min before being stored at room temperature (20–24°C), still in cutting solution. For current-clamp experiments, slices were submerged in artificial cerebrospinal fluid containing (mm): 1.25 KCl, 1.25 KH2PO4, 125 NaCl, 25 NaHCO3, 1.0 MgCl2, 2.0 CaCl2 and 16 glucose, saturated with 95% O2/5% CO2. For voltage-clamp experiments of IM, the recording medium contained (mm): 2.5 KCl, 125 NaCl, 25 NaHCO3, 1.0 MgCl2, 2.0 MnCl2 and 16 glucose, supplemented with 0.5–1.0 μm tetrodotoxin (TTX), 1 mm 4-aminopyridine (4-AP) and 10 μm 4-ethylphenylamino-1,2-dimethyl-6-methylaminopyrimidinum chloride (ZD-7288) for better isolation of IM.
Electrophysiology
Whole-cell patch clamp recordings were obtained from somata of visually identified dorsal and ventral CA1 pyramidal neurons approximately midway between the CA2 and subiculum; (Fig. 2Ab and Bb), viewed with an upright microscope with IR-DIC optics (BX50; Olympus, Tokyo, Japan) at 34.5 ± 0.5°C. Patch clamp pipettes were pulled from borosilicate glass with (outer diameter 1.5 mm, inner diameter 0.86 mm). Voltage-clamp recordings were performed with a Multiclamp 700B (Molecular Devices, Sunnyvale, CA, USA) and current clamp recordings with either a Multiclamp 700B, or a Dagan BVC-700A (Dagan Corp., Dagan, Minneapolis, MN, USA) patch clamp amplifier using pipettes with similar resistance (3–4 MΩ and 4–5 MΩ, respectively) filled with the solution (mm): 120 KMeSO4, 10 KCl, 10 phosphocreatine disodium salt hydrate, 10 HEPES, 4.0 ATP Mg salt and 0.3 GTP sodium salt hydrate (280–290 mosmol l−1). The pH was adjusted to 7.2–7.3 with KOH. In some experiments, biocytin (0.3%) was added. Data were only collected from cells forming a 1 GΩ or tighter seal. The series resistance was carefully compensated at the beginning of every protocol. The maximal series resistance we accepted was 25 MΩ in current-clamp recordings and 14 MΩ in voltage-clamp. All voltage-clamp recordings used >90% series resistance compensation. Membrane potentials were corrected for the liquid junction potential (−8.5 mV).
Figure 2.

Three-dimensional reconstruction and morphological analysis of dorsal and ventral CA1 pyramidal cells
Aa, Ba, reconstructed pyramidal cells from dorsal (n = 10 cells; N = 7 rats) and ventral CA1 (n = 10 cells; N = 6 rats). Axons are drawn in red; arrows indicate the end of the axon if it is not obvious. Scale bar = 100 μm. Asterisks (*) indicate cells with total dendritic length close to the mean of each population, shown at an expanded scale in C. Ab, Bb, show the positions of the reconstructed cells in the hippocampal slices. Scale bar = 1000 μm. C, representative examples of reconstructed pyramidal cells in dorsal and ventral CA1. Axons (red) were identified by lack of dendritic spines and presence of enlarged structures formed at the cut end (axonal blebs, see inset). Scale bar = 100 μm. D, the measured total dendritic length was greater in dorsal than ventral CA1 pyramidal cells [dorsal: 9.4 (1.86) mm; n = 10 cells; N = 7 rats; ventral: 7.11 (1.13) mm; n = 10 cells; N = 6 rats; **P < 0.01]. E, the apical dendritic length was not significantly different between dorsal and ventral pyramidal cells [dorsal: 6.43 (1.52) mm; ventral: 5.3 (1.14) mm; not significant, P = 0.076]. F, the basal dendritic length was significantly greater in dorsal than in ventral pyramidal cells [dorsal: 2.97 (0.90) mm; ventral: 1.81 (0.26) mm; **P < 0.01]. G, the total dendritic surface of pyramidal cells was significantly greater in dorsal compared to ventral pyramidal cells (dorsal: 18223 (6540) μm2; ventral: 12705 (3558) μm2; *P < 0.05). H, the total dendritic volume did not show a significant difference between dorsal and ventral pyramidal cells (dorsal: 3827 (1960) μm3; ventral: 2712 (1161) μm3; not significant, P = 0.135]. I, the total length of the (cut) axons was significantly greater in ventral than in dorsal pyramidal cells [dorsal: 0.22 (0.15) mm; ventral: 1.25 (0.68) mm]; ***P < 0.001) (two-tailed, two-sample t tests (after Box-Cox transformation in D, F, G, H, I). Mean (SD).
Histology and morphological reconstructions
Neurons previously filled with biocytin (0.3%) were visualized with the avidin-biotin-peroxidase method using 3,3′-diaminobenzidine as a chromogen (ABC kit; Vector Laboratories, Burlingame, CA, USA) and morphologically reconstructed using the Neurolucida system (MicroBrightField, Colchester, VT, USA). Identification of dendrites and axons was based on morphological criteria including presence/absence of spines and formation of bleb-like swellings at the cut surface of the slice (Shu et al. 2006).
Chemicals
TTX was purchased from Alomone Labs, 4-ethylphenylamino-1,2-dimethyl-6-methylaminopyrimidinum chloride (ZD-7288), 10,10-bis(4-pyridinylmethyl)-9(10H)-anthracenone dihydrochloride (XE991) and synaptic blockers 6,7-dinitroquinoxaline-2,3-dione (DNQX), dl-2-amino-5-phosphopentanoic acid (DL-AP5) and 6-imino-3-(4-methoxyphenyl)-1(6H)-pyridazinebutanoic acid hydrobromide (gabazine) were obtained from Tocris Bioscience (St Louis, MO, USA). 4-AP and the remaining chemicals were purchased from Sigma-Aldrich (Oslo, Norway). Synaptic blockers were used in some of the experiments at the concentrations (μm): 10 DNQX, 50 DL-AP5, 5 gabazine. The other drugs were used at the concentrations: TTX (0.5-1.0 μm), ZD-7288 (10 μm), XE991 (10–20 μm), 4-AP (1.0 mm), retigabine (10 μm).
Data aquisiton and analysis
The data were acquired with pClamp 9/10 and digitized with a Digidata 1322A A/D converter (Molecular Devices) at a sampling rate of 0.5–40 kHz. Analysis was carried out using Clampfit, version 10.2, Stimfit, version 0.10 (http://www.stimfit.org) and custom-written routines in Python (https://www.python.org) and the results were plotted with Stimfit 0.10 and Origin, version 8.5/9.1 (OriginLab Corp., Northampton, MA, USA). The somatic RInput (Figs 1 and 3) was calculated by Ohm's law from the steady-state voltage response at the end of a current pulse. Simulated EPSPs [artificial EPSPs (αEPSPs); Fig. 4] were generated by current injections of the form: f(t) = [1 – exp(–t/τON)]exp(–t/τOFF), with τON = 0.5 ms and τOFF = 10 ms (Gastrein et al. 2011). The impedance (Z) amplitude profile (ZAP) protocol was used to characterize the resonance behaviour of the cells. The frequency-dependent impedance (Fig. 5) was obtained by injecting a sinusoidal current (chirp stimulus), ramped from f0 = 0 Hz to fmax = 15 Hz in 30 s with constant amplitude. Three consecutive traces were averaged to reduce errors as a result of non-stationarities at low frequencies. The impedance magnitude was then calculated from the ratio between the fast Fourier transform (FFT) of the voltage response (V) and the FFT of the injected sinusoidal current (IZAP): [|Z(f)| = |FFT(V)/FFT(IZAP)|] and fitted with a polynomial function of f. The strength of the resonance (Q) was calculated as the ratio between the magnitude of the fitted impedance at the resonance frequency (|ZRes|) and the magnitude of the fitted impedance at 0 Hz (|Z0|). To ensure a reliable fit of the polynomial function f, we compared the fitted impedance at 0 Hz with the steady-state Rinput measured at subthreshold potentials in response to small current pulses. The spike threshold (Fig. 8) was defined as the voltage at which dV/dt exceeded 10 mV ms-1 (determined from a plot of dV/dt versus V). The mAHP amplitude following a spike train (Fig. 9) was measured within a 10 ms time window centered on the peak of the mAHP. The adaptation index (Fig. 1) was calculated by dividing the spike rate (spikes s–1) of the last 300 ms, during the 1 s long current pulse, by the spike rate of the 1st interspike interval. The resulting quotient was subtracted from 1 and multiplied by 100 to obtain the adaptation index as a percentage.
Figure 1.

Characterization of input resistance (RInput), membrane potential sag and rebound potential in dorsal and ventral pyramidal cells
A, example traces of voltage responses evoked by 1 s long current pulses (−100 pA, +50 pA) in dorsal (n = 22) and ventral (n = 25) pyramidal cells. B, summary, RInput was significantly higher for both negative and positive current pulses in ventral pyramidal cells [–100 pA: 92.3 (26.2) MΩ; +50 pA: +137.8 (40.1) MΩ; n = 25 cells; N = 17 rats] than dorsal pyramidal cells [–100 pA: 70 (17.9) MΩ; +50 pA: 107.4 (33.4) MΩ; n = 22 cells; N = 15 rats]; *P < 0.05, **P < 0.01. RInput was significantly higher during positive than negative pulses in both ventral and dorsal cells (***P < 0.001; two-way repeated measures ANOVA). C, example traces of voltage responses evoked by 1 s long negative current pulses in dorsal (n = 14) and ventral (n = 15) pyramidal cells. Injected current pulses were scaled to compare voltage responses at similar membrane potentials at the beginning of each pulse (• Peak) in dorsal and ventral pyramidal cells. D, summary, showing no significant difference in membrane potentials measured at the peak [dorsal: −81.6 (1.96) mV; n = 14 cells; N = 12 rats; ventral: −81.5 (1.94) mV; n = 15 cells; N = 12 rats; P = 0.97, two-tailed, two-sample t test after Johnson transformation] and at steady-state voltage responses (○) at the end of each pulse [dorsal: −80.1 (1.59) mV; ventral: −79.8 (1.315) mV; P = 0.64, two-tailed t test). To quantify the sag ratio, we divided steady-state voltage responses by responses measured at the peak, showing no difference between dorsal and ventral pyramidal cells [dorsal: 0.98 (0.007); ventral: 0.98 (0.014); P = 0.93, two-tailed, two-sample t test after Johnson transformation]. E, additional analysis showed no significant difference in mean rebound potentials (▪) measured after the end of each pulse in dorsal and ventral pyramidal cells [dorsal: −70.7 (0.9) mV; n = 14 cells; N = 12 rats; ventral: −70.4 (1.2) mV; n = 15 cells; N = 12 rats; P = 0.56, two-tailed, two-sample t test]. Mean (SD).
Figure 3.

Effects of retigabine and XE991 on input resistance (RInput) in dorsal and ventral CA1 pyramidal cells
A and B, representative sample traces of voltage responses evoked by a series of hyper- and depolarizing current pulses in a dorsal (A) and ventral (B) pyramidal cells. The membrane potential was pre-adjusted to −78 mV by direct current injection. TTX (0.5 μm) was applied during the whole recording period to avoid spiking. The traces illustrate typical voltage responses during control periods (black traces), after application of the Kv7 opener retigabine (10 μm) (green) and after application of the Kv7 blocker XE991 (10 μm) (red). Corresponding current-voltage (I–V) curves are shown to the right. C and D, left: overlay of single voltage responses (control: black; retigabine: green; XE991: red) to the same current pulse in a dorsal and a ventral pyramidal cell, respectively. Injected current pulses were adjusted, if necessary, to obtain the same membrane potential of −58 mV (dashed lines) at the end of each pulse during the control period in both dorsal and ventral cells for direct comparison. C and D, right: comparison between changes in RInput after application of retigabine and XE991. Dorsal cells: control: 98.7 (28.3) MΩ; retigabine: 66.9 (17.2) MΩ; XE991: 132.6 (41.6) MΩ; n = 5 cells; N = 4 rats; ***P < 0.001, **P < 0.01; Ventral cells: control: 76.6 (30.7) MΩ; retigabine: 63.2 (18.3) MΩ; XE991: 87.2 (24.7) MΩ; n = 5 cells; N = 4 rats; *P < 0.05, ***P < 0.001. RInput was not significantly different between dorsal and ventral cells in control, or after application of retigabine and XE991 (P = 0.17, P = 0.7, P = 0.1) (two-factor repeated measures ANOVA after Box-Cox transformation). Mean (SD).
Figure 4.
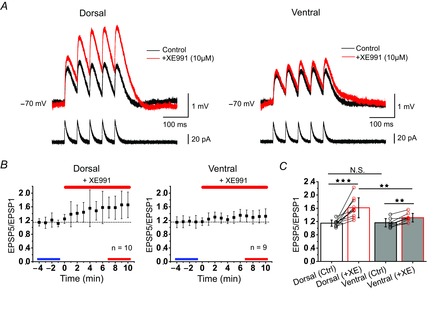
Effect of XE991 on temporal summation in dorsal and ventral CA1 pyramidal cells
A, overlay of representative somatic αEPSPs (mV, black: control, red: after XE991 application) after injection of five EPSCs at 20 Hz (pA). The initial membrane potential was adjusted to −70 mV. B, normalized time course of the effect of XE991 (10 μm) on EPSP summation (amplitude ratio of 5th EPSP/1st EPSP) in dorsal (left, n = 10 cells; N = 6 rats) and ventral (right, n = 9 cells; N = 6 rats) pyramidal cells. Steady-state responses are indicated for control (blue line, bottom) and after application of XE991 (red line, bottom). C, summary graph, comparing mean EPSP summation (blue, red lines in B), in dorsal pyramidal cells [control: 1.15 (0.09); after XE991: 1.61 (0.3); ***P < 0.001] and ventral pyramidal cells [control: 1.16 (0.13); after XE991: 1.32 (0.13); **P < 0.01]. EPSP summation was not significantly different between dorsal and ventral pyramidal cells in control [dorsal: 1.15 (0.09); ventral: 1.16 (0.13); not significant, P = 0.92] but was significantly higher in dorsal cells after application of XE991 [dorsal: 1.61 (0.3), ventral: 1.32 (0.13); **P < 0.01] (two-way repeated measures ANOVA after Box-Cox transformation). Mean (SD).
Figure 5.

Kv7-dependent M-resonance close to spike threshold differs between dorsal and ventral CA1 pyramidal cells
A, typical voltage responses (top) to sinusoidal current injections of linearly increasing frequency (ZAP protocol) (bottom) in dorsal and ventral pyramidal cells at −60 mV. A–F, injected currents were scaled to yield initial voltage responses of similar amplitudes (∼1.5 mV). B, histograms showing distributions of resonance frequency in dorsal and ventral pyramidal cells. Arrows indicate location of example traces from (A). C, summary for all recorded cells, comparing resonance frequency [dorsal: 2.5 (1.6) Hz; n = 30 cells, N = 21 rats; ventral: 0.8 (1.2) Hz; n = 30 cells; N = 18 rats; **P < 0.01] and resonance strength (Q-value) [dorsal: 1.5 (0.4); n = 30 cells, N = 21 rats; ventral: 1.1 (0.3); n = 30 cells, N = 18 rats; **P < 0.01] (two-tailed, boot-strapped two-sample t tests). D, F, voltage responses of dorsal and ventral pyramidal cells to sinusoidal current injections in control (black) and after bath-application of XE991 (10 μm, red) and retigabine (10 μm, green) respectively. E, effects of XE991 on resonance frequency [control: 3.8 (1.6) Hz; after XE991: 0.2 (0.4) Hz; n = 6 cells; N = 4 rats; **P < 0.01] and resonance strength [Q-value; control: 1.7 (0.15); after XE991: 1.0 (0); n = 6 cells; N = 4 rats; **P < 0.01] in dorsal cells. G, effects of retigabine on resonance frequency [control: 0.7 (1.3) Hz; after retigabine: 4.6 (1.3) Hz; n = 6 cells; N = 6 rats; *P < 0.05] and Q-value [control: 1.04 (0.1); after retigabine: 2.05 (0.55); n = 6 cells; N = 6 rats; *P < 0.05] (two-tailed, boot-strapped paired t tests) in ventral cells. Mean (SD).
Figure 8.

Dorsal and ventral pyramidal cells differ in spike threshold, mediated by Kv7 channels
A and C, Voltage responses (mV) of dorsal and ventral pyramidal cells to injected slow current ramps (50 pA/10 s−1) in control (black) and after application of XE991 (red). B and D, dV/dt plots illustrate corresponding spike thresholds of the 1st spike (black, red arrowheads in A and C) in dorsal and ventral pyramidal cells. E and F, Enlarged dV/dt plots show that spike thresholds were measured when membrane potentials changed more than 10 mV ms-1 (dashed lines). G, summary: spike thresholds in dorsal and ventral pyramidal cells were significantly different in control [dorsal: −51.5 (3.0) mV; n = 7 cells; N = 5 rats; ventral: −56 (2.4) mV; n = 7 cells; N = 3 rats; *P < 0.05] but not after application of XE991 [dorsal: −54.1 (3.5) mV; ventral: −57.1 (2.4) mV; not significant, P = 0.08]. XE991 significantly changed spike thresholds in dorsal pyramidal cells (***P < 0.001) and in ventral pyramidal cells (**P < 0.01) (two-way repeated measures ANOVA). Mean (SD)
Figure 9.

Dorsal and ventral pyramidal cells differ in the size of their Kv7-dependent medium mAHP following a spike train
A and B, Typical recordings showing trains of five spikes followed by mAHPs (arrows), evoked by brief (50 ms) current pulses in a dorsal pyramidal cell (A) and in a ventral pyramidal cell (D) under normal conditions. The membrane potential before the stimulation was kept at −71 mV in both dorsal and ventral cells, by adjusting a steady, depolarizing holding current. For better isolation of the Kv7-dependent mAHP, an additional depolarizing DC current was injected after the stimulation. Application of XE991 (10 μm) reduced the mAHP more strongly in dorsal (B and C) than ventral (E and F) pyramidal cells. Note that current pulses were reduced after XE991 application to keep the number of spikes constant, and the DC holding current before the stimulation was reduced to keep the membrane potential at −71 mV. The depolarizing holding current after the stimulation was kept at the same level compared to control. G and H, Time plots showing the effect of XE991 application (10 min, red bars) on the mAHP peak (mV) in dorsal (n = 7 cells; N = 5 rats) and ventral (n = 7 cells; N = 5 rats) cells. I, summary, comparing the mAHP peak potential in control (blue lines in G and H) and the last 5 min during XE991 application (red lines in G and H) in dorsal cells [control: −68.9 (2.9) mV; after XE991: −64.8 (3.5) mV; n = 7 cells, N = 5 rats; ***P < 0.001] and ventral cells [control: −70.0 (2.0) mV; after XE991: −68.2 (3.5) mV; n = 7 cells; N = 5 rats; *P < 0.05]. The mAHP peak potential (mV) was not significantly different between dorsal and ventral cells in control (P = 0.7) and after application of XE991 (P = 0.056) (two-way repeated measures ANOVA). J, summary comparing the difference (Δ) in mAHP peak potentials before and after XE991 application between dorsal and ventral cells [dorsal: −4.1 (1.8) mV; n = 7 cells; ventral: −1.9 (1.6) mV; n = 7 cells; *P < 0.05] (two-tailed, boot-strapped two-sample t test). Mean (SD).
Statistical analysis
Statistical analysis was performed in Origin, version 8.5/9.1, Minitab, version 17 (Minitab Inc., State College, PA, USA), SigmaStat, version 3.1 (Systat Software Inc., Chicago, IL, USA) and SPSS, version 22 (IBM Corp., Armonk, NY, USA.). Group data are expressed as the mean (SD), with the sample size of cells (n) and number of rats (N) used in the individual experiments also given. If data were normally distributed according to a normal probability plot of their residuals, we used different parametric tests: (i) two-sample t or Welch's t tests for independent samples (dorsal vs. ventral) with equal or unequal variances, respectively (Origin, version 8.5/9.1; Minitab, version 17); (ii) paired t tests for paired samples (drug vs. no drug) (Origin, version 8.5/9.1; Minitab, version 17); and (iii) two-factor repeated measures ANOVA for multiple comparisons (dorsal vs. ventral and drug vs. no drug) (SigmaStat, version 3.1). Homogeneity of variance was assessed by inspecting scatter plots of residuals. Multiple comparisons of non-normal data, and data with unequal variances were carried out after a Box-Cox or Johnson transformation (SigmaStat, version 3.1; Minitab, version 17). Where transformation procedures were not useful or possible for correcting both non-normality and unequal variances, t tests were performed using the BCa-bootstrap (SPSS, version 22). The latter method was also used to obtain the 95% confidence interval (CI).
All our comparisons were planned a priori and so no adjustment was made for multiple comparisons (Quinn & Keough, 2002), except when testing for the outlier in Fig. 6G for which a Bonferroni adjustment was made (Kutner et al. 2004). All statistical tests were two-tailed using a critical level of significance α = 0.05. (In the original version of this paper, sample means were expressed ± SEM, nonparametric tests were used for non–normal samples or n < 10, tests were one–sided when we could predict the direction of an experimental outcome, and a factor–wise Bonferroni adjustment was made for multiple comparisons. Based on the advice of the Statistics Editor, these procedures were amended as described above in order to comply with the guidelines of the Journal of Physiology. Changing the method of analysis in this way did not alter the conclusions of this study.)
Figure 6.

Voltage dependence of XE991-sensitive current in dorsal and ventral CA1 pyramidal cells
A and B, somatic voltage-clamp recordings; slow depolarizing and repolarizing voltage ramps (8 mV s–1) evoked outward currents (black traces) in dorsal and ventral pyramidal cells which were partially blocked by XE991 (10–20 μm) (red traces). C and D, traces showing the subtracted XE991 sensitive outward currents (control − XE991, blue) from dorsal and ventral pyramidal cells in A and B. Recordings were made in the presence of Ca2+ free artificial cerebrospinal fluid substituted with MnCl2 (2 mm), and channel blockers TTX (0.5 μm), ZD7288 (10 μm) and 4-AP (1 mm). E, overlay of XE991 sensitive currents shown in C and D. Dashed vertical lines indicate the magnitude XE991 sensitive currents measured at a command membrane potential of −8.5 mV in dorsal and ventral pyramidal cells. The XE991 sensitive currents were fitted with Boltzmann functions and polynomial functions f(V) (black) separately shown as conductance–voltage (G–V) plots in I. F, close-up of fitted XE991 sensitive currents in E around the activation threshold (0 pA, horizontal dashed lines). Dashed vertical lines indicate the magnitude of XE991 sensitive currents at −60 mV. G, summary, comparing XE991 sensitive currents at a membrane potential of −8.5 mV [dorsal: 2845 (321) pA; n = 4 cells; N = 3 rats; ventral: 1146 (351) pA; n = 5 cells; N = 3 rats; ***P < 0.001] and in H, at −60 mV [dorsal: 90 (28.5) pA; n = 4 cells; N = 3 rats; ventral: 42.6 (28) pA; n = 5 cells; N = 3 rats; *P < 0.05] (two-tailed, boot-strapped two-sample t tests). One dorsal cell (marked by parentheses) was excluded from analysis, as explained in the methods. The values in H, are means from depolarizing and repolarizing XE991-subtracted ramp current at −60 mV. Mean (SD). I, G–V plots of Boltzmann and polynomial f(V) fits (black) in dorsal (left) and ventral (right) cells. Solid and dashed lines show individual fits of depolarizing and repolarizing ramps respectively. The obtained Boltzmann parameters were used for the NEURON simulations shown in Fig. 7.
Analysis of voltage-ramp data
To quantify the V-dependence of the XE991-sensitive stationary conductance (G), the XE991-sensitive current (I) recorded during voltage ramps (Fig. 6) was modelled with the function:
| 1 |
From the Nernst equation, the K+ reversal potential (EK) was −104.6 mV. The natural choice for G(V) is a Boltzmann, although this gave poor fits to I(V) except for the repolarizing ramp of one ventral cell. For the remaining cells, exploratory fits using trial values of the maximum conductance (Gmax) suggested that a Boltzmann was a reasonable approximation up to some voltage V0, above which I(V) increased faster than expected. Accordingly G(V) was described by the function:
| 2 |
where the first term is a Boltzmann with voltage for half-maximal conductance Vhalf and inverse slope factor k. The parameter G0 allows for a small non-zero offset as V → −∞ and the function f(V) is a polynomial of degree m ≤ 5 chosen so as to obtain a good fit for V > V0:
| 3 |
where the βi values are adjustable parameters and u(x) is the unit step function [u(x) = 1 for x ≥ 0, zero otherwise]. V0 was also treated as an adjustable parameter to be estimated by the fitting software. The absence of β0 and β1 ensure that G(V) is continuous and smooth at V = V0. The presence of the function f(V), ‘turning on’ at V = V0, constrains the value of Gmax in eqn 2. For the five dorsal cells, m = 5, except for the depolarizing ramp of one cell (the outlier in Fig. 6G) for which m = 3. (This cell had the shortest axon (22 μm) and smallest outward current of all dorsal cells, and a t test on the studentized deleted residual was significant (t = 7.2, P = 0.005, α = 0.01 after Bonferroni correction). For four of the five ventral cells, m = 3, whereas, for the remaining cell, m = 2 (depolarizing) or f(V) = 0 (repolarizing; Table1). For the dorsal cells, any plateau data at high V and any data to the right and immediately to the left of any peak were excluded. For both ventral and dorsal cells, G values at very hyperpolarized V were often negative. These data were considered to be artefactual and were also excluded. Example fits are shown in Fig. 6E and F; the coefficient of determination was always in excess of 0.995. In practice, the fits were of eqn 2 to plots of G vs. V to facilitate the initial parameter estimation that is required for non-linear least-squares fitting. The entire I–V curve could have been fitted with a polynomial but this would make valid comparisons awkward if not impossible, especially if polynomials of differing degrees had to be fitted to the data from different cells or regions. The advantage of the present approach is that it is easily interpreted and allows a simple comparison of I–V curves between cells for V ≤ V0, where G(V) for all cells is approximated with the same function (i.e. a Boltzmann). This same approach also lends itself naturally to the implementation of the compartmental model described below.
Table 1.
Comparison of V0 and the Boltzmann parameters [see eqns 1-3] of the XE991-sensitive conductance G(V) for ventral (V, columns 1–3) and dorsal (D, columns 4–6) CA1 pyramidal neurons
| V-Depol. | V-Repol. | V-Average | D-Depol. | D-Repol. | D-Average |
|---|---|---|---|---|---|
| V0 (mV). Dorsal vs. ventral: depolarizing ramp, P = 0.30; repolarizing ramp, P = 0.39; average, average, P = 0.34. | |||||
| Effect of V ramp ‘direction’: P = 0.34 | |||||
| −32.2 | −28.7 | −30.4 | −39.3 | −37.8 | −38.5 |
| −23.6a | > −8.5a,b | > −16 a | −34.3 | −41.7 | −38.0 |
| −44.3 | −50.6 | −47.4 | −47.9 | −44.1 | −46.0 |
| −38.6 | −41.3 | −40.0 | −44.8 | −47.1 | −46.0 |
| −28.9 | −27.3 | −28.1 | −37.8 | −42.1 | −40.0 |
| −36.0 (6.9) | −37.0 (11.0) | −36.5 (8.9) | −40.8 (5.5) | −42.6 (3.4) | −41.7 (4.0) |
| Gmax (nS). Dorsal vs. ventral: depolarizing ramp, P = 0.91; repolarizing ramp, P = 0.61; average, P = 0.70. | |||||
| Effect of V ramp ‘direction’: P = 0. 60 | |||||
| 10.5 | 12.5 | 11.5 | 11.7 | 10.1 | 10.9 |
| 7.5 | 8.1 | 7.8 | 5.0 | 4.1 | 4.5 |
| 5.9 | 6.0 | 5.9 | 4.9 | 11.2 | 8.0 |
| 7.3 | 6.5 | 6.9 | 8.8 | 6.5 | 7.7 |
| 8.1 | 8.9 | 8.5 | 8.0 | 5.4 | 6.7 |
| 7.9 (1.7) | 8.4 (2.6) | 8.1 (2.1) | 7.7 (2.9) | 7.5 (3.1) | 7.6 (2.3) |
| Vhalf (mV). Dorsal vs. ventral: depolarizing ramp, P = 0.010*; repolarizing ramp, P = 0.006**; average, P = 0.006**. | |||||
| Effect of ramp ‘direction’: P < 0.001** | |||||
| −38.2 | −44.2 | −41.2 | −46.4 | −53.2 | −49.8 |
| −36.3 | −39.1 | −37.7 | −42.9 | −51.9 | −47.4 |
| −45.1 | −50.0 | −47.5 | −48.7 | −50.4 | −49.5 |
| −39.8 | −42.6 | −41.2 | −47.8 | −55.2 | −51.5 |
| −37.9 | −44.9 | −41.4 | −43.7 | −52.6 | −48.2 |
| −39.4 (3.4) | −44.2 (4.0) | −41.8 (3.5) | −45.9 (2.5) | −52.7 (1.8) | −49.3 (1.6) |
| k (mV). Dorsal vs. ventral: depolarizing ramp, P = 0.49; repolarizing ramp, P = 0.29; average, P = 0.34. | |||||
| Effect of ramp direction’: P = 0.15 | |||||
| 8.4 | 10.4 | 9.4 | 6.5 | 6.6 | 6.5 |
| 7.9 | 10.0 | 9.0 | 8.1 | 6.8 | 7.5 |
| 4.6 | 5.0 | 4.8 | 3.8 | 6.4 | 5.1 |
| 5.5 | 5.1 | 5.3 | 5.2 | 5.0 | 5.1 |
| 6.7 | 7.7 | 7.2 | 5.9 | 6.3 | 6.1 |
| 6.6 (1.6) | 7.7 (2.6) | 7.2 (2.1) | 5.9 (1.6) | 6.2 (0.7) | 6.0 (1.0) |
Example fits of eqn 1 are shown in Fig. 6E and F. The outlier in Fig. 6G corresponds to the dorsal cell in the second row of the tables. Parameter estimates are given for depolarizing (Depol.) and repolarizing (Repol.) V-ramps, together with the average of these estimates. Mean values are given (with sample SDs in parenthesis). Statistical significance of D–V differences in Boltzmann parameters were tested with a two-tailed, two-sample t test. The effect of V ramp ‘direction’ (depolarizing vs. repolarizing) was assessed with a paired-sample t test on the pooled data (dorsal+ventral). Statistical significance: *P < 0.05, **P < 0.01. aOmitted when computing the mean. bf(V) = 0.
Simulation of voltage-ramp experiments
To assess the effect of preserved axon length (x) on the estimates of Vhalf obtained from the fits of eqn 1, we used a simple compartmental model of a CA1 pyramidal cell implemented in NEURON (Carnevale & Hines, 2009). A 15 μm diameter soma was connected via an axon hillock (a 4 μm long cone frustum with a 4 μm base and a 0.7 μm tip) to an AIS (0.7 μm diameter, 20 or 100 μm long) followed by a series of myelinated internodes (1 μm internal diameter, 25 or 100 μm long). Nodes of Ranvier were 2 μm long and 0.7 μm in diameter. The axon terminated with a 5 μm diameter bleb connected to the most distal internode (which, depending on the value of x, could be a partial internode). x was taken as the distance from the base of the hillock to the point of attachment of the bleb. Dendrites were omitted for simplicity. The M-conductance gM (specific value ) was placed uniformly in the axon hillock, AIS and nodes of Ranvier only (
 in the soma, myelinated internodes and bleb). For the simulations shown in Fig. 7A–C, gM was modelled using the Hodgkin–Huxley formalism:
| 4 |
| 5 |
| 6 |
| 7 |
where iM is the membrane M-current density, m is the activation variable, m∞ is the stationary value of m, VM is the voltage for half-activation and kM is the inverse slope factor. The relaxation time constant (τ) was kept at ≤1 ms for these simulations [i.e. τ(VM) = 1 ms] to ensure that gM approached a stationary value at each V. The values of  , VM and kM were adjusted to obtain values of Gmax, Vhalf and k similar to those obtained from the fits of eqn 1 to the experimental data. The only other conductance present was a passive linear leak, which was assigned a reversal potential of −75 mV. The corresponding membrane-specific resistance (Rm) was uniform in the soma, hillock, AIS, nodes and bleb, although it was five-fold higher in the internodes. The membrane-specific capacitance was 0.1 μF cm−2 in the internodes and 1 μF cm−2 elsewhere. Other parameters are given in Table2, which also defines the five regimes (I–V) for which simulations of somatic V ramps were performed [8 mV s−1, −98.5 → −8.5 mV (depolarizing) or vice versa (repolarizing)]. The kinetic model used for Fig. 7D employed more realistic values of τ, as discussed in the Appendix.
Figure 7.

Simulation results for a NEURON compartmental model of a CA1 pyramidal cell (see Methods) (A–D) and dependence of the experimentally detemined Bolzmann paramaters on preserved axon length in dorsal and ventral cells (E–J)
A–C, Effect of preserved axon length on Boltzmann parameters obtained from fits of eqn 2 to the predicted XE991-sensitive conductance, G(V) (as in D). The simulation regimes are defined in Table2; M-conductance (gM) gating was essentially instantaneous. D, model predictions for a dorsal cell (x = 100 μm, regime I) and fits of eqn 2 for a gM gating mechanism comprising fast and slow components (i.e. non-instantaneous gating). E–J, dependence of the experimentally determined Boltzmann parameters (Table1) on preserved axon length (x) in dorsal and ventral cells. Pearson product-moment correlation coefficients (r) and associated significance levels (P) are given, together with regression-line fits.
Table 2.
NEURON model predictions for the effect of preserved axon length (x) on fitted Boltzmann parameters under various regimes
| Regime | AIS (μm) | Internode (μm) | Ra (Ω cm) | Rm (kΩ cm2) | D  (pS μm−2) (pS μm−2) |
V  (pS μm−2) (pS μm−2) |
|---|---|---|---|---|---|---|
Simulation regimes.  is the M specific conductance in the nodes, hillock and AIS ( is the M specific conductance in the nodes, hillock and AIS ( = 0 elsewhere). It was adjusted to obtain = 0 elsewhere). It was adjusted to obtain | ||||||
| Gmax ≈ 8 nS for x ≥ 100 μm, similar to the observed values (compare Fig. 7B with Table1). VM and kM were similarly adjusted | ||||||
| (compare Fig. 7A and C with Table1, respectively): VM(D) = −51 mV, VM(V) = −46 mV, kM = 4 or 5 mV | ||||||
| I | 20 | 100 | 150 | 25 | 120 | 117 |
| II | 20 | 25 | 150 | 25 | 109 | 110 |
| III | 100 | 25 | 150 | 25 | 90 | 97 |
| IV | 100 | 25 | 75 | 50 | 60 | 65 |
| V | 100 | 25 | 37.5 | 100 | 42 | 41.5 |
| Regime | D ΔGmax (nS) | V ΔGmax (nS) | D ΔVhalf (mV) | V ΔVhalf (mV) | D Δk (mV) | V Δk (mV) |
|---|---|---|---|---|---|---|
| Predicted effect of preserved axon length (x). Change in fitted Boltzmann parameters from x = 20 to x = 100 μm. | ||||||
| Data were derived from Fig. 7A–C. | ||||||
| I | 0.68 | 0.65 | 0.51 | 0.51 | 0.37 | 0.36 |
| II | 1.14 | 1.09 | 0.92 | 0.90 | 0.69 | 0.67 |
| III | 2.25 | 2.00 | 1.81 | 1.54 | 2.34 | 2.12 |
| IV | 4.11 | 3.90 | 3.00 | 3.07 | 2.65 | 2.46 |
| V | 5.15 | 4.00 | 3.47 | 3.77 | 2.36 | 2.39 |
Results
Differences in basic electrophysiological and morphological properties between dorsal and ventral CA1 pyramidal cells
We performed somatic whole-cell patch clamp recordings from dorsal (n = 87) and ventral (n = 86) CA1 pyramidal cells in coronal and horizontal hippocampal slices from young rats (postnatal days 21–28; see Methods). Recordings were performed approximately midway between CA2 and subiculum, as indicated in Figs 2Ab and 2Bb. First, we characterized basic electrophysiological properties and found a significantly lower resting membrane potential in dorsal vs. ventral pyramidal cells [dorsal: −77.8 (4.2) mV n = 73 cells; N = 55 rats; ventral: −73.7 (4.0) mV, n = 73 cells; N = 57 rats; ***P < 0.001]. Dorsal cells also had a lower input resistance (Rinput) in response to negative current injections [dorsal: 70 (17.9) MΩ; ventral: 92.3 (26.2) MΩ; *P < 0.05] and positive current injections [dorsal: 107.4 (33.4) MΩ; ventral: 137.8 (40.1) MΩ; **P < 0.01] (Fig. 1A and B), as reported previously (Dougherty et al. 2012, 2013). In addition, to estimate the impact of h current (Ih), we analysed membrane potential sag ratios and rebound potentials in response to negative current pulses, and found that these were not significantly different between dorsal and ventral cells (Fig. 1C–E) (sag: P = 0.93; rebound: P = 0.56) in 3- to 4-week-old rats.
To compare the morphology of dorsal and ventral CA1 pyramidal cells, and to test how well our slicing procedures preserved dendritic and axonal compartments, we filled the cells that we recorded from with biocytin followed by three-dimensional reconstructions and morphological analysis. Ten dorsal and ten ventral CA1 pyramidal cells were reconstructed and analysed (Fig. 2A and B). Figure2C shows representative examples. The entire dendritic tree appeared to be well preserved in both groups, with no obvious signs of major dendritic branches being cut. We found that total dendritic length, length of basal dendrites and total dendritic surface were significantly greater in dorsal than in ventral cells (Fig. 2D, F and G): total dendritic length [dorsal: 9.4 (1.86) mm; ventral: 7.11 (1.13) mm; **P < 0.01], basal dendritic length [dorsal: 2.97 (0.9) mm; ventral: 1.81 (0.26) mm; **P < 0.01] and total dendritic surface [dorsal: 18223 (6540) μm2; ventral: 12705 (3558) μm2; *P < 0.05]. The apical dendritic length and total dendritic volume were not significantly different in dorsal and ventral cells (Fig. 2E and H): apical dendritic length [dorsal: 6.43 (1.52) mm; ventral: 5.3 (1.14) mm; not significant, P = 0.076] and total dendritic volume [dorsal: 3827 (1960) μm3; ventral: 2712 (1161) μm3, not significant, P = 0.135]. These findings are in a good agreement with a previous study (Dougherty et al. 2012). In addition, we found that the total axonal length was significantly shorter in dorsal than ventral pyramidal cells (Fig. 2I) [dorsal: 0.22 (0.15) mm, range 0.022−0.57 mm; ventral: 1.25 (0.68) mm, range 0.079–2.47 mm; ***P < 0.001]. As expected, the axons showed clear signs of being severed during slicing because they ended abruptly at the cut surfaces of the slice, where they often showed a ‘bleb’ at the end (Fig. 2C, inset) (Shu et al. 2006). This indicates that, in both cell populations, the proximal part of the axon, including the axon initial segment (10–60 μm in length) (Pan et al. 2006; Kole & Stuart, 2012; Battefeld et al. 2014) was largely preserved with our slice preparation procedure.
Electrophysiological impact of Kv7/M-channels in dorsal and ventral pyramidal cells
To investigate the electrophysiological impact of Kv7/M-channels in dorsal and ventral CA1 pyramidal cells, we first measured voltage responses evoked by a series of hyper- and depolarizing current pulses from a holding potential of −78 mV (Fig. 3). (All voltage values are corrected for a liquid junction potential of −8.5 mV.) We did this in the presence of TTX (1 μm) to block Na+ spikes, thus allowing us to cover a wider voltage range without discharge (Fig. 3A and B, black traces). Application of the Kv7/M-channel opener retigabine (10 μm), which enhances channel opening and shifts the activation curve to more hyperpolarized potentials (Tatulian et al. 2001), reduced the magnitude of voltage responses positive to −78 mV in both dorsal and ventral cells (Fig. 3A and B, green traces). Washout of retigabine combined with application of the selective Kv7/M-channel blocker XE991 (10 μm) had the opposite effect and increased the voltage responses at depolarized potentials, especially in dorsal cells (Fig. 3A and B, red traces). The corresponding current–voltage (I–V) plots (Fig. 3A and B, right) show that XE991 had larger effects on the input resistance (RInput) of the pyramidal cells in dorsal than in ventral CA1. To compare the effects of retigabine and XE991 on RInput, we scaled the injected current pulses to obtain the same membrane potential at the end of each pulse during control (−58 mV; indicated by dashed lines in Fig. 3C and D, left). Our summarized data show that retigabine significantly reduced RInput in both dorsal and ventral cells, whereas washout of retigabine and wash-in of XE991 significantly increased RInput relative to control (Fig. 3C and D, right): dorsal cells [control: 98.7 (28.3) MΩ; retigabine: 66.9 (17.2) MΩ; XE991: 132.6 (41.6) MΩ; ***P < 0.001; **P < 0.01]; ventral cells [control: 76.6 (30.7) MΩ; reti-gabine: 63.2 (18.3) MΩ; XE991: 87.2 (24.7) MΩ; *P < 0.05; *P < 0.05]. By contrast to the higher RInput in ventral than dorsal cells in normal medium (Fig. 1), we did not find a significant D–V difference in RInput in TTX (Fig. 3C and D, control) (P = 0.17). The latter may be the result of TTX blockade of the persistent Na+ current, which may enhance differences in RInput, combined with a smaller sample size. Similarly, in the presence of TTX, we found no significant D–V difference in RInput during application of retigabine (P = 0.7) and XE991 (P = 0.1). Thus, it appears that the reduction in Rinput in retigabine relative to XE991, ΔRinput = Rinput(retigabine) – Rinput(XE991), may be regarded as the most sensitive measure of available Kv7/M-conductance. We found that ΔRinput was higher in dorsal than ventral cells [dorsal: −68 (26.8) MΩ; ven-tral: −24.0 (10.7) MΩ; *P < 0.05. These results indicate that Kv7/M-channels affect Rinput more strongly in dorsal than in ventral CA1 pyramidal cells, presumably because the dorsal cells have more Kv7/M-channel activity and a larger M-current (IM) in the subthreshold voltage range.
Temporal summation: a ‘normalizing’ effect of Kv7/M-channels
The different contribution of Kv7/M-channels to the somatic RInput in dorsal and ventral pyramidal cells could influence several functions, including temporal summation. To test this idea, we recorded cellular responses evoked by trains of artificial excitatory postsynaptic currents (αEPSCs) (Fig. 4). Trains consisting of five αEPSCs repeated at 20 Hz were injected from a holding potential of −70 mV, evoking a train of αEPSPs. The αEPSP summation was calculated as the ratio between the peak amplitude of the last and first evoked αEPSP in the train (5th αEPSP/1st αEPSP). In control medium (without XE991 or TTX), we found no significant difference in αEPSP summation in dorsal vs. ventral cells [dorsal: 1.15 (0.09); ventral: 1.16 (0.13), not significant, P = 0.92] (Fig. 4A, black traces). By contrast, when XE991 (10 μm) was applied, the summation of the αEPSPs increased by ∼34% in dorsal cells [control: 1.15 (0.09); after XE991: 1.61 (0.3); ***P < 0.001] but only by 14% in ventral cells [control: 1.16 (0.13); after XE991: 1.32 (0.13); **P < 0.01] (Fig. 4A, red traces) as would be predicted if, as suggested above, IM is larger in dorsal cells. Figure4B shows the time courses of the effect of XE991 (10 μm) on αEPSP summation. Our summarized data indicate that the αEPSP summation was significantly stronger in dorsal than in ventral pyramidal cells after blockade of Kv7/M-channels (Fig. 4C) [dorsal: 1.61 (0.3), ventral: 1.32 (0.13); **P < 0.01]. (The blue and red lines at the bottom in Fig. 4B mark the time periods used for averaging the effects of XE991 in Fig. 4C.) Thus, it appears that IM ‘normalizes’ temporal summation of CA1 pyramidal cells, so that it becomes similar in the dorsal and ventral hippocampus (Fig. 4A, black traces), although the summation is very different when IM is blocked (Fig. 4A, red traces). The mechanism underlying this IM-independent difference in summation remains to be determined and could involve other currents; for example, the transient and persistent Na+ currents (INaT, INaP), which can amplify EPSPs in CA1 pyramidal cells (Vervaeke et al. 2006b; Carter et al. 2012). We did not find evidence for D–V differences in Ih-related properties (Fig. 1C–E) and conclude that Ih probably has little or no impact on D–V differences in temporal summation during XE991 application, in 3- to 4-week-old rats.
Difference in subthreshold resonance
Our group previously found that Kv7/M-channels in CA1 pyramidal cells generate subthreshold electrical resonance in the theta frequency range (M-resonance) at membrane potentials close to the spike threshold (Hu et al. 2002; Hu et al. 2009). Hence, if IM is larger in dorsal cells, we expect a higher resonance frequency and a higher resonance strength in those cells (Koch, 1984). To compare the resonance properties in dorsal and ventral CA1 pyramidal cells, we injected a sinusoidal current with constant amplitude and linearly increasing frequency (IZAP) (Hutcheon & Yarom, 2000). The peak-to-peak amplitude of the oscillating current was adjusted to keep the voltage response just below the spike threshold (Fig.5A). The resonance frequency (fres, Hz), was defined as the frequency at which the voltage response was maximal, and the resonance strength (Q value), was calculated as the magnitude of the voltage response at fres divided by the voltage response at 0 Hz (see Methods). We found that the mean resonance frequency was higher in dorsal than ventral cells (Fig. 5B and C, left) [dorsal: 2.5 (1.6) Hz; ventral: 0.8 (1.2) Hz; **P < 0.01]. Also, the resonance strength, as indicated by the Q value, was markedly higher in dorsal than ventral cells (Fig. 5C, right) [dorsal: 1.5 (0.4); ventral: 1.1 (0.3); **P < 0.01]. To test whether we could confirm our previous results that subthreshold resonance depends on Kv7/M-channels, we first recorded from dorsal pyramidal cells and bath-applied XE991 (10 μm) (Fig. 5D and E). This drug essentially abolished the resonance peak, thus reducing the value of fres towards zero Hz [control: 3.8 (1.6) Hz; after XE991: 0.2 (0.4) Hz; **P < 0.01] and reducing the Q value towards 1.0 [control: 1.7 (0.15); after XE991: 1.0 (0); **P < 0.01] in all tested cells (n = 6). Because we found that subthreshold resonance was very weak or absent in ventral CA1 pyramidal cells (Fig. 5A), we investigated whether this might be a result of weak Kv7/M-channel activity at subthreshold potentials. To test this hypothesis, we bath-applied the Kv7/M-channel opener retigabine (10 μm), which is known to enhance subthreshold Kv7/M-channel activity, aiming to determine whether this might induce resonance in ventral cells (Fig. 5F and G). We found that 10 μm retigabine strongly increased both the resonance strength [Q value in control medium: 1.04 (0.1) after retigabine: 2.05 (0.55); *P < 0.05] and the resonance frequency [fres in control: 0.7 (1.3) Hz; after retigabine: 4.6 (1.3) Hz; *P < 0.05] in all tested cells (n = 6). These results indicate that functional Kv7/M-channels are indeed present in ventral CA1 pyramidal cells, as well as suggesting that they are normally weakly activated within the subthreshold voltage range in this cell population.
Difference in amplitude and voltage-dependence of the XE991-sensitive current
To compare the voltage-dependence of Kv7/M currents (IM) in dorsal and ventral CA1 pyramidal cells, we used whole-cell somatic voltage-clamp recordings. Because there is considerable evidence that most of the Kv7/M-channels in CA1 pyramidal cells are concentrated in the perisomatic region, in particular the axon initial segment (Shah et al. 2002; Devaux et al. 2004; Hu et al. 2007; Shah et al. 2008; Hu et al. 2009), somatic whole-cell voltage clamp will give relatively small space clamp errors, thus providing a fairly accurate basis for comparing IM in dorsal and ventral pyramidal cells. To measure IM and its response to XE991 over a wide, continuous voltage range, we applied slow voltage ramps (8 mV s–1) from −98.5 mV to −8.5 mV and back to −98.5 mV (Fig. 6) (Huang & Trussell, 2011). For better isolation of IM, the experiments were performed in Ca2+-free solution, where CaCl2 was substituted with MnCl2 (2.0 mm), as well as with TTX (0.5 μm), 4-AP (1.0 mm) and ZD7288 (10 μm), to block or reduce several voltage- and calcium-dependent Na+, Ca2+ and K+ currents [i.e. INaT, INaP, ICa,V, IK(D), IK(A), IBK, ISK, IsAHP, Ih; Storm, 1990], thus improving the space clamp conditions. The depolarizing and repolarizing voltage ramps evoked bigger outward currents in dorsal than ventral cells (Fig. 6A and B, black traces). In both cell populations, bath-application of XE991 (10–20 μm) reduced the evoked outward currents at potentials beyond −60 mV (red traces), as expected for blockade of IM. Comparison of the XE991-sensitive currents (obtained by subtracting currents before and after application of XE991) revealed larger currents in dorsal than ventral cells over the whole voltage range (Fig. 6C–F) as expected if the M-conductance at each voltage is larger in dorsal than in ventral cells. The XE991-sensitive current was compared both at the most depolarized membrane potential tested: −8.5 mV (Fig. 6G) [dorsal: 2845 (321) pA; ventral: 1146 (351) pA; ***P < 0.001] and at a membrane potential close to the spike threshold: −60 mV (Fig. 6H) [dorsal: 90 (28.5) pA; ventral: 42.6 (28) pA; *P < 0.05]. The outlier (lowest point) in Fig. 6G was excluded when computing the dorsal XE991-sensitive current. Furthermore, we observed that, in four out of five dorsal cells, both the XE991-sensitive current and the total outward current showed a peak and/or a plateau at membrane potentials beyond −20 mV (Fig. 6C and E, left). This suggests that IM partially inactivates during strong depolarizations, as previously reported (Jensen et al. 2007). Together, our results indicate that the dorsal CA1 pyramidal cells have a larger Kv7/M-conductance (G) than ventral pyramidal cells.
The XE991-sensitive I–V curves obtained from the V-ramp experiments were quantified by fitting eqn 1 (see Methods), which partitions the curves into two components. The first component was best fitted by a Boltzmann function for membrane potentials below −41.7 (4.0) mV in dorsal cells and −36.5 (8.9) mV in ventral cells as indicated by V0 in Table1. The second component activated at V0 and was fitted with a polynomial function f(V). Example fits to I–V curves are shown in Fig. 6E and F and separate conductance-voltage (G–V) plots of the fitted Boltzmanns and f(V) curves are shown in Fig. 6I. The summarized Boltzmann parameters show a significantly lower Vhalf in dorsal compared to ventral cells [dorsal: −49.3 (1.6) mV; ventral: −41.8 (3.5) mV; *P < 0.01] (Table1). No significant differences between Gmax [dorsal: 7.6 (2.3) nS; ventral: 8.1 (2.1) nS; P = 0.70] or k (dorsal: 6.0 (1.0) mV; ventral: 7.2 (2.1) mV; P = 0.34] were observed (Table1).
These results refer to parameter values averaged between depolarizing and repolarizing ramps ‘Average’ in Table1). However, the same conclusion is reached if the two ramps are analysed separately ( ‘Depol.’ and ‘Repol.’ in Table1). As a further check on the apparent D–V difference in Vhalf, we calculated mean I–V curves for dorsal and ventral cells and attempted to superimpose them either by shifting the dorsal curves right by a few millivolts or by scaling the voltage curves. Shifting the curves worked best (scaling tended to produce a cross-over of the curves; data not shown) consistent with the conclusion that Vhalf(D) < Vhalf(V). This ≈7 mV difference in Vhalf may explain our findings that dorsal cells show stronger effects of XE991 than ventral cells at subthreshold voltages, including the effect on Rinput (Fig. 3), synaptic integration (Fig. 4) and M-resonance (Fig. 5). We note that the individual V0 values were generally above spike threshold (Table1 and Fig. 8G). This suggests that the Boltzmann function provides a reasonable description of G(V) within the subthreshold range.
A potential problem with this interpretation is that, because of poor space clamp in the axon, more distal axonal Kv7 channels will activate at progressively later times during the voltage ramp, leading to an overestimate of Vhalf. Accordingly, because the preserved axon length (x) for dorsal cells was considerably less than for ventral cells (Fig. 2I), part of the observed D–V difference in Vhalf may be artefactual. We addressed this question using a simple compartmental model of a CA1 pyramidal cell comprising a soma connected via an axon hillock and AIS to a myelinated axon terminating in an axonal bleb. Dendrites were omitted for simplicity and the only conductances present were gM and a linear leak (for further details, see Methods). Simulations of V ramps were performed under various regimes (Table2) and for x = 20–1500 μm. The M-conductance was modelled using the Hodgkin–Huxley formalism; the polynomial function f(V) was omitted because we are concerned only with subthreshold behaviour.
The results are presented in Fig. 7 and Table2. They are discussed in detail in the Appendix, where it is shown that Kv7 kinetics might account for the observed effect of ramp ‘direction’ (depolarizing vs. repolarizing) on the estimates of Vhalf (Cf. Table1 and Fig. 7D). Moreover, the modelling results suggest that the error on Vhalf was probably less than 1 mV, given that  was around 80 μm for the dorsal cells used in voltage-ramp experiments (regimes I–III in Fig. 7A). This is significantly less than the observed D–V difference in Vhalf [95% CI: 4.6 mV < Vhalf(V)−Vhalf(D) < 10.1 mV]. Therefore, this difference is probably genuine and may account in part for the more active M-conductance in dorsal CA1.
In addition, because functional Kv7/M-channels are found at the nodes of Ranvier, as well as the AIS (Devaux et al. 2004; Schwarz et al. 2006; Battefeld et al. 2014), it is reasonable to assume that cells with better preserved axons have a higher Gmax. Indeed, Gmax was positively correlated with x in dorsal cells (Fig. 7E) (*P < 0.05). No correlation between x and other parameters was found in dorsal and ventral cells (Fig. 7F–J). Hence, Gmax may have been underestimated in dorsal cells because of the shorter preserved axon length compared to ventral cells under our experimental conditions. The simulations suggest that this error is probably small. Nevertheless, if Gmax of Kv7/M-channels in vivo, with preserved axon, is even higher in dorsal cells, the conclusion that these channels have stronger impact in dorsal than ventral CA1 at subthreshold potentials will be strengthened even further.
The exact nature of the suprathreshold component f(V) remains to be determined. Nevertheless, f(V) was clearly higher in dorsal than in ventral cells. For example, at −25 mV the mean values of f(V) for dorsal and ventral cells were 5.2 (3.8) nS and 0.73 (1.02) nS, respectively (*P < 0.05; two-tailed, two-sample t test on the Box-Cox transformed data).
Difference in spike thresholds
Kv7/M-channels co-localize with Na+ channels in axonal structures (Devaux et al. 2004; Schwarz et al. 2006; Pan et al. 2006; Chung et al. 2006) where they regulate the spike threshold (Yue & Yaari, 2004; Schwarz et al. 2006; Shah et al. 2008). Therefore, a left-shift of the Kv7/M activation curve in dorsal relative to ventral CA1 (Table1) could in principle also shift the spike thresholds. To compare spike thresholds in dorsal and ventral pyramidal cells, we recorded spikes evoked by somatic injection of slow, depolarizing current ramps (50 pA/10 s, which corresponds to a voltage change of ∼1 mV s–1) in control and in the presence of XE991 (Fig. 8A and C). To measure the spike threshold for the first evoked spike, we used the corresponding dV/dt plots (Fig. 8B, D, E and F). We found that spike thresholds were significantly higher in dorsal than ventral cells in control [dorsal: −51.5 (3.0) mV; ventral: −56 (2.4) mV; *P < 0.05] (Fig. 8G). Application of XE991 lowered the spike threshold in both dorsal and ventral cells and simultaneously removed the significant D–V difference in spike thresholds [dorsal: −54.1 (3.5) mV; ventral: −57.1 (2.4) mV; not significant, P = 0.08]. Because spike thresholds vary with the slope of the preceding membrane depolarization (Azouz & Gray, 2000; Higgs & Spain, 2011), we also compared thresholds of the initial spikes evoked by square current pulses (using data from the experiments shown in Fig. 9). By contrast to our results with current ramps (Fig. 8), we found that these thresholds were not significantly different in dorsal and ventral cells, either in control medium [dorsal: −62.8 (1.8) mV, n = 7; ventral: −60.8 (2.6) mV, n = 7; not significant, P = 0.073] or in XE991 [dorsal: −64.1 (1.7) mV; ventral: −61.9 (1.7) mV; not significant, P = 0.059]. Again, XE991 lowered the spike threshold in both dorsal and ventral cells (**P < 0.01), as with slow depolarizations. Thus, the spike thresholds appear to be significantly higher in dorsal than ventral cells only during slow depolarizations but more similar upon abrupt depolarizations. This is presumably because the slow depolarizations allow the Kv7/M-channels to activate more before the threshold is reached. Because they converge after XE991, the difference in thresholds between dorsal and ventral cells is presumably caused by Kv7/M-channels.
As expected (Azouz & Gray, 2000; Higgs & Spain, 2011), we also saw that fast depolarizations triggered spikes with lower thresholds than those triggered by slow depolarizations, in both dorsal (control: **P < 0.01; after XE991: ***P < 0.001) and ventral cells (control: **P < 0.01; after XE991: **P < 0.01).
Differences in mAHP
Next, we examined the contribution of Kv7/M-channels to the mAHP in dorsal and ventral pyramidal cells (Fig. 9). We did this by comparing the membrane potential at the mAHP peaks following a train of five spikes before and after application of XE991 (10μM) (Fig. 9A–H). We found that the mAHP amplitude was significantly reduced by the Kv7/M-channel blocker (Fig. 9I) (dorsal: ***P < 0.001; ventral: *P < 0.05), confirming previous results (Storm, 1989; Gu et al. 2005). Furthermore, we found that the reduction in mAHP amplitude was significantly larger in dorsal than ventral pyramidal cells (Fig. 9J) [dorsal: −4.1 (1.8) mV; ventral: −1.9 (1.6) mV; *P < 0.05]. These findings can probably be explained by the larger XE991-sensitive conductance in dorsal cells, especially at depolarized potentials beyond–30 mV, as observed in our voltage-clamp recordings (Fig. 6). Thus, the spikes in dorsal cells will activate larger Kv7/M current and enhance the subsequent mAHP.
Kv7/M-channels contribute to D–V differences in somatic excitability and spike rate adaptation
Kv7/M-channels are known to contribute to excitability control and spike frequency adaptation in CA1 pyramidal cells and several other neuron types (Adams et al. 1982; Madison & Nicoll, 1984; Storm, 1989; Gu et al. 2005; Shah et al. 2008). However, to our knowledge, regional differences in the impact of this current within a single class of neurons have not been reported previously. To compare the contribution of Kv7/M-channels to excitability control in dorsal and ventral CA1 pyramidal cells, we first injected a family of depolarizing current pulses (1 s long) from −70 mV in normal medium (Fig. 10A, left; control). The resulting f-I curves, obtained by plotting the mean spike rate (spikes s–1) against the injected current, showed that the f/I slope was significantly steeper in ventral than in dorsal cells (Fig. 10B) [left, control; dorsal: 0.07 (0.03) spikes s–1 pA–1; ventral: 0.11 (0.03) spikes s–1 pA–1; **P < 0.01]. To test whether this D–V difference in f/I slope, and thus excitability, is mediated by Kv7/M-channels, we bath-applied XE991 (10 μm) (Fig. 10A, right). The blocker increased the f/I slope in the dorsal cells by ∼70% [from 0.07 (0.03) spikes s–1 pA–1 to 0.12 (0.04) spikes s–1 pA–1, ***P < 0.001] and in the ventral cells by ∼27% [from 0.11 (0.03) spikes s–1 pA–1 to 0.14 (0.045) spikes s–1 pA–1, **P < 0.01] and abolished the D–V difference in f/I slope (Fig. 10B, right) (not significant, P = 0.1). These results indicate that the D–V difference in excitability (f/I slope), is mainly caused by Kv7/M-channels.
Figure 10.

Kv7 channels contribute to differences in somatic excitability in dorsal and ventral CA1 pyramidal cells
A, examples of spike trains (mV) in dorsal (top) and ventral pyramidal cells (bottom) evoked by injected current pulses (250 pA, 1 s). Spike rates (spikes s–1) recorded in control conditions (black traces) increased after application of XE991 (10 μm) (red traces) in dorsal and ventral pyramidal cells. B, left: summary graph comparing spike rates in control conditions plotted against a range of injected current pulses in dorsal (black squares) and ventral pyramidal cells (grey squares). Linear fits were used to compare slopes between dorsal and ventral f/I curves (from 50 pA to 250 pA). Slope, control: dorsal: 0.07 (0.03) spikes s–1 pA–1; n = 14 cells; N = 9 rats; ventral: 0.11 (0.03) spikes s–1 pA–1; n = 14 cells; N = 9 rats; **P < 0.01. B, right: after application of XE991, the difference in f/I slopes was abolished compared to control conditions. Slope, after XE991: dorsal: 0.12 (0.04) spikes s–1 pA–1; ventral: 0.14 (0.045) spikes s–1 pA–1; not significant, P = 0.1 (two-way repeated measures ANOVA after Box-Cox transformation). Mean (SD).
Finally, we compared the spike frequency adaptation in dorsal and ventral CA1 pyramidal cells (Fig. 11). Because the adaptation rate within a spike train strongly depends on the initial spike rate of the train, it is necessary to compare spike trains with similar initial spike rates (Gu et al. 2008). We therefore first compared spike trains from dorsal and ventral cells with similar initial spike rates in normal medium (Fig. 11A, left). Here, the instantaneous spike rate of the 1st interspike interval (i.e. 1/ISI1) was 57.9 (21.6) spikes s–1 in dorsal cells vs. 52.6 (19.7) spikes s–1 in ventral cells (not significant, P = 0.72) (Fig. 11B). For these spike trains, the spike rates during the last 300 ms were lower in the dorsal than in the ventral cells [dorsal: 9.0 (6.6) spikes s–1; ventral: 17.6 (5.4) spikes s–1; *P < 0.05]. The difference between the initial spike rate and the spike rate in the last 300 ms was reflected in the adaptation index, as shown in Fig. 11C (see Methods; Gu et al. 2008). Thus, the adaptation index was higher in dorsal vs. ventral cells [dorsal: 86.1% (10.7%) ventral: 62.4% (17%), **P < 0.01] (Fig. 1C, black columns). Next, to test whether this D–V difference is also caused by Kv7/M-channels, we compared the adaptation index before and after applying XE991 (Fig. 11C, black vs. red columns), again always comparing spike trains with very similar initial spike rates [dorsal: 56.8 (23.1) spikes s–1; ventral: 53.4 (26.6) spikes s–1, not significant, P = 0.95) (Fig. 10B, red columns). After XE991 bath-application, there was no detectable difference in spike rate during the last 300 ms [dorsal: 13.3 (7.2) spikes s–1; ventral: 17.1 (7.1) spikes s–1, not significant, P = 0.34], and the adaptation index [dorsal: 77.2% (8.9%); ventral: 62.1% (25%); not significant, P = 0.15] (Fig. 10C, red columns). This result indicates that the D–V difference in spike frequency adaptation is largely caused by Kv7/M-channels.
Figure 11.

Spike rate adaptation is stronger in dorsal compared to ventral CA1 pyramidal cells and is partially mediated by Kv7 channels
A, examples of somatically recorded spike trains (mV) in dorsal (top) and ventral (bottom) pyramidal cells during control conditions (black) and after bath application of XE991 (10 μm) (red) evoked by injecting 1 s current pulses. To compare spike rate adaptation before and after application of XE991, the amplitudes of injected current pulses were reduced to obtain similar initial spike rates. B, average spike rates for the 1st interspike interval (1/ISI1, spikes s–1) were not significantly different in control (dorsal: 57.9 (21.6) spikes s–1; n = 7 cells; N = 5 rats; ventral: 52.6 (19.7) spikes s–1; n = 7 cells; N = 5 rats; not significant P = 0.72) or after XE991 application [dorsal: 56.8 (23.1) spikes s–1; ventral: 53.4 (26.6) spikes s–1; not significant P = 0.95] (two-way repeated measures ANOVA). C, adaptation index (%) (see Methods) was significantly higher in dorsal than in ventral pyramidal cells in control conditions [dorsal: 86.1% (10.7%); n = 7 cells; N = 5 rats; ventral: 62.4% (17%); n = 7 cells; N = 5 rats; **P < 0.01]. XE991 significantly reduced the adaptation index in dorsal pyramidal cells [control: 86.1% (10.7%); after XE991: 77.2% (8.9%); **P < 0.01] but not ventral pyramidal cells [control: 62.4% (17%); after XE991: 62.1% (25%); not significant, P = 0.76]. After XE991 application, the adaptation index was not significantly different in dorsal and ventral pyramidal cells (not significant, P = 0.15) (two-way repeated measures ANOVA after Johnson transformation). Mean (SD).
Discussion
In the present study, we found that the Kv7/M current (IM), identified as the XE991-sensitive current by somatic whole-cell voltage clamp, exhibits both a larger amplitude and a hyperpolarizing shift in its activation range, in dorsal relative to ventral CA1 pyramidal cells of 3- to 4-week-old rats. We also found a stronger functional impact of IM in dorsal than ventral CA1 pyramidal cells, including modulation of temporal summation (Fig. 4), IM-dependent theta resonance (M-resonance) (Fig. 5), spike threshold (Fig. 8), mAHP amplitude (Fig. 9), somatic excitability (Fig. 10) and spike frequency adaptation (Fig. 1). We did not find evidence for D–V differences in Ih- related properties (Fig. 1C–E), as reported previously (Marcelin et al. 2012a,b; Dougherty et al. 2013) in rats at different ages, and such differences may therefore be age-dependent.
Our results confirm that the total dendritic length and surface area were significantly greater in dorsal than ventral CA1 pyramidal cells in 3- to 4-week-old rats as previously shown in 4- to 8-week-old rats (Dougherty et al. 2012) (Fig. 2). By contrast, morphological D–V differences were previously not detected in 2-week-old rats (Marcelin et al. 2012a) and may therefore also be age-dependent.
Which mechanisms might account for the D–V differences in the voltage dependence and magnitude of IM?
In situ hybridization data from the Allen Mouse Brain Atlas support the idea of differences in gene expression along the D–V axis of the hippocampus (Dong et al. 2009). When comparing Allen Mouse Brain Atlas gene expression profiles of Kcnq2, 3 and 5 (encoding Kv 7.2, 7.3 and 7.5) in 8-week-old mice, there appear to be higher mRNA levels in dorsal than ventral CA1 (see Allen Mouse Brain Atlas website: http://mouse.brain-map.org). These data appear to fit with the larger IM and related properties in dorsal vs. ventral CA1 pyramidal cells of 3- to 4-week-old rats found in our present study. However, these data may only be indirectly correlated because there may be differences in: (1) gene expression across developmental stages and species; (2) translation to functional proteins and their subcellular location (axons, terminals); (3) channel turnover rate; and/or (4) post-translational modification and modulation of the channels, including (5) influence by other proteins.
A recent study showed that Kv 7.5 channels in presynaptic terminals can activate at remarkably negative potentials (Huang & Trussell, 2011). A similar, highly negative activation range of IM was previously found in hippocampal mossy fibre boutons (Alle et al. 2009; Storm et al. 2010). However, to what extent Kv 7.5 channels contribute to the voltage-dependence of somatically recorded IM in dorsal vs. ventral CA1 pyramidal cells remains to be determined (Schroeder et al. 2000). Other factors may also influence the biophysical properties of IM, including splice variants and other associated proteins (Jentsch, 2000; Xu et al. 2007; Roura-Ferrer et al. 2009).
Physiological significance of D–V differences in IM
Kv7/M-channels reduce excitability in a variety of neuron types (Brown & Adams, 1980; Madison & Nicoll, 1984; Storm, 1989; Storm, 1990) and Kcnq mutations are known to underlie certain forms of epilepsy (Jentsch, 2000; Steinlein, 2004; Peters et al. 2005). We tested the contribution of Kv7/M-channels to somatic excitability and found that the f/I curves were steeper (indicating higher excitability) in ventral than dorsal pyramidal cells in 3- to 4-week-old rats under control conditions (Fig. 10), in agreement with a previous study using 4- to 8-week-old rats (Dougherty et al. 2012). Blockade of Kv7/M-channels abolished the D–V difference in f/I slope. Thus, Kv7/M-channels appear to be the major cause of the lower excitability in dorsal vs. ventral CA1 pyramidal cells at least in 3- to 4-week-old rats. This factor may be an important reason for the higher tendency to epileptiform activity in ventral compared to dorsal hippocampus (Bragdon et al. 1986; Derchansky et al. 2004). This hypothesis is further supported by our findings that: 1 dorsal cells showed a significantly larger XE991-induced reduction in the mAHP amplitude than ventral cells (Fig. 9) and 2 the D–V difference in spike frequency adaptation was also abolished after blockade of Kv7/M-channels with XE991 (Fig. 1). Other cellular properties, such as the increased dendritic surface area (Fig. 2), may also contribute to lower Rinput and reduced excitability in dorsal cells of 3- to 4-week-old rats (Figs 1A and B and 10), as previously suggested in 4- to 8-week-old rats (Dougherty et al. 2012). We did not find a significant D–V difference in Rinput in TTX (Fig. 3), which may be a result of TTX blockade of the persistent Na+ current, combined with a smaller sample size. We found that Ih-related properties were similar in dorsal and ventral pyramidal cells (Figs 1C–E) and conclude that Ih probably has little or no impact on D–V differences in Rinput.
Relationship with other studies
Recently, it was shown that differential distributions of HCN and Kv 4.2 channels in dorsal and ventral CA1 pyramidal cells shape their integrative properties, including H-resonance, temporal summation and dendritic spike back-propagation (Marcelin et al. 2012a,b; Dougherty et al. 2013). First, it was found that Ih-related properties are more pronounced in dorsal than ventral CA1 pyramidal cells of young rats (age ∼2 weeks) (Marcelin et al. 2012a). These differences were accompanied by higher expression of HCN1 and HCN2 subunits in dorsal cells. By contrast, Ih - and A-current (IA)-related properties in older rats were more pronounced in ventral pyramidal cells, accompanied by a higher expression of HCN1 and HCN2 in ventral cells, according to (Marcelin et al. 2012b). Dougherty et al. confirmed these Ih- related differences in adult rats (4–8 weeks old), and proposed a depolarizing shift in the half-activation (Vhalf) of Ih in ventral vs. dorsal CA1, as a result of a higher HCN1/HCN2 expression ratio (Dougherty et al. 2013).
In our study we found a similar depolarizing shift in the Vhalf of IM in ventral vs. dorsal CA1 pyramidal cells (3- to 4-week-old rats) (Table1).
Although we did not directly test whether the voltage dependences IM and Ih covary, we compared the impact of Ih in dorsal and ventral cells by analyzing sag ratios and rebound potentials in response to negative current pulses, but found no evidence for D–V differences (Figs 1C–E). Combining results from different studies, it appears that Ih-related properties in rat CA1 pyramidal cells are (1) more pronounced in dorsal than ventral cells in the first 2 postnatal weeks (Marcelin et al. 2012a); (2) similar in dorsal and ventral cells in weeks 3–4 (present study); and (3) more pronounced in ventral than dorsal cells in weeks 4–8 (Marcelin et al. 2012b; Dougherty et al. 2013). Thus, we conclude that the D–V differences in IM-related properties that we report in the present study were not directly related to differences in Ih. It remains to be tested whether other voltage-gated ion channels, including M-channels, undergo differential developmental changes in dorsal vs. ventral hippocampus.
In dopaminergic neurons, the voltage dependences of IA and Ih were found to co-vary, thereby tuning the range of rebound delay and firing (Amendola et al. 2012). However, we found no evidence that Ih and IM co-vary along the D–V axis in 3- to 4-week-old rats. Nevertheless, changes in their biophysical properties during development may affect their range of interaction, and related functions. First, as a result of the overlapping activation ranges of Ih and IM, shifting their Vhalf values can alter synaptic integration and increase or decrease EPSP-spike coupling (George et al. 2009). Second, shifting Vhalf of Ih and IM, can tune the frequency preference of the cell, by changing subthreshold Ih and IM-dependent resonance (Marcelin et al. 2012a,b; Dougherty et al. 2013) (Fig. 5). Because M-resonance is boosted by the persistent Na+ current (INaP) (Hu et al. 2002, 2009), this current probably also contributes indirectly to the D–V difference in M-resonance strength. However, it remains to be determined whether INaP may also contribute directly, by D–V differences in Na+ channel conductance or voltage-dependence. It has been proposed that differences in resonance along the hippocampal D–V axis may contribute to the D–V difference in theta rhythmicity (Royer et al. 2010).
In conclusion, several lines of evidence indicate that rodent CA1 pyramidal cells are heterogeneous along the D–V axis, both in terms of morphology and membrane properties. In addition, recent studies indicate that there are subclasses of CA1 pyramidal cells even within the same layer and D–V level, with differences in (1) the topological origin of the axon (Thome et al. 2014) or (2) modulation by brain state (Mizuseki et al. 2011), or (3) metabotropic receptors (Graves et al. 2012). We also observed some variability of intrinsic properties within dorsal or ventral CA1 (e.g. M-resonance properties in Fig. 5), although it remains to be determined whether this is related to the subclasses mentioned above.
Functional impact on place fields and phase precession
The place fields of hippocampal pyramidal cells (place cells) are known to be substantially larger for ventral than for dorsal cells (Jung et al. 1994; Maurer et al. 2005; Kjelstrup et al. 2008; Royer et al. 2010). Can this gradient in place field size be caused, at least in part, by differences in IM, Ih or other intrinsic membrane currents? Although several factors may underlie this D–V gradient, the IM-related D–V differences described in the present study are likely to contribute. Previous work has shown that knockout of HCN1 can alter the size of grid cells in the entorhinal cortex (Giocomo et al. 2011) and place cells in the hippocampus (Hussaini et al. 2011) (but not phase precession in MEC grid cells; Eggink et al. 2014), demonstrating the relevance of Ih and intrinsic properties in vivo. By contrast, the roles of IM or other currents in grid or place field properties have received less attention. Recently, a modelling study suggested that IM and the persistent sodium current (INaP) are necessary for phase-precession in hippocampal place cells (Leung, 2011), meaning that each cell fires at a progressively earlier phase in relation to the extracellular theta rhythm as the animal crosses the place field (O'Keefe & Recce, 1993). In this model, Leung (2011) showed that simulations with strong subthreshold resonance, dependent on IM and INaP (but not Ih; see also Eggink et al. 2014), also exhibited a high rate of phase precession. A very recent study, using dynamic clamp in slices to simulate subthreshold dynamics of CA1 pyramidal cells, supports the idea that phase precession depends on IM (Kwag et al. 2014). Furthermore, it has been suggested that D–V differences in resonance properties may underlie a higher rate of phase precession in dorsal than ventral CA3 pyramidal cells (Kjelstrup et al. 2008; Royer et al. 2010). These observations also appear to agree with the idea that dorsal pyramidal cells encode precise spatial information linked to theta oscillations, whereas ventral pyramidal cells encode more non-spatial information and are weakly theta-modulated (O'Keefe & Recce, 1993; Royer et al. 2010).
In conclusion, our results indicate that the Kv7/M-channels underlying the M current differ substantially in their biophysical properties and functional impact in dorsal vs. ventral CA1 pyramidal cells. This IM-mediated cellular tuning is probaly important for differentiation of both rate coding and phase coding of spatial and non-spatial information along the D–V hippocampal axis. Future in vivo studies will be needed to test these hypotheses further and explore the functional roles of these mechanisms.
Acknowledgments
We thank members of the Storm laboratory, as well as Dr Hua Hu and Professor Paul Heggelund, for helpful discussions and comments on the manuscript.
Glossary
- αEPSP
artificial EPSP
- AIS
axon initial segment
- 4-AP
4-aminopyridine
- CA1
cornus ammonis area 1
- CI
confidence interval
- D–V
dorsoventral
- DL-AP5
dl-2-amino-5-phosphopentanoic acid
- DNQX
6,7-dinitroquinoxaline-2,3-dione
- FFT
fast Fourier transform
- gabazine
6-imino-3-(4-methoxyphenyl)-1(6H)-pyridazinebutanoic acid hydrobromide
- Gmax
maximum conductance
- IA
A-current
- Ih
h-current
- IM
M current
- mAHP
medium afterhyperpolarization following spikes
- MEC
medial entorhinal cortex
- RInput
input resistance
- TTX
tetrodotoxin
- Vhalf
voltage for half-maximum conductance
- XE991
10,10-bis(4-pyridinylmethyl)-9(10H)-anthracenone dihydrochloride
- ZD-7288
4-ethylphenylamino-1,2-dimethyl-6-methylaminopyrimidinum chloride
- ZAP
impedance (Z) amplitude profile
Appendix 1 Simulation of voltage-ramp experiments
Effect of preserved axon length on Boltzmann parameter estimates
The compartmental model of a CA1 pyramidal cell described in the Methods was used to assess the effect of preserved axon length (x) on parameter estimates obtained from the fits of eqn 1. The supra-threshold component f(V) was omitted because we are concerned only with subthreshold behaviour. Table2 defines the five regimes (I–V) for which simulations of somatic V ramps were performed [8 mV s–1, −98.5 → −8.5 mV (depolarizing) or vice versa (repolarizing)]. Simulation results are shown in Fig. 7A–C and Table2; D, dorsal cells; V, ventral cells. The XE991-sensitive conductance, G(V), was calculated from the difference between the simulated ramp current with  > 0 and the ramp current with
  = 0. Boltzmann parameters Gmax, Vhalf and k were estimated by fitting eqn 2 to this model prediction of G(V) but with G0 = f(V) = 0 (e.g. Fig. 7D). We take the fitted parameters Vhalf and k as estimates of the corresponding model kinetic parameters VM and kM (see Methods). The latter, together with
  , were chosen so as to obtain fitted Boltzmann parameters similar to those observed (Table1).
With a 20 μm long AIS, reducing x from 1.5 mm to 20 μm reduced Vhalf by an amount ΔVhalf < 1 mV (regimes I and II in Fig. 7A and Table2). Increasing the AIS length to 100 μm, which might be considered as a high value (Battefeld et al. 2014), produced a change ΔVhalf < 2 mV (regime III). These simulations were performed with an axial resistivity Ra = 150 Ω cm and Rm = 25 kΩ cm2. Decreasing Ra and increasing Rm produced larger ΔVhalf (regimes IV and V) but even with Ra = 37.5 Ω cm and Rm = 100 kΩ cm2, which might be considered as extreme values, ΔVhalf < 4 mV (regime V). Regimes I–IV may appear to be more plausible, suggesting ΔVhalf < 3 mV if the AIS is less than 100 μm long. Indeed, the simulations show that most of the change in the Boltzmann parameters occurs along the AIS, and so it is essentially complete by x = 100 μm (Fig. 7A–C). This is comparable with the x values for the dorsal cells used in V-ramp experiments (Fig. 7E–G) and so the observed changes in the Boltzmann parameters, when considered in relation to the model predictions, may also provide an estimate of the expected error on Vhalf. To this end, the 95% CI for the change in each parameter over 80 μm (corresponding to 20–100 μm in the model; Table2) was calculated from the regression lines in Fig. 7E–G. Taken together, the 95% CIs for Gmax (1.2 < ΔGmax < 4.1 nS) and k (−2.5 < Δk < 1.7 mV) argue against regimes IV and V (Table2), suggesting ΔVhalf < 2 mV. Consistent with this prediction, the 95% CI for ΔVhalf was −4.9 < ΔVhalf < 0.3 mV (Fig. 7F). This suggests that Vhalf might actually have decreased for larger x but, if it did increase, the change was most likely less than 1 mV. This is consistent with the model regimes I and II. The experimental error will be less than these estimates because the average Vhalf value is considered (Table1), corresponding to  = 81 μm (Fig. 7F). According to the model, Vhalf will not change much more for larger x (Fig. 7A). Based on these calculations, the observed D–V difference in x is expected to cause an error on Vhalf of < 1 mV. By contrast, the 95% CI for the experimentally observed D–V difference in Vhalf was 4.6 mV < Vhalf(V)−Vhalf(D) < 10.1 mV (calculated using the ‘average’ D and V data sets in Table1). This is larger even than the most extreme values predicted by the model (< 4 mV for regime V). Hence, there was probably a genuine difference in Vhalf between D and V cells.
Because the model predicts (Fig. 7B) and the data confirm (Fig. 7E) that Gmax increases with x, Gmax(D) may have been underestimated somewhat in the experiments. However, the model suggests that Gmax will not increase much beyond x = 100 μm and so, remembering that the observed  was ∼80 μm, the error on Gmax was most likely small, at least assuming regimes I–III obtain. The modelling results also suggest that kM (4 or 5 mV in the model) may have been significantly overestimated by the Boltzmann fits (i.e. k; Fig. 7C). However, this may not be of much importance. (Mateos-Aparicio et al. 2014) found that kM values in the range 7–11 mV had little effect on the predictions of their dentate granule cell model. The relative error on VM (as estimated by Vhalf) was fairly small [Fig. 7A; VM(D) = −51 mV and VM(V) = −46 mV in the model].
Effect of ramp ‘direction’ on the estimate of Vhalf
For Gmax and k, there was no significant effect of ramp ‘direction’ (Table1) but, for Vhalf, a paired-sample t test on the pooled data (dorsal + ventral) showed that Vhalf(repolarizing) < Vhalf(depolarizing) (Table1; see also Fig. 6I). The 95% CI for the difference was 4.0–6.8 mV (mean 5.4 mV). In this case, the ‘average’ values of Vhalf in Table1 may be regarded as the best estimates. Possibly, the ramps were too fast so that during depolarizing ramps gM did not have time to fully activate at each V [yielding an apparent right shift of G(V)], whereas, for repolarizing ramps, it did not have time to fully deactivate (giving an apparent left shift). However, it was necessary to set the time constant τ(VM) = 1 s in eqn 7 to obtain a difference in Vhalf comparable to the observed one (∼5 mV). This may be considered implausible for the one-component model described in the Methods, given the observed kinetics of gM activation and deactivation (Mateos-Aparicio et al. 2014; Battefeld et al. 2014). However, Mateos-Aparicio et al. (2014) concluded that for a number of published studies the following two-component model gave a better description of gM kinetics:
| 8 |
| 9 |
| 10 |
where m∞ is given by eqn 6, i = 1,2 and τ2 >> τ1. Fig. 7D shows simulations of depolarizing and repolarizing V ramps for a D cell (regime I, x = 100 μm) with τ1 = 100 ms, τ2 = 1 s, k1 = k2 = 10 mV, kM = 5 mV and V1 = V2 = VM = −60 mV (a more negative value of VM is needed with the second order Boltzmann to obtain Vhalf ≈ −50 mV with a first-order fit). The difference in Vhalf between the two curves is ∼5 mV. Thus, in principle, a two-component (fast + slow) model of M-channel gating might account for the effect of ramp direction. However we cannot exclude contributions from other causes, such as partial inactivation during the depolarizing ramp followed by recovery during the repolarizing ramp.
Additional information
Competing interests
The authors declare that they have no competing interests.
Author contributions
C.H., M.M., R.M. and J.F.S designed the experiments, modelling, and analysis. C.H. and M.M. performed the experiments. R.M. performed the computational modelling. C.H., M.M., R.M., performed the data analysis. C.H., M.M., R.M., J.F.S wrote the manuscript. All the authors approved the manuscript for publication.
Funding
This study was supported by the Norwegian Research Council and the University of Oslo.
Author's present address
M. Marosi, Department of Neurology, David Geffen School of Medicine at UCLA, Los Angeles, CA 90095, USA.
References
- Adams PR, Brown DA. Constanti A. M-currents and other potassium currents in bullfrog sympathetic neurones. J Physiol. 1982;330:537–572. doi: 10.1113/jphysiol.1982.sp014357. [DOI] [PMC free article] [PubMed] [Google Scholar]
- Alle H, Ostroumov K, Geiger J. Storm JF. M-current, persistent Na+ current, and subthreshold resonance recorded in mossy fiber boutons. 2009. (MFBs) in rat hippocampus. Program No. 42.2/D10. 2009 Neuroscience Meeting Planner. Society for Neuroscience, Chicago, IL, USA. Online. Ref Type: Abstract.
- Amendola J, Woodhouse A, Martin-Eauclaire MF. Goaillard JM. Ca2+/cAMP-sensitive covariation of IA and IH voltage dependences tunes rebound firing in dopaminergic neurons. J Neurosci. 2012;32:2166–2181. doi: 10.1523/JNEUROSCI.5297-11.2012. [DOI] [PMC free article] [PubMed] [Google Scholar]
- Azouz R. Gray CM. Dynamic spike threshold reveals a mechanism for synaptic coincidence detection in cortical neurons in vivo. Proc Natl Acad Sci USA. 2000;97:8110–8115. doi: 10.1073/pnas.130200797. [DOI] [PMC free article] [PubMed] [Google Scholar]
- Bannerman DM, Rawlins JNP, McHugh SB, Deacon RMJ, Yee BK, Bast T, Zhang WN, Pothuizen HHJ. Feldon J. Regional dissociations within the hippocampus – memory and anxiety. Neurosci Biobehav Rev. 2004;28:273–283. doi: 10.1016/j.neubiorev.2004.03.004. [DOI] [PubMed] [Google Scholar]
- Battefeld A, Tran BT, Gavrilis J, Cooper EC. Kole MHP. Heteromeric Kv7.2/7.3 channels differentially regulate action potential initiation and conduction in neocortical myelinated axons. J Neurosci. 2014;34:3719–3732. doi: 10.1523/JNEUROSCI.4206-13.2014. [DOI] [PMC free article] [PubMed] [Google Scholar]
- Bragdon AC, Taylor DM. Wilson WA. Potassium-induced epileptiform activity in area CA3 varies markedly along the septotemporal axis of the rat hippocampus. Brain Res. 1986;378:169–173. doi: 10.1016/0006-8993(86)90300-8. [DOI] [PubMed] [Google Scholar]
- Brown DA. Adams PR. Muscarinic suppression of a novel voltage-sensitive K+ current in a vertebrate neurone. Nature. 1980;283:673–676. doi: 10.1038/283673a0. [DOI] [PubMed] [Google Scholar]
- Carnevale NT. Hines ML. The NEURON Book. Cambridge University Press; 2009. Cambridge. [Google Scholar]
- Carter B, Giessel A, Sabatini B. Bean B. Transient sodium current at subthreshold voltages: activation by EPSP waveforms. Neuron. 2012;75:1081–1093. doi: 10.1016/j.neuron.2012.08.033. [DOI] [PMC free article] [PubMed] [Google Scholar]
- Chung HJ, Jan YN. Jan LY. Polarized axonal surface expression of neuronal KCNQ channels is mediated by multiple signals in the KCNQ2 and KCNQ3 C-terminal domains. Proc Natl Acad Sci USA. 2006;103:8870–8875. doi: 10.1073/pnas.0603376103. [DOI] [PMC free article] [PubMed] [Google Scholar]
- Derchansky M, Shahar E, Wennberg RA, Samoilova M, Jahromi SS, Abdelmalik PA, Zhang L. Carlen PL. Model of frequent, recurrent, and spontaneous seizures in the intact mouse hippocampus. Hippocampus. 2004;14:935–947. doi: 10.1002/hipo.20007. [DOI] [PubMed] [Google Scholar]
- Devaux JrmJ, Kleopa KA, Cooper EC. Scherer SS. KCNQ2 is a nodal K+ channel. J Neurosci. 2004;24:1236–1244. doi: 10.1523/JNEUROSCI.4512-03.2004. [DOI] [PMC free article] [PubMed] [Google Scholar]
- Dolorfo CL. Amaral DG. Entorhinal cortex of the rat: organization of intrinsic connections. J Comp Neurol. 1998;398:49–82. doi: 10.1002/(sici)1096-9861(19980817)398:1<49::aid-cne4>3.0.co;2-9. [DOI] [PubMed] [Google Scholar]
- Dong HW, Swanson LW, Chen L, Fanselow MS. Toga AW. Genomic-anatomic evidence for distinct functional domains in hippocampal field CA1. Proc Natl Acad Sci USA. 2009;106:11794–11799. doi: 10.1073/pnas.0812608106. [DOI] [PMC free article] [PubMed] [Google Scholar]
- Dougherty KA, Islam T. Johnston D. Intrinsic excitability of CA1 pyramidal neurones from the rat dorsal and ventral hippocampus. J Physiol. 2012;590:5707–5722. doi: 10.1113/jphysiol.2012.242693. [DOI] [PMC free article] [PubMed] [Google Scholar]
- Dougherty KA, Nicholson DA, Diaz L, Buss EW, Neuman KM, Chetkovich DM. Johnston D. Differential expression of HCN subunits alters voltage-dependent gating of h-channels in CA1 pyramidal neurons from dorsal and ventral hippocampus. J Neurophysiol. 2013;109:1940–1953. doi: 10.1152/jn.00010.2013. [DOI] [PMC free article] [PubMed] [Google Scholar]
- Drummond GB. Reporting ethical matters in The Journal of Physiology: standards and advice. J Physiol. 2009;587:713–719. doi: 10.1113/jphysiol.2008.167387. [DOI] [PMC free article] [PubMed] [Google Scholar]
- Eggink H, Mertens P, Storm E. Giocomo LM. Hyperpolarization-activated cyclic nucleotide-gated 1 independent grid cell-phase precession in mice. Hippocampus. 2014;24:249–256. doi: 10.1002/hipo.22231. [DOI] [PubMed] [Google Scholar]
- Fanselow MS. Dong HW. Are the dorsal and ventral hippocampus functionally distinct structures? Neuron. 2010;65:7–19. doi: 10.1016/j.neuron.2009.11.031. [DOI] [PMC free article] [PubMed] [Google Scholar]
- Garden DLF, Dodson PD, O'Donnell C, White MD. Nolan MF. Tuning of synaptic integration in the medial entorhinal cortex to the organization of grid cell firing fields. Neuron. 2008;60:875–889. doi: 10.1016/j.neuron.2008.10.044. [DOI] [PubMed] [Google Scholar]
- Gastrein P, Campanac E, Gasselin C, Cudmore RH, Bialowas A, Carlier E, Fronzaroli-Molinieres L, Ankri N. Debanne D. The role of hyperpolarization-activated cationic current in spike-time precision and intrinsic resonance in cortical neurons in vitro. J Physiol. 2011;589:3753–3773. doi: 10.1113/jphysiol.2011.209148. [DOI] [PMC free article] [PubMed] [Google Scholar]
- George MS, Abbott LF. Siegelbaum SA. HCN hyperpolarization-activated cation channels inhibit EPSPs by interactions with M-type K+ channels. Nat Neurosci. 2009;12:577–584. doi: 10.1038/nn.2307. [DOI] [PMC free article] [PubMed] [Google Scholar]
- Giocomo LM, Hussaini SA, Zheng F, Kandel ER, Moser M-B. Moser EI. Grid cells use HCN1 channels for spatial scaling. Cell. 2011;147:1159–1170. doi: 10.1016/j.cell.2011.08.051. [DOI] [PubMed] [Google Scholar]
- Giocomo LM. Hasselmo ME. Knock-out of HCN1 subunit flattens dorsal–ventral frequency gradient of medial entorhinal neurons in adult mice. J Neurosci. 2009;29:7625–7630. doi: 10.1523/JNEUROSCI.0609-09.2009. [DOI] [PMC free article] [PubMed] [Google Scholar]
- Giocomo LM, Zilli EA, Fransen E. Hasselmo ME. Temporal frequency of subthreshold oscillations scales with entorhinal grid cell field spacing. Science. 2007;315:1719–1722. doi: 10.1126/science.1139207. [DOI] [PMC free article] [PubMed] [Google Scholar]
- Graves A, Moore S, Bloss E, Mensh B, Kath W. Spruston N. Hippocampal pyramidal neurons comprise two distinct cell types that are countermodulated by metabotropic receptors. Neuron. 2012;76:776–789. doi: 10.1016/j.neuron.2012.09.036. [DOI] [PMC free article] [PubMed] [Google Scholar]
- Gu N, Hu H, Vervaeke K. Storm JF. SK (KCa2) channels do not control somatic excitability in CA1 pyramidal neurons but can be activated by dendritic excitatory synapses and regulate their impact. J Neurophysiol. 2008;100:2589–2604. doi: 10.1152/jn.90433.2008. [DOI] [PubMed] [Google Scholar]
- Gu N, Vervaeke K, Hu H. Storm JF. Kv7/KCNQ/M and HCN/h, but not KCa2/SK channels, contribute to the somatic medium after-hyperpolarization and excitability control in CA1 hippocampal pyramidal cells. J Physiol. 2005;566:689–715. doi: 10.1113/jphysiol.2005.086835. [DOI] [PMC free article] [PubMed] [Google Scholar]
- Hafting T, Fyhn M, Molden S, Moser MB. Moser EI. Microstructure of a spatial map in the entorhinal cortex. Nature. 2005;436:801–806. doi: 10.1038/nature03721. [DOI] [PubMed] [Google Scholar]
- Halliwell JV. Adams PR. Voltage-clamp analysis of muscarinic excitation in hippocampal neurons. Brain Res. 1982;250:71–92. doi: 10.1016/0006-8993(82)90954-4. [DOI] [PubMed] [Google Scholar]
- Higgs MH. Spain WJ. Kv1 channels control spike threshold dynamics and spike timing in cortical pyramidal neurones. J Physiol. 2011;589:5125–5142. doi: 10.1113/jphysiol.2011.216721. [DOI] [PMC free article] [PubMed] [Google Scholar]
- Hönigsperger C, Marosi M. Storm JF. Characteristics of subthreshold membrane dynamics in dorsal and ventral CA1 pyramidal neurons. 2012. Abstract No. 2125/B104 2012 Forum of Neuroscience Program. Federation of European Neuroscience Societies. Ref Type: Abstract.
- Hu H, Vervaeke K, Graham LJ. Storm JF. Complementary theta resonance filtering by two spatially segregated mechanisms in CA1 hippocampal pyramidal neurons. J Neurosci. 2009;29:14472–14483. doi: 10.1523/JNEUROSCI.0187-09.2009. [DOI] [PMC free article] [PubMed] [Google Scholar]
- Hu H, Vervaeke K. Storm JF. Two forms of electrical resonance at theta frequencies, generated by M-current, h-current and persistent Na+ current in rat hippocampal pyramidal cells. J Physiol. 2002;545:783–805. doi: 10.1113/jphysiol.2002.029249. [DOI] [PMC free article] [PubMed] [Google Scholar]
- Hu H, Vervaeke K. Storm JF. M-channels (Kv7/KCNQ channels) that regulate synaptic integration, excitability, and spike pattern of CA1 pyramidal cells are located in the perisomatic region. J Neurosci. 2007;27:1853–1867. doi: 10.1523/JNEUROSCI.4463-06.2007. [DOI] [PMC free article] [PubMed] [Google Scholar]
- Huang H. Trussell LO. KCNQ5 channels control resting properties and release probability of a synapse. Nat Neurosci. 2011;14:840–847. doi: 10.1038/nn.2830. [DOI] [PMC free article] [PubMed] [Google Scholar]
- Hussaini S, Kempadoo K, Thuault S, Siegelbaum S. Kandel E. Increased size and stability of CA1 and CA3 place fields in HCN1 knockout mice. Neuron. 2011;72:643–653. doi: 10.1016/j.neuron.2011.09.007. [DOI] [PMC free article] [PubMed] [Google Scholar]
- Hutcheon B. Yarom Y. Resonance, oscillation and the intrinsic frequency preferences of neurons. Trends Neurosci. 2000;23:216–222. doi: 10.1016/s0166-2236(00)01547-2. [DOI] [PubMed] [Google Scholar]
- Jensen HS, Grunnet M. Olesen S-P. Inactivation as a new regulatory mechanism for neuronal Kv7 channels. Biophys J. 2007;92 doi: 10.1529/biophysj.106.101287. [DOI] [PMC free article] [PubMed] [Google Scholar]
- Jentsch TJ( Neuronal KCNQ potassium channels: physiology and role in disease. Nat Rev Neurosci. 2000;1:21–30. doi: 10.1038/35036198. [DOI] [PubMed] [Google Scholar]
- Jung MW, Wiener SI. McNaughton BL. Comparison of spatial firing characteristics of units in dorsal and ventral hippocampus of the rat. J Neurosci. 1994;14:7347–7356. doi: 10.1523/JNEUROSCI.14-12-07347.1994. [DOI] [PMC free article] [PubMed] [Google Scholar]
- Kjelstrup KB, Solstad T, Brun VH, Hafting T, Leutgeb S, Witter MP, Moser EI. Moser MB. Finite scale of spatial representation in the hippocampus. Science. 2008;321:140–143. doi: 10.1126/science.1157086. [DOI] [PubMed] [Google Scholar]
- Koch C( Cable theory in neurons with active, linearized membranes. Biol Cybern. 1984;50:15–33. doi: 10.1007/BF00317936. [DOI] [PubMed] [Google Scholar]
- Kole M. Stuart G. Signal processing in the axon initial segment. Neuron. 2012;73:235–247. doi: 10.1016/j.neuron.2012.01.007. [DOI] [PubMed] [Google Scholar]
- Kutner MH, Nachtsheim CJ, Newman EL. Li W. Applied Linear Statistical Models. McGraw–Hill, Irwin. 2004 [Google Scholar]
- Kwag J, Jang HJ, Kim M. Lee S. M-type potassium conductance controls the emergence of neural phase codes: a combined experimental and neuron modelling study. J R Soc Interface. 2014;11 doi: 10.1098/rsif.2014.0604. [DOI] [PMC free article] [PubMed] [Google Scholar]
- Lein ES, Hawrylycz MJ, Ao N, Ayres M, Bensinger A, Bernard A, Boe AF, Boguski MS, Brockway KS, Byrnes EJ, Chen L, Chen L, Chen TM, Chi Chin M, Chong J, Crook BE, Czaplinska A, Dang CN, Datta S, Dee NR, Desaki AL, Desta T, Diep E, Dolbeare TA, Donelan MJ, Dong HW, Dougherty JG, Duncan BJ, Ebbert AJ, Eichele G, Estin LK, Faber C, Facer BA, Fields R, Fischer SR, Fliss TP, Frensley C, Gates SN, Glattfelder KJ, Halverson KR, Hart MR, Hohmann JG, Howell MP, Jeung DP, Johnson RA, Karr PT, Kawal R, Kidney JM, Knapik RH, Kuan CL, Lake JH, Laramee AR, Larsen KD, Lau C, Lemon TA, Liang AJ, Liu Y, Luong LT, Michaels J, Morgan JJ, Morgan RJ, Mortrud MT, Mosqueda NF, Ng LL, Ng R, Orta GJ, Overly CC, Pak TH, Parry SE, Pathak SD, Pearson OC, Puchalski RB, Riley ZL, Rockett HR, Rowland SA, Royall JJ, Ruiz MJ, Sarno NR, Schaffnit K, Shapovalova NV, Sivisay T, Slaughterbeck CR, Smith SC, Smith KA, Smith BI, Sodt AJ, Stewart NN, Stumpf KR, Sunkin SM, Sutram M, Tam A, Teemer CD, Thaller C, Thompson CL, Varnam LR, Visel A, Whitlock RM, Wohnoutka PE, Wolkey CK, Wong VY, Wood M, Yaylaoglu MB, Young RC, Youngstrom BL, Feng Yuan X, Zhang B, Zwingman TA. Jones AR. Genome-wide atlas of gene expression in the adult mouse brain. Nature. 2007;445:168–176. doi: 10.1038/nature05453. [DOI] [PubMed] [Google Scholar]
- Leung LS( A model of intracellular theta phase precession dependent on intrinsic subthreshold membrane currents. J Neurosci. 2011;31:12282–12296. doi: 10.1523/JNEUROSCI.0586-11.2011. [DOI] [PMC free article] [PubMed] [Google Scholar]
- Madison DV. Nicoll RA. Control of the repetitive discharge of rat CA1 pyramidal neurones in vitro. J Physiol. 1984;354:319–331. doi: 10.1113/jphysiol.1984.sp015378. [DOI] [PMC free article] [PubMed] [Google Scholar]
- Maggio N. Segal M. Striking variations in corticosteroid modulation of long-term potentiation along the septotemporal axis of the hippocampus. J Neurosci. 2007;27:5757–5765. doi: 10.1523/JNEUROSCI.0155-07.2007. [DOI] [PMC free article] [PubMed] [Google Scholar]
- Marcelin B, Liu Z, Chen Y, Lewis AS, Becker A, McClelland S, Chetkovich DM, Migliore M, Baram TZ, Esclapez M. Bernard C. Dorsoventral differences in intrinsic properties in developing CA1 pyramidal cells. J Neurosci. 2012;32:3736–3747. doi: 10.1523/JNEUROSCI.5870-11.2012. [DOI] [PMC free article] [PubMed] [Google Scholar]
- Marcelin B, Lugo jN, Brewster AL, Liu Z, Lewis AS, McClelland S, Chetkovich DM, Baram TZ, Anderson AE, Becker A, Esclapez M. Bernard C. Differential dorso-ventral distributions of Kv4.2 and HCN proteins confer distinct integrative properties to hippocampal CA1 pyramidal cell distal dendrites. J Biol Chem. 2012;287:17656–17661. doi: 10.1074/jbc.C112.367110. [DOI] [PMC free article] [PubMed] [Google Scholar]
- Marosi M, Hönigsperger C. Storm JF. Differences in intrinsic properties between dorsal and ventral CA1 pyramidal neurons. 2012. 2012 Neuroscience Meeting Planner. Society for Neuroscience, New Orleans, LA, USA. Online. Ref Type: Abstract.
- Mateos-Aparicio P, Murphy R. Storm JF. Complementary functions of SK and Kv7/M potassium channels in excitability control and synaptic integration in rat hippocampal dentate granule cells. J Physiol. 2014;592:669–693. doi: 10.1113/jphysiol.2013.267872. [DOI] [PMC free article] [PubMed] [Google Scholar]
- Maurer AP, VanRhoads SR, Sutherland GR, Lipa P. McNaughton BL. Self-motion and the origin of differential spatial scaling along the septo-temporal axis of the hippocampus. Hippocampus. 2005;15:841–852. doi: 10.1002/hipo.20114. [DOI] [PubMed] [Google Scholar]
- Mizuseki K, Diba K, Pastalkova E. Buzsaki G. Hippocampal CA1 pyramidal cells form functionally distinct sublayers. Nat Neurosci. 2011;14:1174–1181. doi: 10.1038/nn.2894. [DOI] [PMC free article] [PubMed] [Google Scholar]
- Moser MB. Moser EI. Functional differentiation in the hippocampus. Hippocampus. 1998;8:608–619. doi: 10.1002/(SICI)1098-1063(1998)8:6<608::AID-HIPO3>3.0.CO;2-7. [DOI] [PubMed] [Google Scholar]
- O'Keefe J. Dostrovsky J. The hippocampus as a spatial map. Preliminary evidence from unit activity in the freely-moving rat. Brain Res. 1971;34:171–175. doi: 10.1016/0006-8993(71)90358-1. [DOI] [PubMed] [Google Scholar]
- O'Keefe J. Recce ML. Phase relationship between hippocampal place units and the EEG theta rhythm. Hippocampus. 1993;3:317–330. doi: 10.1002/hipo.450030307. [DOI] [PubMed] [Google Scholar]
- Pan Z, Kao T, Horvath Z, Lemos J, Sul JY, Cranstoun SD, Bennett V, Scherer SS. Cooper EC. A common ankyrin-G-based mechanism retains KCNQ and NaV channels at electrically active domains of the axon. J Neurosci. 2006;26:2599–2613. doi: 10.1523/JNEUROSCI.4314-05.2006. [DOI] [PMC free article] [PubMed] [Google Scholar]
- Papatheodoropoulos C. Kostopoulos G. Decreased ability of rat temporal hippocampal CA1 region to produce long-term potentiation. Neurosci Lett. 2000;279:177–180. doi: 10.1016/s0304-3940(99)01002-2. [DOI] [PubMed] [Google Scholar]
- Peters HC, Hu H, Pongs O, Storm JF. Isbrandt D. Conditional transgenic suppression of M channels in mouse brain reveals functions in neuronal excitability, resonance and behavior. Nat Neurosci. 2005;8:51–60. doi: 10.1038/nn1375. [DOI] [PubMed] [Google Scholar]
- Prasad JA. Chudasama Y. Viral tracing identifies parallel disynaptic pathways to the hippocampus. J Neurosci. 2013;33:8494–8503. doi: 10.1523/JNEUROSCI.5072-12.2013. [DOI] [PMC free article] [PubMed] [Google Scholar]
- Quinn GP. Keough MJ. Experimental Design and Data Analysis for Biologists. Cambridge University Press; 2002. Cambridge. [Google Scholar]
- Risold PY. Swanson LW. Structural evidence for functional domains in the rat hippocampus. Science. 1996;272:1484–1486. doi: 10.1126/science.272.5267.1484. [DOI] [PubMed] [Google Scholar]
- Roura-Ferrer M, Etxebarria A, Sole L, Oliveras A, Comes N, Villarroel A. Felipe A. Functional implications of KCNE subunit expression for the Kv7.5 (KCNQ5) channel. Cell Physiol Biochem. 2009;24:325–334. doi: 10.1159/000257425. [DOI] [PubMed] [Google Scholar]
- Royer S, Sirota A, Patel J. Buzsaki G. Distinct representations and theta dynamics in dorsal and ventral hippocampus. J Neurosci. 2010;30:1777–1787. doi: 10.1523/JNEUROSCI.4681-09.2010. [DOI] [PMC free article] [PubMed] [Google Scholar]
- Schroeder BC, Hechenberger M, Weinreich F, Kubisch C. Jentsch TJ. KCNQ5, a novel potassium channel broadly expressed in brain, mediates M-type currents. J Biol Chem. 2000;275:24089–24095. doi: 10.1074/jbc.M003245200. [DOI] [PubMed] [Google Scholar]
- Schwarz JR, Glassmeier G, Cooper EC, Kao TC, Nodera H, Tabuena D, Kaji R. Bostock H. KCNQ channels mediate IKs, a slow K+ current regulating excitability in the rat node of Ranvier. J Physiol. 2006;573:17–34. doi: 10.1113/jphysiol.2006.106815. [DOI] [PMC free article] [PubMed] [Google Scholar]
- Shah MM, Mistry M, Marsh SJ, Brown DA. Delmas P. Molecular correlates of the M-current in cultured rat hippocampal neurons. J Physiol. 2002;544:29–37. doi: 10.1113/jphysiol.2002.028571. [DOI] [PMC free article] [PubMed] [Google Scholar]
- Shah MM, Migliore M, Valencia I, Cooper EC. Brown DA. Functional significance of axonal Kv7 channels in hippocampal pyramidal neurons. Proc Natl Acad Sci USA. 2008;105:7869–7874. doi: 10.1073/pnas.0802805105. [DOI] [PMC free article] [PubMed] [Google Scholar]
- Shu Y, Hasenstaub A, Duque A, Yu Y. McCormick DA. Modulation of intracortical synaptic potentials by presynaptic somatic membrane potential. Nature. 2006;441:761–765. doi: 10.1038/nature04720. [DOI] [PubMed] [Google Scholar]
- Steinlein OK. Genes and mutations in human idiopathic epilepsy. Brain Dev. 2004;26:213–218. doi: 10.1016/S0387-7604(03)00149-9. [DOI] [PubMed] [Google Scholar]
- Storm JF( An after-hyperpolarization of medium duration in rat hippocampal pyramidal cells. J Physiol. 1989;409:171–190. doi: 10.1113/jphysiol.1989.sp017491. [DOI] [PMC free article] [PubMed] [Google Scholar]
- Storm JF, Alle H. Geiger J. Subthreshold resonance caused by M-current and persistent sodium current recorded in mossy fiber boutons in rat hippocampus. 2010. Abstract No. 013.37/B72 2010 Forum of Neuroscience Program. Federation of European Neuroscience Societies. Ref Type: Abstract.
- Storm JF. Chapter 12. Potassium currents in hippocampal pyramidal cells. In: Storm-Mathisen J, editor. Prog Brain Res Understanding the Brain Through the Hippocampus. The Hippocampal Region as a Model for Studying Brain Structure and Function. Amsterdam: Elsevier; 1990. pp. 161–187. [DOI] [PubMed] [Google Scholar]
- Sun J. Kapur J. M-type potassium channels modulate Schaffer-collateral CA1 glutamatergic synaptic transmission. J Physiol. 2012;590:3953–3964. doi: 10.1113/jphysiol.2012.235820. [DOI] [PMC free article] [PubMed] [Google Scholar]
- Swanson LW. Cowan WM. An autoradiographic study of the organization of the efferet connections of the hippocampal formation in the rat. J Comp Neurol. 1977;172:49–84. doi: 10.1002/cne.901720104. [DOI] [PubMed] [Google Scholar]
- Tatulian L, Delmas P, Abogadie FC. Brown DA. Activation of expressed KCNQ potassium currents and native neuronal M-type potassium currents by the anti-convulsant drug retigabine. J Neurosci. 2001;21:5535–5545. doi: 10.1523/JNEUROSCI.21-15-05535.2001. [DOI] [PMC free article] [PubMed] [Google Scholar]
- Thome C, Kelly T, Yanez A, Schultz C, Engelhardt M, Cambridge S, Both M, Draguhn A, Beck H. Egorov A. Axon-carrying dendrites convey privileged synaptic input in hippocampal neurons. Neuron. 2014;83:1418–1430. doi: 10.1016/j.neuron.2014.08.013. [DOI] [PubMed] [Google Scholar]
- Vervaeke K, Gu N, Agdestein C, Hu H. Storm JF. Kv7/KCNQ/M-channels in rat glutamatergic hippocampal axons and their role in regulation of excitability and transmitter release. J Physiol. 2006;576:235–256. doi: 10.1113/jphysiol.2006.111336. [DOI] [PMC free article] [PubMed] [Google Scholar]
- Vervaeke K, Hu H, Graham LJ. Storm JF. Contrasting effects of the persistent Na+ current on neuronal excitability and spike timing. Neuron. 2006;49:257–270. doi: 10.1016/j.neuron.2005.12.022. [DOI] [PubMed] [Google Scholar]
- Wang HS, Pan Z, Shi W, Brown BS, Wymore RS, Cohen IS, Dixon JE. McKinnon D. KCNQ2 and KCNQ3 potassium channel subunits: molecular correlates of the M-channel. Science. 1998;282:1890–1893. doi: 10.1126/science.282.5395.1890. [DOI] [PubMed] [Google Scholar]
- Witter MP, Groenewegen HJ, Lopes da Silva FH. Lohman AHM Functional organization of the extrinsic and intrinsic circuitry of the parahippocampal region. Prog Neurobiol. 1989;33:161–253. doi: 10.1016/0301-0082(89)90009-9. [DOI] [PubMed] [Google Scholar]
- Xu T, Nie L, Zhang Y, Mo J, Feng W, Wei D, Petrov E, Calisto LE, Kachar B, Beisel KW, Vazquez AE. Yamoah EN. Roles of alternative splicing in the functional properties of inner ear-specific KCNQ4 channels. J Biol Chem. 2007;282:23899–23909. doi: 10.1074/jbc.M702108200. [DOI] [PubMed] [Google Scholar]
- Yue C. Yaari Y. KCNQ/M channels control spike afterdepolarization and burst generation in hippocampal neurons. J Neurosci. 2004;24:4614–4624. doi: 10.1523/JNEUROSCI.0765-04.2004. [DOI] [PMC free article] [PubMed] [Google Scholar]