

Abstract
Background
We have developed a 4D lung cancer model that forms perfusable tumor nodules. We determined if the model could be modified to mimic metastasis.
Methods
We modified the 4D lung cancer model by seeding H1299, A549, or H460 cells via the trachea only to the left lobes of the acellular lung matrix. The model was modified so that the tumor cells can reach the right lobes of the acellular lung matrix only through the pulmonary artery as circulating tumor cells (CTC). We determined the gene expressions of the primary tumor, CTCs, and metastatic lesions using the Human OneArray chip.
Results
All cell lines formed a primary tumor in the left lobe of the ex vivo 4D lung cancer model. The CTCs were identified in the media and increased over time. All cell lines formed metastatic lesions with H460 forming significantly more metastatic lesions than H1299 and A549 cells. The CTC gene signature predicted poor survival in lung cancer patients. Unique genes were significantly expressed in CTC compared to the primary tumor and metastatic lesion.
Conclusions
The 4D lung cancer model can isolate tumor cells in three phases of tumor progression. This 4D lung cancer model may mimic the biology of lung cancer metastasis and may be used to determine its mechanism and potential therapy in the future.
Keywords: 4D model, lung cancer, Metastasis
Introduction
At the time of presentation, most lung cancer patients have metastatic disease (1) that ultimately leads to patient death. Although there are some in vivo models that can mimic this process, there are currently no ex vivo or in vitro models that can mimic the biology of tumor metastasis. Our current understanding of metastatic process is derived from in vivo models (2-7) and by observing lung cancer progression in patients. Without treatment, a primary tumor forms in the lung, which travels to the local then regional lymph nodes and ultimately to other organs. In animal models and in patients, we can easily identify both the primary tumor and the metastatic lesions, but it is difficult to identify the tumor cells that travel from the primary site to the metastatic lesion. Recent advances in the detection of circulating tumor cells (CTC) in patients (8) and in labeling of tumor cells and identification of CTCs in vivo (9) have shown that there is a unique population in the circulation that can form metastasis. An ex vivo system that can mimic the entire three phase process of primary tumor growth, CTC formation, and the formation of metastatic lesions regardless of the origin of the lung cancer cell can be helpful to better understand the mechanism of metastasis.
We have recently developed a primary tumor model that can form perfusable tumor nodules (10) that grow over time and mimic the human lung cancer protease production (11) and gene expression signature that predicts poor survival in lung cancer patients (12). In this study, we modified the model so the only way for any tumor cells to form metastatic lesions is for the primary tumor to grow in one lobe of the lung, CTCs to form and intravasate into the vasculature and extravasate into other parts of the lung to form metastatic lesions. We evaluated the CTC gene signature and its relation to patient survival as well as the genes involved in CTC formation to determine its potential mechanism.
Material and Methods
Cell culture
We used the human lung cancer cell lines A549, H1299, and H460 (American Type Tissue Collection (ATCC), Manassas, VA, USA). These cells were cultured in complete media composed of RPMI1640 (Gibco, NY, USA) with 10% FBS (Gibco, NY, USA) and antibiotics (100 IU/mL penicillin, 100 μg/mL streptomycin, and 0.25 μg/mL amphotericin; MP Biomedicals, Solon, OH, USA) at 37°C in 5% CO2.
4D lung cancer metastasis model
All animal experiments were approved by the Institutional Animal Care and Use Committee at Houston Methodist Research Institute.
We harvested the lung and heart block from a Sprague Dawley rat and decellularized it as previously described (10). We tied the right main bronchus with a silk tie that was left there for entire experiment and placed it in the bioreactor as previously described (10). The acellular lung's trachea was connected to the trachea cannula with a tie connected to a one-way valve. The pulmonary artery cannula was connected to a pump and an oxygenator (Figure 1). The 4D lung model was seeded with 25 million A549, H1299, or H460 cells diluted in 50 ml of complete media through the trachea (n=3). All of the cells went to the left lung since there was a tie on the right main bronchus. The only way for any tumor cells to populate the right lung is for tumor cells to intravasate at the primary tumor in the left lung and travel in the circulation through the pulmonary artery to the right lung where they extravasate and form metastatic lesions. The model is not ventilated but it is expanded due to the flow from the pulmonary artery. The bioreactor media was replaced with fresh complete media every day for 25 days. There were live CTC in the media were counted and stored in Trizol (Iso-RNA Lysis reagent) at -80°C. The primary tumor from the 4D model seeded with H1299 was isolated on day 2 (n=3), which is the first day of the formation of the tumor nodule and prior to CTC formation and day 25 (n=3) for the 4D model seeded with H1299, A549, or H460. The metastatic lesion was isolated by performing a lobectomy of the right upper lobe on day 10, the right middle lobe on day 20, and the right lower lobe on day 25. The lobectomy was performed by a mass ligation of the branch pulmonary artery, pulmonary vein and bronchus with 3-0 silk suture. A portion of the primary tumor and the metastatic lesions were fixed in 10% formalin for Hematoxylin and Eosin (H&E) staining and the rest were placed in Trizol (Iso-RNA Lysis reagent) at -80°C. We took images of the H&E slides using an EVOS XL microscope (Fisher Scientific, USA). The metastatic lesion per high power field was determined by averaging the number of tumor cells per high power field (40×) of 5 random areas.
Figure 1. Schematic representation of 4D lung cancer metastasis model.
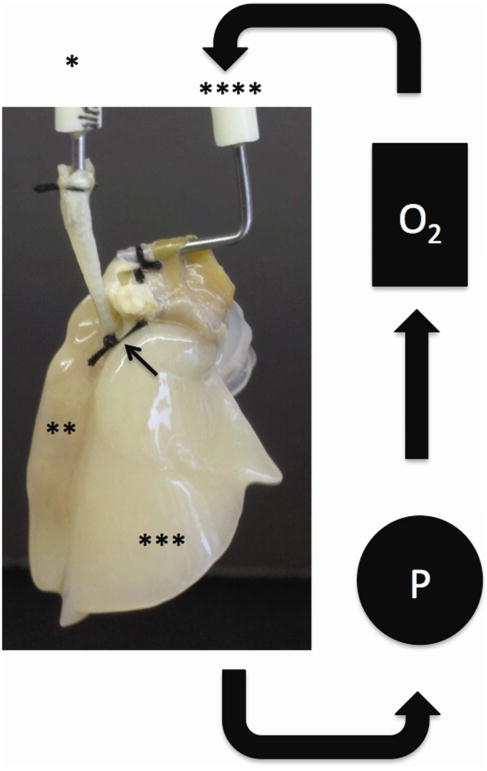
A silk tie (black arrow) is placed around the right main bronchus to prevent any tumor cells from going into the right lung. The tumor cell is placed through the one-way trachea cannula (*) that populates the left lung (**). Complete media is placed in the reservoir of the closed system that is pulled out by a pump (P) and run through the oxygenator (O2) then back to the lung through the pulmonary artery cannula (****).
Gene expression array
The total RNA was extracted from the primary tumor, CTCs, and metastatic lesions of the 4D model with the DirectZol RNA extraction kit (Zymo Research, USA). The RNA was treated with DNase as per the manufacturer's instructions. OneArray microarray was used to determine the gene expression profile for the tumor cell in each of these three phases and the two time points. Approximately 2 to 10 micrograms of RNA were shipped to the Phalanx Biotech Service Center (Belmont, CA, USA) for expression array using the Human OneArray v5 chip (version HOA 6.1). Array data have been deposited into the Gene Expression Omnibus (GEO GSE50991 and GSE58355). The gene expression data were quantile normalized. Technical replicates (there being three technical replicates per biological replicate) were averaged together and t-tests were performed (using log-transformed data) for group comparisons. We performed Gene Ontology analysis with up- and down-regulated genes, using SigTerms (13) enrichment p-values were by one-sided Fisher's exact test. The “compendium” dataset, of 11 published expression profiling datasets for human lung adenocarcinomas (n = 1,492 tumors), has been described elsewhere (12), and previously-described “t-score” metric was derived for each human tumor profile in relation to the experimental signature (12). We validated IL-6 (Forward (F) primer – GGTCAGAAACCTGTCCACTG and reverse (R) primer –CAAGAAATGATCTGGCTCTG), IL-11 (F primer – GACATGAAACAGCAGGCTAC and R primer - CACCCACAATCCCACCTC) and HOXD10 (F primer – TGGCTGAGGTCTCCGTGT and R primer – GACCTGCCTGTCGGTGAG) gene as described previously (12).
Statistical Analysis
All of the statistical analyses except those involving microarray data were performed using Prism software. Data are expressed as mean ± SEM (standard error of mean) following a student's t-test (two-tailed with unequal variance).
Results
Human lung cancer cell lines form metastatic lesion in the 4D lung cancer model
All cell lines (A549, H1299, and H460) formed a primary lung nodule in the left lobe of the ex vivo 4D lung cancer model starting on day 2. The nodule grew in size throughout the 25-day period (Fig 2A-I). By day 3, live circulating tumor cells (CTCs) were identified in the media and the number increased over time (Fig 2J). Starting on day 5, there were significantly more CTC produced daily in the 4D model seeded with H1299 compared to either the 4D model seeded with A549 or H460 (p<0.05, Fig 1J). In addition, the metastatic lesion showed the presence of CTCs in the vasculature (Fig 3K).
Figure 2. Primary tumor nodule formation, circulatory tumor cells (CTCs) and metastatic lesion.
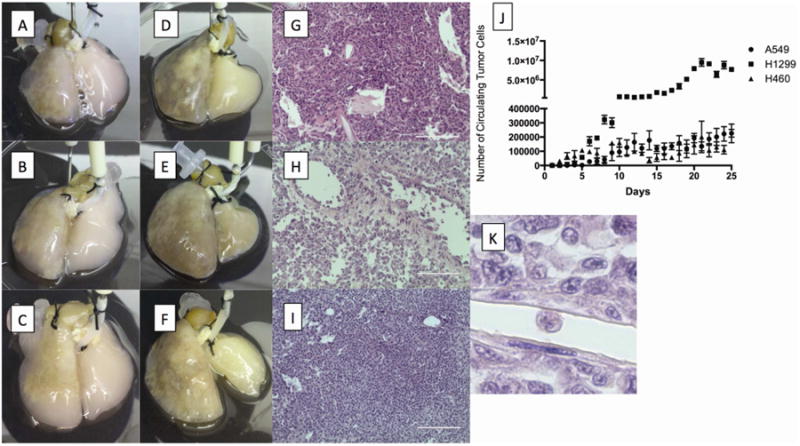
Primary tumor nodules formed on the left lung of the 4D model seeded with A549 (A), H1299 (B), or H460 (C) on day 5. The primary tumor grew in size on the left lung and metastatic lesion formed on the right lung on day 25 of the 4D model seeded with A549 (D), H1299 (E), and H460 (F) cells respectively. H&E staining of the primary tumor shows the different patterns of histopathology based on cell type (G, H & I). CTCs increased in number as the tumor nodule grew in the 4D model (J). The number of CTC was significantly higher in the 4D model seeded with H1299 cells than the A549 or H460 cells. CTCs can be seen in the vasculature on H&E staining of the primary tumor from the 4D model seeded with H1299 (K).
Figure 3. Metastatic tumor formation.
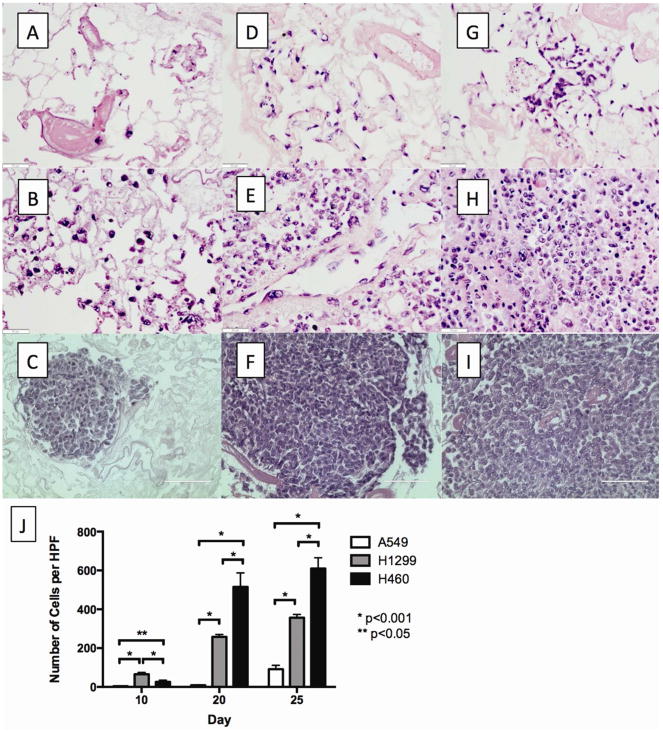
H&E staining of the metastatic lesion on day 10 (A), day 20 (D), and day 25 (G) of the 4D model seeded with A549; on day 10 (B), day 20 (E), and day 25 (H) of 4D model seeded with H1299; and on day 10 (C), day 20 (F), and day 25 (I) of the 4D model seeded with H460. There were a significantly higher number of metastatic lesions per high power field for H460 compared to H1299, which had a higher number of metastatic lesions per high power field compared to A549 (J).
The 4D model seeded with H460 (Fig 3G-I) had significantly more metastatic tumor cells per high power field in the right lung on day 20 and day 25 than the 4D model seeded with either A549 (Fig 3A-C) or H1299 (Fig 3D-F). The number of tumor cells per high power field in the metastatic lesions increased significantly over time for all cell lines (Fig 3G).
CTC gene signature has mesenchymal characteristics
We examined the gene expression profile of CTC from 4D model seeded with A549 and respective 2D cultured cells. Genome wide gene expression data showed 1,883 genes were differentially expressed (p<0.001, fold change>3, Fig. 4A) between A549 2D cultured cells and the CTC from the 4D model. The global gene expression differences between the CTC from the 4D model and the 2D model were widespread, far exceeding the chance expected (estimated FDR<5%). RT-PCR of IL-6 (p<0.0001), IL-11 (p<0.0001) and HOXD10 (p<0.0001) correlated with findings from the gene expression data. Gene ontology analysis of up-regulated genes in the CTC from the 4D model compared to the tumor cells grown in a 2D model showed up-regulation of mesenchymal cell proliferation and epithelial to mesenchymal transition while an analysis of down-regulated genes showed pathways involved in immune response and cell-matrix and cell-cell interaction (Table 1).
Figure 4. CTC signature predicts poor survival.
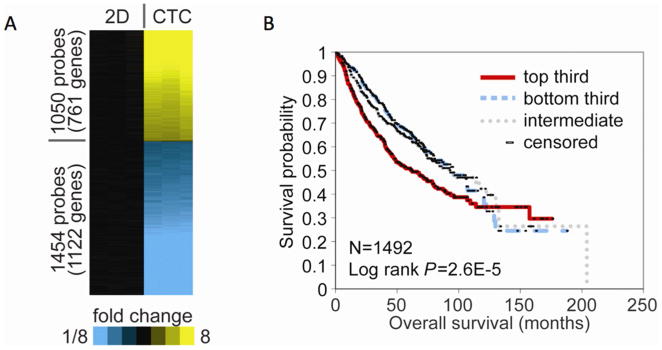
(A) Gene microarray analysis found 1,883 different gene expressions between A549 cells grown on a petri dish (2D) and CTC from the 4D model seeded with A549 cells (CTC). (B) The association of CTC (A549) gene signatures with lung cancer patient survival, using a compendium of public gene array datasets (n=1492 lung adenocarcinomas). The Kaplan-Meier plot compares the top third (“strong manifestation”), bottom third (“weak manifestation”), and middle third (“intermediate”). The CTC gene signature correlated with reduced survival (p=0.000026, log-rank test, evaluating differences among the three groups).
Table 1. Selected GO pathways for gene expression differences between CTC from the 4D model seeded with A549 and A549 cells grown on the 2D model.
| No of Genes Changed | P-value | |
|---|---|---|
| Up-regulated in CTC compared to 2D | ||
| Nervous system development | 30 | 0.0004 |
| Neural crest cell migration | 5 | 0.001 |
| Mesenchymal cell proliferation | 2 | 0.005 |
| Epithelial to mesenchymal transition | 3 | 0.03 |
| Down-regulated in CTC compared to 2D | ||
| Extracellular region | 170 | 1.16×10⁻¹¹ |
| Integral to membrane | 298 | 1.19×10⁻⁷ |
| Cell adhesion | 52 | 2.00×10⁻⁴ |
| Anchored to membrane | 15 | 2.00×10⁻³ |
| Tight junction | 11 | 3.00×10⁻³ |
| Complement activation, classical pathway | 11 | 1.58×10⁻⁷ |
| Innate immune response | 21 | 1.37×10⁻⁶ |
| Lipopolysaccharide receptor activity | 4 | 5.78×10⁻⁵ |
| Positive regulation of macrophage cytokine production | 3 | 2.00×10⁻⁴ |
| Positive regulation of interferon-alpha production | 3 | 2.00×10⁻⁴ |
CTC gene signature correlates with poor lung cancer patient survival
Among the four cell lines, A549 cells are derived from the primary adenocarcinoma from a lung cancer patient. In order to determine if the CTC gene signature from the 4D model had an impact in patient survival, we used this cell line to obtain the CTC from the 4D model gene expression profile to determine the correlation between this signature and the survival of lung adenocarcinoma patients. We collected 11 independent cohorts of lung adenocarcinoma patients for which both gene expression and clinical outcome data were publically available as previously described (12). These tumor profiles (n=1,492) were scored based on the manifestation of our CTC gene signature (consisting of 1,883 unique human genes). The CTC gene signatures were associated with reduced survival in lung cancer patients (p=2.6×10⁻⁵, log-rank test, Fig. 4B).
Unique CTC gene signature
By microarrays, we analyzed differential gene expression patterns of the primary tumor from the 4D model seeded with H1299 between day 2 and day 25, which showed a significant down-regulation of 622 genes and up-regulation of 865 genes (p<0.001, fold change>2, Fig 5A). GO analyses of these two time points show an increase in cell-cell and cell-matrix interaction and organ development (Table 2A). Moreover, the metastatic lesion from the 4D model seeded with H1299 had 1100 down-regulated genes and 592 up-regulated genes between day 10 and 25 (p<0.001, fold change>2, Fig 5A). GO analyses showed an increase in pathways involved in the growth and down-regulation of genes involved in immune regulation (Table 2B). Finally, CTCs had only 161 down-regulated genes and 216 up-regulated genes between day 10 and 25 (p<0.01, fold change>2, Fig 5A). The two time points for CTC from the 4D model seeded with H1299 had a smaller numbers of genes that were differentially expressed than the differentially expressed genes involved with the primary tumor and with the metastatic lesion. In terms of a unique gene signature associated with CTC formation, we found 59 gene probes (representing 43 unique genes) up-regulated and 20 gene probes (16 genes) down-regulated in the CTCs compared to the primary tumor and the metastatic lesion from the 4D model seeded with H1299 that also correlated with differential gene expression of the primary tumor and CTC from the 4D model seeded with A549 (Fig 5B and Table 3).
Figure 5. Differential gene signatures of the 4D lung cancer model seeded with H1299 in different contexts and at different time points and CTC profile.
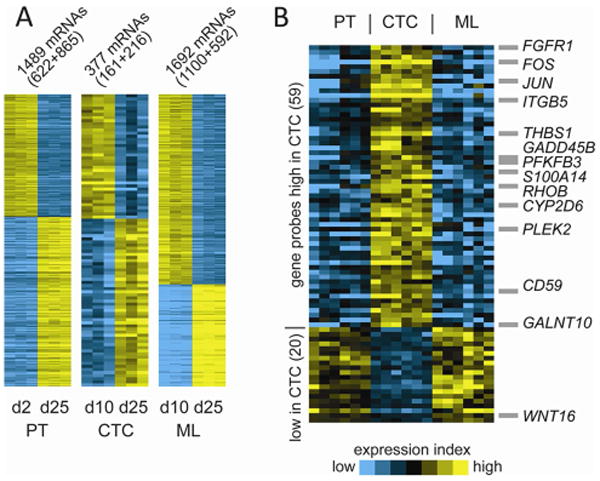
(A) Differentially expressed genes by time (days 2/10 versus day 25) for primary tumor (PT, p<0.001, fold>2), circulating tumor cells (CTC, p<0.01, fold>2), and metastatic lesion (ML, p<0.001, fold>2), all from 4D models seeded with H1299. Circulating tumor cells (CTC) had fewer differentially expressed genes, compared to the primary tumor (PT) and metastatic lesion (ML). (B) A unique group of genes associated with CTC was determined by evaluating all of the genes that were up-regulated or down-regulated at each time point (days 10 and 25) of the CTC profiles, compared to each time point of both the primary tumor and the metastatic lesion (p<0.05, each comparison).
Table 2. A. Selected GO pathways for gene expression differences between the primary tumor of the 4D model on day 2 and day 25.
| No of Genes Changed | P-value | |
|---|---|---|
| Up-regulated in Day 25 compared to Day 2 of Primary Tumor | ||
| Proteinaceous extracellular matrix | 35 | 6.24×10⁻¹³ |
| Cell adhesion | 55 | 5.09×10⁻¹² |
| Multicellular organismal development | 66 | 1.06×10⁻⁷ |
| Plasma membrane | 154 | 2.95×10⁻⁷ |
| Protein binding | 299 | 3.79×10⁻⁷ |
| Down-regulated in Day 25 compared to Day 2 of Primary Tumor | ||
| Cell cycle | 60 | 3.84×10⁻²⁴ |
| Nucleus | 231 | 9.24×10⁻²² |
| Cell division | 41 | 9.14×10⁻²¹ |
| DNA replication | 26 | 1.91×10⁻¹⁴ |
| DNA repair | 28 | 2.38×10⁻¹³ |
| B. Selected GO pathways for gene expression differences between the CTC of the 4D model on day 10 and day 25 | ||
|---|---|---|
| No of Genes Changed | P-value | |
| Up-regulated in Day 25 compared to Day 10 of CTC | ||
| Nuclear speck | 6 | 0.0009 |
| Cellular metal ion homeostasis | 2 | 0.0009 |
| RNA splicing | 9 | 0.0011 |
| Inner cell mass cell proliferation | 2 | 0.0014 |
| Response to organic nitrogen | 3 | 0.0031 |
| Down-regulated in Day 25 compared to Day 10 of CTC | ||
| Positive regulation of sodium:hydrogen antiporter activity | 2 | 4.47×10⁻⁵ |
| Regulation of mitosis | 3 | 8.03×10⁻⁵ |
| Nucleolus | 15 | 8.37×10⁻⁵ |
| C. Selected GO pathway for gene expression differences between the metastatic lesion of the 4D model on day 10 and day 25 | ||
|---|---|---|
| No of Genes Changed | P-value | |
| Up-regulated in Day 25 compared to Day 10 of Metastatic Lesion | ||
| Protein binding | 218 | 3.23×10⁻⁷ |
| Endoplasmic reticulum | 49 | 8.51×10⁻⁷ |
| Lysosome | 16 | 1.04×10⁻⁶ |
| Membrane | 139 | 2.10×10⁻⁶ |
| Translational elongation | 12 | 3.90×10⁻⁶ |
| Down-regulated in Day 25 compared to Day 10 of Metastatic Lesion | ||
| Negative regulation of interleukin-12 production | 4 | 5.26×10-05 |
| Positive regulation of cellular pH reduction | 3 | 0.0003 |
| Fusion of sperm to egg plasma membrane | 4 | 0.0004 |
| Regulation of interleukin-2 biosynthetic process | 2 | 0.0019 |
| Type III intermediate filament | 2 | 0.0019 |
Table 3. Common genes that are either up-regulated or down-regulated in gene expression of CTC compared to the primary tumor and metastatic lesion.
| Gene Symbol | |
|---|---|
| Up-regulated in CTC | CCDC62, CD59, CEP135, CGB|CGB8|CGB5|CGB7, CHST11, CLN8, CYP2D6|CYP2D7P1, EFR3B, F3, FAM101B, FGFR1, FLNC, FOS, GADD45B, FALNT10, GRK5, ITGB5, JUN, MICALL2, MSC, NRP2, PFKFB3, PIEZO1, PLEK2, RHOB, RNF125, RNFT2, S100A14, SNORD36C, SPG7, TAOK2, TG, THBS1, TMEM120B, TMEM51, TPM1, TPST1, TUFT1, VPS53, ZBTB24, ZC3H12A |
| Down-regulated in CTC | BNIP3, C17orf72, CHRNB4, DCDC2 FAM162A, GBE1, GUCY1A3, GYS1, JAK2, KRT35, RAD50, RMND1, RUNDC3A, TCAIM, TXN2, WNT16, ZNF28 |
Comment
Metastasis is a complex, multistep process, in which tumor cells must acquire the ability to invade the extracellular matrix, survive in circulation, migrate to a distant location and ultimately regain their original property to proliferate in a new microenvironment. To understand this process, we need a research model that can recapitulate all of these steps of tumor progression. Current in vitro (2D/3D) models do not show the inherent complexity of the metastatic cascade. Although these assays offer advantages over in vivo models by providing clues about the potential function of a given gene, protein, and/or pathway of interest, they remain surrogate assays of metastatic function as they lack the 3D architecture provided by the extracellular matrix (ECM) and the tumor microenvironment. Unlike 2D and 3D models, we have shown that our 4D model, so named for the additional dimension of “flow,” recapitulates the multiple steps of metastasis and leads to the isolation and characterization of cells in different phases of tumor progression.
In our 4D lung model, the primary tumor nodules form and grow over time. As tumor nodules formed, CTCs were found in the circulating media and ultimately metastatic lesions formed in the model. Tumor growth and the number of CTCs vary among the different cell lines (H1299, A549, H460) seeded on the 4D model likely due to their inherent genetic and phenotypic nature. Furthermore, our model shows the varying ability of these cell lines to form metastatic lesions. The A549 cell line had less ability to form metastatic lesions than H1299 and H460. Moreover, metastatic lesion formation has no relationship to the number of CTCs. The H1299 cells produced significantly more CTCs in the model, but H460 cells formed more metastatic lesions. This suggests that the model reflects the biology of the tumor cells rather than the simple relationship between the number of CTCs and metastatic lesion formation.
This “mobile” CTC property is also seen in the CTC from the 4D model gene expression profile. Our previous work showed that a gene ontology analysis of the A549 cells grown on the tissue of the model had characteristics of cells that were both mobile (mesenchymal characteristics) and fixed (epithelial characteristics) compared to the same cells grown on a petri dish (12). In the current study, the gene ontology analysis of the differential gene expression analysis of the CTC from the 4D model seeded with A549 compared to the same cells grown on a petri dish shows that the CTC of the 4D model up-regulate the mesenchymal differentiation or mobile characteristics and down-regulate the cell-matrix and cell-cell interaction or fixed characteristics, which demonstrates that these cells express genes that make them mobile in the circulation. CTC gene signature was associated with poor prognosis in lung cancer patients. This is likely due to the fact that patients with more subset of CTC-like cells in the primary tumor are more likely to form metastatic lesions, which ultimately leads to patient death. This phenomenon in our model is supported by the clinical data that shows presence of CTCs in cancer patients is a marker of poor prognosis (14, 15). Understanding the biology and characterization of CTCs is very important for the development of an effective therapeutic regimen for advanced lung cancer.
We further used our model to characterize the differential gene expression between the early- and late-stage primary tumor, CTCs, and metastatic lesions, which showed a wide variation of up-regulated and down-regulated genes in primary tumors and metastatic tumors as compared to CTCs. This shows that there is significantly less variability of the tumor cell in the CTC phase than the primary tumor and metastatic lesion. The CTC in the 4D model does not vary in its gene expression in its relationship to time. A significant number of genes that are altered in the CTC compared to the primary tumor and metastatic lesion in H1299 and A549. This profile may provide a clue for a potential mechanism for CTC formation.
Overall, the 4D lung cancer model mimics the biology of lung cancer metastasis and the model can be used to isolate tumor cells in three phases of tumor progression. All three human lung cancer cell lines formed a primary tumor, CTCs, and metastatic lesions. The model provides an efficient system to study the entire metastatic process from the primary tumor to metastatic lesion formation. This model cannot entirely replace the in vivo model for metastasis due to the lack of other cellular components of the tumor microenvironment, but it has the advantage of allowing us to test different types of tumor cells regardless of genetic background and to assess metastasis in an abbreviated time frame in a laboratory setting. Our 4D lung cancer model should facilitate a better understanding of the fundamental mechanisms underlying lung cancer metastasis and may lead to important therapeutic advances.
Supplementary Material
Acknowledgments
MPK received grant support from the Second John W. Kirklin Research Scholarship, American Association for Thoracic Surgery Graham Research Foundation. MPK received funding from the Houston Methodist Foundation with a donation from J. Michael Jusbasche. MPK has applied for a patent on 4D model. CJC, YZ and FC were supported in part by NIH grant P30 CA125123 and CPRIT grant RP120713. We thank Ann Saikin for editing the language of the manuscript.
Footnotes
Meeting Presentation: STSA 2014
Publisher's Disclaimer: This is a PDF file of an unedited manuscript that has been accepted for publication. As a service to our customers we are providing this early version of the manuscript. The manuscript will undergo copyediting, typesetting, and review of the resulting proof before it is published in its final citable form. Please note that during the production process errors may be discovered which could affect the content, and all legal disclaimers that apply to the journal pertain.
References
- 1.Siegel R, Naishadham D, Jemal A. Cancer statistics, 2013. CA Cancer J Clin. 2013;63(1):11–30. doi: 10.3322/caac.21166. [DOI] [PubMed] [Google Scholar]
- 2.McClatchey AI. Modeling metastasis in the mouse. Oncogene. 1999;18(38):5334–5339. doi: 10.1038/sj.onc.1203086. [DOI] [PubMed] [Google Scholar]
- 3.Jansen AP, Verwiebe EG, Dreckschmidt NE, Wheeler DL, Oberley TD, Verma AK. Protein kinase c-epsilon transgenic mice: A unique model for metastatic squamous cell carcinoma. Cancer research. 2001;61(3):808–812. [PubMed] [Google Scholar]
- 4.Yang S, Zhang JJ, Huang XY. Mouse models for tumor metastasis. Methods in molecular biology. 2012;928:221–228. doi: 10.1007/978-1-62703-008-3_17. [DOI] [PMC free article] [PubMed] [Google Scholar]
- 5.Yamaura T, Doki Y, Murakami K, Saiki I. Model for mediastinal lymph node metastasis produced by orthotopic intrapulmonary implantation of lung cancer cells in mice. Hum Cell. 1999;12(4):197–204. [PubMed] [Google Scholar]
- 6.Harris JE, Jr, Shin J, Lee B, et al. A murine xenograft model of spontaneous metastases of human lung adenocarcinoma. J Surg Res. 2011;171(1):e75–79. doi: 10.1016/j.jss.2011.06.058. [DOI] [PMC free article] [PubMed] [Google Scholar]
- 7.Cespedes MV, Casanova I, Parreno M, Mangues R. Mouse models in oncogenesis and cancer therapy. Clin Transl Oncol. 2006;8(5):318–329. doi: 10.1007/s12094-006-0177-7. [DOI] [PubMed] [Google Scholar]
- 8.Farace F, Massard C, Vimond N, et al. A direct comparison of cellsearch and iset for circulating tumour-cell detection in patients with metastatic carcinomas. Br J Cancer. 2011;105(6):847–853. doi: 10.1038/bjc.2011.294. [DOI] [PMC free article] [PubMed] [Google Scholar]
- 9.Tsai JH, Donaher JL, Murphy DA, Chau S, Yang J. Spatiotemporal regulation of epithelial-mesenchymal transition is essential for squamous cell carcinoma metastasis. Cancer Cell. 2012;22(6):725–736. doi: 10.1016/j.ccr.2012.09.022. [DOI] [PMC free article] [PubMed] [Google Scholar]
- 10.Mishra DK, Thrall MJ, Baird BN, et al. Human lung cancer cells grown on acellular rat lung matrix create perfusable tumor nodules. Ann Thorac Surg. 2012;93(4):1075–1081. doi: 10.1016/j.athoracsur.2012.01.011. [DOI] [PMC free article] [PubMed] [Google Scholar]
- 11.Mishra DK, Sakamoto JH, Thrall MJ, et al. Human lung cancer cells grown in an ex vivo 3d lung model produce matrix metalloproteinases not produced in 2d culture. PLoS One. 2012;7(9):e45308. doi: 10.1371/journal.pone.0045308. [DOI] [PMC free article] [PubMed] [Google Scholar]
- 12.Mishra DK, Creighton CJ, Zhang Y, Gibbons DL, Kurie JM, Kim MP. Gene expression profile of a549 cells from tissue of 4d model predicts poor prognosis in lung cancer patients. International journal of cancer Journal international du cancer. 2014;134(4):789–798. doi: 10.1002/ijc.28428. [DOI] [PMC free article] [PubMed] [Google Scholar]
- 13.Creighton CJ, Nagaraja AK, Hanash SM, Matzuk MM, Gunaratne PH. A bioinformatics tool for linking gene expression profiling results with public databases of microrna target predictions. Rna. 2008;14(11):2290–2296. doi: 10.1261/rna.1188208. [DOI] [PMC free article] [PubMed] [Google Scholar]
- 14.Franken B, de Groot MR, Mastboom WJ, et al. Circulating tumor cells, disease recurrence and survival in newly diagnosed breast cancer. Breast cancer research: BCR. 2012;14(5):R133. doi: 10.1186/bcr3333. [DOI] [PMC free article] [PubMed] [Google Scholar]
- 15.Zhang L, Riethdorf S, Wu G, et al. Meta-analysis of the prognostic value of circulating tumor cells in breast cancer. Clinical cancer research: an official journal of the American Association for Cancer Research. 2012;18(20):5701–5710. doi: 10.1158/1078-0432.CCR-12-1587. [DOI] [PubMed] [Google Scholar]
Associated Data
This section collects any data citations, data availability statements, or supplementary materials included in this article.