

Abstract
Studies in adults indicate that white matter microstructure, assessed with diffusion tensor imaging (DTI), has high heritability. Little is known about genetic and environmental influences on DTI parameters, measured along fiber tracts particularly, in early childhood. In the present study, we report comprehensive heritability data of white matter microstructure fractional anisotropy (FA), radial diffusion (RD), and axial diffusion (AD) along 47 fiber tracts using the quantitative tractography in a large sample of neonatal twins (n=356). We found significant genetic influences in almost all tracts with similar heritabilities for FA, RD, and AD as well as positive relationships between these parameters and heritability. In a single tract analysis, genetic influences along the length of the tract were highly variable. These findings suggest that at birth, there is marked heterogeneity of genetic influences of white matter microstructure within white matter tracts. This study provides a basis for future studies of developmental changes in genetic and environmental influences during early childhood, a period of rapid development that likely plays a major role in individual differences in white matter structure and function.
Keywords: Genetics, Diffusion Tensor Imaging (DTI), Quantitative tractography, Fractional anisotropy, radial diffusivity, axial diffusivity
1. Introduction
Recent diffusion tensor imaging (DTI) studies have found abnormalities of white matter microstructure in neuropsychiatric disorders such as schizophrenia, bipolar disorder, autism spectrum disorder, and attention-deficit/hyperactivity disorder (Dennis and Thompson, 2013; Kuswanto et al., 2012; Mueller et al., 2012; Nortje et al., 2013). It is becoming clear that most of these neurodevelopmental and psychiatric disorders are the result of abnormal trajectories of prenatal and early childhood brain development (Bale et al., 2010; Insel, 2010; NIMH Workgroup, 2008). The abnormal developmental trajectories that underlie these disorders are likely contributed to by the additive and interactive effects of multiple genetic and environmental factors, each with small individual effects.
Early childhood is a period of very rapid development of the basic structural and functional framework of the brain, including global tissue volumes (Knickmeyer et al., 2011), cortical thickness and surface area (Lyall et al., 2014), white matter tract microstructure (Dubois et al., 2006, 2008; Gao et al., 2009a; Geng et al., 2012a; Gilmore et al., 2007) and resting state functional networks (Gao et al., 2009b, 2011, 2013; Lin et al., 2008). During the first 2 years of life in particular, DTI studies show that white matter exhibits significantly increasing fractional anisotropy (FA) and decreasing radial diffusivity (RD) and axial diffusivity (AD), with rates of change faster in the first year than the second (Dubois et al., 2006, 2008; Gao et al., 2009a; Geng et al., 2012a). Very little is known about how genetic and environmental factors influence white matter development during this period, one that will likely determine individual differences in cognition and behavior, as well risk for psychiatric disease.
Twin DTI studies in adults have reported high heritability of regional FA in the splenium and genu corpus callosum (Pfefferbaum et al., 2001), and of lobar FA in bilateral frontal, parietal, and left occipital lobes (Chiang et al., 2009). Whole brain white matter FA and RD were found to have significant genetic variability, with heritability values of .52 and .37 respectively, while genetic variation in AD was non-significant (Kochunov et al., 2010). A recent multi-site study found additive genetic factors explaining over 50% of inter-subject variance in FA values across multiple white matter regions (Kochunov et al., 2014). Studies in older children indicate that the heritability of FA decreases significantly from adolescence (70–80%) to adulthood (30–40%) (Chiang et al., 2011b), while studies of 9 year olds find no significant heritability of FA with little change between 9 and 12 years (Brouwer et al., 2010; Brouwer et al., 2012). In neonates, we found rather high heritability of FA in neonates, compared to the study of 9 year olds (Brouwer et al., 2010), that tended to decrease with tract maturation (Geng et al., 2012b).
Studies to date suggest that heritability of white matter microstructure changes with development. Twin studies of white matter in childhood will allow a better understanding of when specific structures and circuits are more or less amendable to environmental and experimental influence, identifying periods of heightened plasticity that can be targeted by early environmental interventions to reduce risk and improve long term developmental outcomes. These studies also provide temporal and regional targets with high genetic influence for future genetic studies of development in early childhood, allowing the field to gain traction in the face of the enormous genetic complexity of psychiatric disorders. It has been proposed that structural endophenotypes used in genetics studies be highly heritable (Glahn et al., 2012; Medland et al., 2014). Blokland et al. (2012) concluded in a meta-analysis that twin studies are “the first step to determine whether it is worthwhile to perform gene finding analyses on a given imaging phenotype.”
Irrespective of the scarcity of heritability studies in early childhood, previous studies only provide us limited information by reporting only one diffusion parameter (Chiang et al., 2009; Pfefferbaum et al., 2001), global diffusion measurements (Gilmore et al., 2010; Kochunov et al., 2010), or measurements in several discrete sites along fiber pathways (Geng et al., 2012b). In the current work, we have extended our previous region-of-interest (ROI) based analysis in neonates to a quantitative tract-based analysis in a large sample, in which anatomically informed curvilinear regions are used to analyze diffusion at specific locations all along fiber (Goodlett et al., 2009; Verde et al., 2014). Using this quantitative tractography, we report a comprehensive heritability data of white matter DTI measures along 12 bilateral fiber pathways and the respective subdivision in the largest sample of pediatric twin subjects to date (n=365).
2. Materials and methods
2.1. Participants
Pregnant women with twin fetuses were recruited from the outpatient OB-GYN clinics as part of the UNC Early Brain Development Studies (www.earlybrainresearch.org) between 2004 and 2014. Exclusion criteria for mothers included major maternal illness or infection during pregnancy, and maternal diagnosis of a major psychiatric disorder; those for neonates were chromosomal abnormalities, severe congenital abnormalities, major medical illness or infection, abnormalities on MRI other than small intracranial hemorrhages which are common in neonates (Looney et al., 2007). Zygosity was determined with polymerase chain reaction-short tandem repeat (PCR-STR) analysis of 14 loci on DNA prepared from buccal swab cell collection (BRT Laboratories, Baltimore, MD). Written informed consent was obtained from a parent of all infant participants. This study was approved by the Institutional Review Boards of the University of North Carolina School of Medicine and Duke University Medical Center.
A total of 356 of twin neonates were included in the final analysis: 129 twin pairs and 98 unrelated “singleton” twins – a single unpaired twin subject in which a usable scan was not obtained from the co-twin. Demographic variables are presented in Table 1. Data from these participants has been published previously in a ROI-based study of heritability (Geng et al., 2012b).
Table 1.
Demographic characteristics
| MZ twins | DZ twins | Single twin | Total | |
|---|---|---|---|---|
| Number of subject | 96 | 162 | 98 | 356 |
| Biological sex | ||||
| Male (%) | 40 (41.7) | 91 (55.5) | 59 (60.2) | 190 (53.4) |
| Female (%) | 56 (58.3) | 73 (44.5) | 39 (39.8) | 166 (46.6) |
| Birth weighta (g) | 2202.6 (562.3) | 2407.7 (491.1) | 2434.3 (551.7) | 2361.4 (534.7) |
| Gestational age at birthb (week) | 35 [32,36] | 36 [35,37] | 36 [35,37] | 36 [34,37] |
| Postmenstrual age at MRIb (week) | 40 [39,42] | 41 [39,42] | 41 [40,42] | 41 [39,42] |
| NICU admission | ||||
| Number of subject (%) | 43 (44.8) | 45 (27.8) | 28 (28.6) | 116 (32.6) |
| Days of admission b (%) | 8.2 (13.8) | 3.6 (8.1) | 4.6 (10.3) | 5.2 (10.7) |
| Intubation (%) | 8 (8.3) | 8 (4.9) | 5 (5.1) | 21 (5.9) |
| Scanner type | ||||
| Allegra (%) | 90 (93.8) | 136 (84.0) | 78 (79.6) | 304 (85.4) |
| Trio (%) | 6 (6.3) | 26 (16.0) | 20 (20.4) | 52 (14.6) |
| Diffusion gradient directions | ||||
| 6 (%) | 66 (68.8) | 62 (38.3) | 42 (42.9) | 170 (47.8) |
| 42 (%) | 31 (31.3) | 100 (61.7) | 56 (57.1) | 186 (52.2) |
| Ethnicity | ||||
| Caucasian (%) | 70 (72.9) | 118 (72.8) | 77 (78.6) | 264 (74.2) |
| African American (%) | 22 (22.9) | 44 (27.2) | 18 (18.4) | 85 (23.9) |
| Other (%) | 4 (4.2) | 0 (0) | 3 (3.2) | 7 (2.0) |
represent means and standard deviations.
represent median ages with interquartile ranges.
NICU, neonatal intensive care unit
2.2. Image acquisition
Most (N = 304, 85%) of MRI were acquired on a 3T Siemens Allegra head only scanner (Siemens Medical System, Erlangen, Germany). For the 170 (56%) subjects scanned with the Allegra model, diffusion weighted images (DWIs) were acquired using a single shot echo-planar imaging (EPI) spin-echo sequence with the following parameters: Time to Repeat [TR]/Time to Echo [TE] = 5200/73 ms, slice thickness = 2 mm, in-plane resolution = 2 × 2 mm2, and 45 slices. For each EPI sequence, a total of 6 diffusion weighted images with a b value = 1000 s/mm2 and one reference image without diffusion sensitization (b value = 0) were acquired. The diffusion gradients were applied in six non-collinear directions, (1,0,1), (−1,0,1), (0,1,1), (0,1,−1), (1,1,0), and (−1,1,0) for each sequence, with each sequence repeated 5 times for a total 35 diffusion weighted images per scan session to improve signal-to-noise. For the other 134 (44%) subjects scanned on the Allegra, DWIs were acquired with the following parameters: TR/TE/Flip angle = 7680/82/90°, acquisition matrix = 128 × 96, voxel resolution = 2 × 2 × 2 mm3, field of view [FOV] = 256 × 192 mm2, 42 non-collinear diffusion gradients with 7 b = 0 scans (60 axial slices), and diffusion weighting b = 1000 s/mm2.
The remaining 52 (15%) were scanned on a new 3T Siemens Tim Trio scanner (Siemens Medical System, Erlangen, Germany). DWIs were acquired with acquisition protocol similar to the second Allegra DWI protocol: TR/TE = 7200/83 ms, acquisition matrix = 128 × 96, voxel resolution = 2 × 2 × 2 mm3, FOV = 256 × 192, 42 non-collinear diffusion gradients, with 7 b = 0 scans (62 axial slices), and diffusion weighting b = 1000 s/mm2.
2.3. Diffusion tensor imaging analysis
A study specific quality control protocol was performed for all raw diffusion-weighted images (DWI) using DTIPrep (http://www.nitrc.org/projects/dtiprep) for slice-wise and gradient-wise artifact detection, as well as eddy current and motion correction (Oguz et al., 2014). Removal of the skull and other non-brain tissue was performed using FSL’s Brain Extraction Tool (Smith, 2002) to generate a binary brain mask from the baseline image (average of all b = 0 images) for use in limiting tensor field estimation to only brain tissue included within the mask. The tensors were estimated from the DWI with the binary brain mask applied by using the weighted least squares fitting method (DTIEstim, Goodlett et al., 2009). For further visual quality control, the diffusion scalar properties were extracted out of the skull-stripped tensor volumes to obtain FA, AD, and RD maps (DTIProcess ToolKit, http://www.slicer.org). Our adaptation of the UNC-Utah NA-MIC DTI framework (Verde et al., 2014) included creation of an unbiased, cross-sectional, study-specific neonate DTI atlas for application of a fiber tract based analysis to the present study of neonatal brain development (http://www.nitrc.org/projects/dtiatlasbuilder). All fiber tract segments were reconstructed in the neonate atlas space using a streamline tractography algorithm (www.slicer.org; Fedorov et al., 2012), as shown in greater detail in Appendix A. Via the deformation field computed in pair-wise registration of the DTI atlas with our study subject DTI data, we mapped atlas fiber tracts into each subject’s original DTI space, where all diffusion properties were sampled along the tracts (DTI-Reg, DTIAtlasFiberAnalyzer, https://www.slicer.org). We then generated statistical profiles for each of three diffusion property parameters (FA, AD, RD) along the length of each fiber tract for every individual subject in the present study. After statistical analyses were performed, we merged the statistical findings with the atlas fiber bundles to visualize our results with reference to anatomy (MergeStatWithFiber, https://www.slicer.org). These steps are described in greater detail in Appendix A.
2.4. Genetic analysis of twins
We fitted a novel functional ACE model that can accommodate both twin pairs and unrelated “singleton” twins, to diffusion parameters along each fiber tract. This functional ACE (fACE) model is a novel extension of our FADTTS toolbox available at http://www.nitrc.org/projects/fadtts/ (Zhu et al., 2011; Yuan et al., 2014). Specifically, in the fACE model, we introduced A (additive genetics), C (common environment), and E (unique environment) functions as random functions of fiber location. Moreover, we included varying coefficients associated with five covariates including biological sex, gestational age at birth, postmenstrual age at scan, scanner type, and gradient direction. Our fACE model explicitly models differing genetic makeups for MZ twins, sharing nearly 100% of their genes, and dizygotic (DZ) twins sharing only about 50% of their genes. To quantify the genetic and environmental contributions, we estimated all ACE functions varying coefficient functions and then used local and global test statistics to test the heritability and any varying coefficient along each tract.
2.5. Statistical analysis
Genetic analysis for twins, in the end, generated additive genetic (a2), shared environmental (c2), and unique environmental (e2) contribution estimates of DTI parameters at every data point along the length of the tract that was analyzed. To make single representative estimates for each tract as a whole, we averaged all of the FA, AD, and RD values along a given fiber segment and generated estimates of tract-averaged DTI parameters using the same genetic analysis.
For demographic variables, frequency distributions were calculated for categorical variables, and the means and standard deviations were calculated for continuous variables. Nonparametric Spearman’s correlations were used when studying the associations between DTI parameters and their heritability for individual tract because heritability estimates in this study did not met the assumption of normal distribution. For analysis of all points in all tracts, the zero-inflated Poisson (ZIP) model based on the discretized heritability values and the DTI parameters values was carried out, since the cumulative number of data points with zero heritability is considerable (N = 525 (11%) for FA, 2,555 (56%) for AD, 1,178 (26%) for RD). Heritability values in [0,1] were uniformly discretized into 20 groups with larger values corresponding to larger integers (N = 1 to 20), with the zero values remaining zero. The ZIP model estimates two equations that correspond to two zero generating processes. The Poisson part is governed by a Poisson distribution that generates counts, some of which may be zero and the binomial part is governed by a binary distribution that generates structural zeros. The log link is used for Poisson part and the logit link is used for binomial part (the probability of a2 = 0).
R2 statistics were calculated to explore the contribution of biological sex, gestational age, postmenstrual age, scanner type, and gradient direction on DTI parameter variability. Three sample fibers were selected; the genu and the splenium with higher heritability and the right cingulate bundle of the cinglum with lower heritability in FA.
All the data were analyzed using SPSS for Windows, version 20.0 (SPSS, Inc.; Chicago, IL, USA), R and in-house programs written in Matlab. Differences were considered statistically significant at p <.05.
3. Results
3.1. Heritability of the tract-averaged values of DTI parameters for individual tracts
Table 2 presents heritability estimates for tract-averaged FA, AD, and RD. In general, almost all tracts showed significant heritability, and mean ± SD heritability across all tracts were similar for FA (0.33 ± 0.10), AD (0.32 ± 0.14), and RD (0.30 ± 0.09). FA showed no significant common environmental variance in any tract while for AD and RD, estimates were significant in 9 and 4 tracts respectively. However, the common environmental portions of variance were still low, from 0.11 to 0.24, even in those significant tracts.
Table 2.
Genetic and common environmental contribution estimates of the tract-averaged value of DTI parameter for individual tract.
| FA
|
AD
|
RD
|
|||||||||||||||||||
|---|---|---|---|---|---|---|---|---|---|---|---|---|---|---|---|---|---|---|---|---|---|
| Value
|
Correlation
|
Heritability
|
Value
|
Correlation
|
Heritability
|
Value
|
Correlation
|
Heritability
|
|||||||||||||
| Mean(SD) | rMZ | rDZ | a2 | p of a2 | c2 | p of c2 | Mean(SD)* | rMZ | rDZ | a2 | p of a2 | c2 | p of c2 | Mean(SD)* | rMZ | rDZ | a2 | p of a2 | c2 | p of c2 | |
| Corpus callosum | |||||||||||||||||||||
| rostrum, orbitofrontal | 0.24(0.03) | 0.95 | 0.93 | 0.26 | .002 | 0.03 | .362 | 1.79(0.08) | 0.79 | 0.73 | 0.54 | <.001 | 0.00 | .500 | 1.24(0.11) | 0.90 | 0.82 | 0.37 | <.001 | 0.00 | .500 |
| genu, prefrontal | 0.24(0.03) | 0.98 | 0.97 | 0.25 | <.001 | 0.09 | .122 | 1.82(0.08) | 0.90 | 0.88 | 0.46 | <.001 | 0.01 | .461 | 1.25(0.11) | 0.93 | 0.89 | 0.30 | <.001 | 0.08 | .165 |
| body, premotor | 0.22(0.03) | 0.95 | 0.91 | 0.45 | <.001 | 0.00 | .500 | 1.74(0.08) | 0.86 | 0.74 | 0.53 | <.001 | 0.00 | .500 | 1.26(0.10) | 0.91 | 0.67 | 0.46 | <.001 | 0.02 | .431 |
| body, motor | 0.23(0.03) | 0.90 | 0.83 | 0.44 | <.001 | 0.00 | .500 | 1.64(0.08) | 0.82 | 0.73 | 0.44 | <.001 | 0.00 | .500 | 1.17(0.09) | 0.86 | 0.72 | 0.41 | <.001 | 0.00 | .500 |
| body, parietal | 0.18(0.02) | 0.91 | 0.88 | 0.33 | <.001 | 0.02 | .420 | 1.69(0.08) | 0.86 | 0.77 | 0.49 | <.001 | 0.00 | .500 | 1.27(0.10) | 0.91 | 0.81 | 0.39 | <.001 | 0.00 | .500 |
| splenium, occipital | 0.27(0.03) | 0.96 | 0.94 | 0.52 | <.001 | 0.03 | .404 | 1.76(0.08) | 0.86 | 0.81 | 0.34 | .009 | 0.00 | .500 | 1.16(0.09) | 0.89 | 0.82 | 0.38 | <.001 | 0.00 | .500 |
| tapetum, temporal | 0.23(0.02) | 0.93 | 0.90 | 0.38 | <.001 | 0.00 | .500 | 1.82(0.09) | 0.84 | 0.75 | 0.47 | .012 | 0.09 | .299 | 1.29(0.09) | 0.88 | 0.80 | 0.42 | .009 | 0.06 | .353 |
| Corticothalamic tract | |||||||||||||||||||||
| prefrontal, left | 0.18(0.02) | 0.96 | 0.93 | 0.26 | <.001 | 0.00 | .500 | 1.52(0.07) | 0.95 | 0.92 | 0.28 | .003 | 0.09 | .164 | 1.17(0.09) | 0.96 | 0.94 | 0.32 | <.001 | 0.00 | .500 |
| prefrontal, right | 0.18(0.02) | 0.96 | 0.93 | 0.24 | .001 | 0.00 | .500 | 1.53(0.08) | 0.94 | 0.91 | 0.32 | <.001 | 0.11 | .103 | 1.17(0.09) | 0.96 | 0.93 | 0.29 | <.001 | 0.06 | .191 |
| premotor, left | 0.25(0.02) | 0.97 | 0.95 | 0.31 | <.001 | 0.00 | .500 | 1.52(0.06) | 0.94 | 0.92 | 0.39 | <.001 | 0.02 | .437 | 1.05(0.07) | 0.97 | 0.95 | 0.32 | <.001 | 0.04 | .273 |
| premotor, right | 0.26(0.02) | 0.98 | 0.96 | 0.28 | .002 | 0.01 | .451 | 1.53(0.06) | 0.95 | 0.92 | 0.41 | <.001 | 0.05 | .342 | 1.05(0.08) | 0.98 | 0.95 | 0.31 | <.001 | 0.07 | .175 |
| motor, left | 0.25(0.02) | 0.97 | 0.96 | 0.34 | <.001 | 0.00 | .500 | 1.44(0.06) | 0.95 | 0.90 | 0.37 | .001 | 0.00 | .500 | 0.99(0.07) | 0.96 | 0.93 | 0.33 | <.001 | 0.04 | .300 |
| motor, right | 0.23(0.02) | 0.96 | 0.94 | 0.36 | <.001 | 0.00 | .500 | 1.41(0.06) | 0.93 | 0.89 | 0.41 | <.001 | 0.05 | .323 | 1.00(0.07) | 0.95 | 0.90 | 0.33 | <.001 | 0.06 | .218 |
| parietal, left | 0.25(0.02) | 0.97 | 0.95 | 0.33 | <.001 | 0.00 | .500 | 1.43(0.06) | 0.95 | 0.91 | 0.20 | .031 | 0.17 | .044 | 0.98(0.07) | 0.97 | 0.94 | 0.24 | <.001 | 0.11 | .055 |
| parietal, right | 0.23(0.02) | 0.94 | 0.89 | 0.39 | <.001 | 0.00 | .500 | 1.41(0.06) | 0.95 | 0.90 | 0.38 | <.001 | 0.08 | .228 | 0.99(0.08) | 0.97 | 0.91 | 0.33 | <.001 | 0.05 | .250 |
| Corticofugal tract | |||||||||||||||||||||
| prefrontal, left | 0.20(0.02) | 0.95 | 0.92 | 0.24 | .002 | 0.00 | .500 | 1.49(0.05) | 0.92 | 0.90 | 0.15 | .083 | 0.18 | .027 | 1.10(0.07) | 0.97 | 0.95 | 0.28 | <.001 | 0.02 | .358 |
| prefrontal, right | 0.20(0.02) | 0.94 | 0.92 | 0.24 | .009 | 0.00 | .492 | 1.52(0.06) | 0.88 | 0.85 | 0.15 | .111 | 0.19 | .033 | 1.13(0.07) | 0.95 | 0.93 | 0.22 | .001 | 0.09 | .086 |
| premotor, left | 0.25(0.02) | 0.97 | 0.96 | 0.28 | .001 | 0.00 | .500 | 1.49(0.05) | 0.93 | 0.91 | 0.32 | .003 | 0.10 | .190 | 1.02(0.06) | 0.97 | 0.94 | 0.28 | <.001 | 0.06 | .190 |
| premotor, right | 0.23(0.02) | 0.95 | 0.93 | 0.28 | .001 | 0.00 | .500 | 1.47(0.06) | 0.92 | 0.89 | 0.46 | <.001 | 0.01 | .477 | 1.04(0.07) | 0.96 | 0.94 | 0.30 | <.001 | 0.05 | .251 |
| motor, left | 0.28(0.02) | 0.97 | 0.95 | 0.34 | .002 | 0.00 | .495 | 1.49(0.05) | 0.90 | 0.86 | 0.46 | <.001 | 0.00 | .500 | 0.95(0.06) | 0.94 | 0.90 | 0.27 | .001 | 0.06 | .235 |
| motor, right | 0.27(0.02) | 0.97 | 0.95 | 0.37 | <.001 | 0.00 | .500 | 1.48(0.05) | 0.90 | 0.86 | 0.39 | <.001 | 0.00 | .500 | 0.97(0.06) | 0.93 | 0.90 | 0.30 | <.001 | 0.05 | .238 |
| parietal, left | 0.25(0.02) | 0.96 | 0.95 | 0.25 | .007 | 0.02 | .387 | 1.59(0.06) | 0.87 | 0.83 | 0.38 | .015 | 0.00 | .500 | 1.09(0.07) | 0.94 | 0.92 | 0.31 | <.001 | 0.01 | .465 |
| parietal, right | 0.26(0.02) | 0.97 | 0.95 | 0.24 | .018 | 0.03 | .375 | 1.59(0.06) | 0.89 | 0.84 | 0.47 | <.001 | 0.00 | .500 | 1.06(0.07) | 0.94 | 0.91 | 0.28 | .005 | 0.02 | .401 |
| Medial lemniscal pathway | |||||||||||||||||||||
| left | 0.19(0.02) | 0.90 | 0.89 | 0.34 | .055 | 0.00 | .500 | 1.46(0.07) | 0.81 | 0.79 | 0.36 | .029 | 0.00 | .500 | 1.10(0.05) | 0.91 | 0.90 | 0.36 | .021 | 0.00 | .500 |
| right | 0.17(0.02) | 0.84 | 0.85 | 0.32 | .092 | 0.02 | .464 | 1.58(0.10) | 0.75 | 0.72 | 0.31 | .165 | 0.01 | .478 | 1.22(0.08) | 0.85 | 0.84 | 0.13 | .336 | 0.22 | .163 |
| Cingulum | |||||||||||||||||||||
| cingulate gyrus, left | 0.18(0.02) | 0.80 | 0.75 | 0.32 | .033 | 0.02 | .431 | 1.58(0.09) | 0.60 | 0.42 | 0.33 | .001 | 0.00 | .500 | 1.20(0.08) | 0.76 | 0.65 | 0.32 | <.001 | 0.00 | .500 |
| cingulate gyrus, right | 0.17(0.02) | 0.73 | 0.69 | 0.15 | .251 | 0.15 | .158 | 1.56(0.09) | 0.55 | 0.37 | 0.36 | .018 | 0.00 | .500 | 1.21(0.08) | 0.75 | 0.60 | 0.31 | .001 | 0.01 | .457 |
| hippocampal, left | 0.17(0.02) | 0.71 | 0.65 | 0.28 | .064 | 0.18 | .099 | 1.51(0.06) | 0.72 | 0.67 | 0.00 | .500 | 0.24 | <.001 | 1.15(0.06) | 0.80 | 0.76 | 0.14 | .046 | 0.12 | .053 |
| hippocampal, right | 0.17(0.02) | 0.78 | 0.69 | 0.57 | .001 | 0.00 | .493 | 1.49(0.06) | 0.63 | 0.56 | 0.00 | .500 | 0.19 | .047 | 1.15(0.06) | 0.69 | 0.63 | 0.09 | .246 | 0.15 | .068 |
| Fornix | |||||||||||||||||||||
| left | 0.23(0.02) | 0.91 | 0.88 | 0.43 | .005 | 0.00 | .500 | 1.82(0.09) | 0.81 | 0.69 | 0.49 | .015 | 0.02 | .466 | 1.28(0.09) | 0.84 | 0.75 | 0.26 | .099 | 0.20 | .130 |
| right | 0.22(0.02) | 0.87 | 0.76 | 0.62 | <.001 | 0.00 | .500 | 2.00(0.13) | 0.87 | 0.74 | 0.61 | .001 | 0.00 | .500 | 1.42(0.12) | 0.88 | 0.71 | 0.64 | <.001 | 0.00 | .500 |
| Arcuate fasciculus | |||||||||||||||||||||
| fronto-parietal, left | 0.16(0.02) | 0.80 | 0.71 | 0.42 | <.001 | 0.00 | .500 | 1.60(0.09) | 0.76 | 0.70 | 0.30 | .006 | 0.08 | .230 | 1.27(0.11) | 0.86 | 0.77 | 0.29 | <.001 | 0.12 | .083 |
| fronto-parietal, right | 0.16(0.03) | 0.80 | 0.67 | 0.42 | <.001 | 0.00 | .500 | 1.63(0.09) | 0.86 | 0.73 | 0.50 | <.001 | 0.00 | .500 | 1.29(0.11) | 0.91 | 0.81 | 0.38 | <.001 | 0.08 | .172 |
| fronto-temporal, left | 0.16(0.02) | 0.84 | 0.82 | 0.27 | .009 | 0.12 | .148 | 1.59(0.09) | 0.77 | 0.71 | 0.24 | .016 | 0.08 | .217 | 1.26(0.10) | 0.82 | 0.71 | 0.28 | <.001 | 0.09 | .126 |
| fronto-temporal, right | 0.18(0.02) | 0.87 | 0.80 | 0.35 | <.001 | 0.00 | .500 | 1.60(0.08) | 0.86 | 0.78 | 0.30 | .001 | 0.12 | .121 | 1.24(0.10) | 0.88 | 0.78 | 0.23 | <.001 | 0.17 | .012 |
| temporo-parietal, left | 0.14(0.02) | 0.60 | 0.60 | 0.18 | .132 | 0.12 | .194 | 1.53(0.09) | 0.64 | 0.62 | 0.09 | .243 | 0.18 | .044 | 1.26(0.09) | 0.71 | 0.65 | 0.20 | .010 | 0.11 | .088 |
| temporo-parietal, right | 0.15(0.02) | 0.85 | 0.81 | 0.27 | .011 | 0.00 | .500 | 1.60(0.08) | 0.89 | 0.80 | 0.31 | .002 | 0.04 | .329 | 1.29(0.09) | 0.88 | 0.78 | 0.23 | .001 | 0.10 | .100 |
| Uncinate fasciculus | |||||||||||||||||||||
| left | 0.18(0.02) | 0.92 | 0.90 | 0.26 | .001 | 0.00 | .500 | 1.60(0.08) | 0.80 | 0.77 | 0.20 | .016 | 0.15 | .047 | 1.22(0.10) | 0.90 | 0.85 | 0.24 | <.001 | 0.06 | .172 |
| right | 0.19(0.02) | 0.86 | 0.88 | 0.21 | .011 | 0.04 | .305 | 1.62(0.08) | 0.77 | 0.74 | 0.17 | .075 | 0.11 | .131 | 1.22(0.10) | 0.88 | 0.84 | 0.27 | <.001 | 0.02 | .364 |
| Sup. longitudinal fasciculus | |||||||||||||||||||||
| left | 0.15(0.02) | 0.78 | 0.70 | 0.38 | <.001 | 0.00 | .500 | 1.51(0.08) | 0.68 | 0.65 | 0.17 | .094 | 0.19 | .044 | 1.20(0.09) | 0.78 | 0.66 | 0.24 | .001 | 0.15 | .036 |
| right | 0.15(0.02) | 0.76 | 0.63 | 0.37 | <.001 | 0.00 | .500 | 1.52(0.08) | 0.66 | 0.58 | 0.32 | .011 | 0.09 | .227 | 1.20(0.09) | 0.77 | 0.66 | 0.24 | .001 | 0.16 | .024 |
| Inf. longitudinal fasciculus | |||||||||||||||||||||
| left | 0.22(0.02) | 0.91 | 0.89 | 0.37 | .003 | 0.00 | .490 | 1.73(0.09) | 0.84 | 0.81 | 0.18 | .088 | 0.14 | .112 | 1.23(0.09) | 0.75 | 0.60 | 0.33 | <.001 | 0.00 | .500 |
| right | 0.22(0.02) | 0.90 | 0.88 | 0.36 | .004 | 0.00 | .500 | 1.70(0.08) | 0.82 | 0.80 | 0.08 | .275 | 0.24 | .020 | 1.21(0.09) | 0.74 | 0.63 | 0.22 | .002 | 0.10 | .072 |
| Inf. fronto-occipital fasciculus | |||||||||||||||||||||
| left | 0.22(0.02) | 0.93 | 0.91 | 0.23 | .002 | 0.08 | .149 | 1.70(0.09) | 0.84 | 0.78 | 0.24 | .036 | 0.09 | .217 | 1.22(0.09) | 0.89 | 0.82 | 0.25 | <.001 | 0.06 | .176 |
| right | 0.22(0.02) | 0.93 | 0.90 | 0.25 | .001 | 0.07 | .164 | 1.68(0.08) | 0.83 | 0.74 | 0.32 | .001 | 0.08 | .195 | 1.21(0.09) | 0.91 | 0.83 | 0.23 | <.001 | 0.11 | .049 |
| Optic tract | |||||||||||||||||||||
| left | 0.09(0.03) | 0.89 | 0.86 | 0.41 | 0.018 | 0.00 | .500 | 1.77(0.08) | 0.93 | 0.92 | 0.19 | .192 | 0.00 | .500 | 1.36(0.08) | 0.94 | 0.93 | 0.25 | .159 | 0.00 | .500 |
| right | 0.18(0.01) | 0.90 | 0.89 | 0.33 | 0.010 | 0.00 | .500 | 1.73(0.07) | 0.95 | 0.94 | 0.25 | .231 | 0.01 | .479 | 1.33(0.06) | 0.96 | 0.94 | 0.32 | .029 | 0.00 | .500 |
|
| |||||||||||||||||||||
| Overall mean | 0.21(0.02) | 0.89 | 0.85 | 0.33 | – | 0.02 | – | 1.60(0.08) | 0.84 | 0.78 | 0.32 | – | 0.07 | – | 1.17(0.08) | 0.89 | 0.82 | 0.30 | – | 0.06 | – |
divided by 103 for real value
Among 47 tracts, the right fornix had the highest heritability in all three parameters. Other tracts with high heritability for FA were the hippocampal bundle of right cingulum (a2 = 0.57) and splenium of corpus callosum (a2 = 0.52), for AD the rostrum (a2 = 0.54) and premotor body (a2 = 0.53) of corpus callosum, and for RD the premotor body of corpus callosum (a2 = 0.46).
3.2. Relationships between genetic contribution estimates of three DTI parameters
AD and RD showed robust correlation in their genetic contribution estimates (rs = .70, p < .0001). AD and FA also showed moderate correlation in those estimates (rs = .33, p = .02) while FA and RD did not show significant correlation (rs = .25, p = .92).
Fig. 1 shows relationships between the genetic estimates of three parameters together. The three major types of white matter fibers were roughly grouped along the scatter plot of a2 of AD vs. a2 of RD. Commissural fibers had higher heritability for both AD and RD while association fibers tended to have lower values of both AD and RD; projection fibers were in between. However, contrary to cingulate portion of cingulum fiber, bilateral hippocampal portions of cinguli commonly showed the lowest heritability values of AD and RD. Note that a2 of FA is presented as a radius in this plot and tended to be more variable, with commissural and projection fibers having higher heritability than association fibers.
Fig. 1.

Relationship between genetic contribution estimates of AD, RD, and FA for 43 tracts. The x-axis, y-axis, and the radius of each circle represent the estimates of AD, RD, and FA, respectively. Bilateral optic tracts and medial lemniscal pathways were not shown in this graph. SLF, superior longitudinal fasciculus; ILF, inferior longitudinal fasciculus; IFOF, inferior fronto-occipital fasciculus; UNC, uncinate fasciculus.
3.3. Heritability of single data point along individual tract
Table 3 presents a summary of genetic and common environmental estimates for single data points across each tract. Relative to the values of genetic and environmental variances from tract-averaged value of DTI parameters, genetic estimates of single data points were generally reduced and environmental contribution estimates were increased. However, fibers still maintained their ranks in the heritability.
Table 3.
Summary of genetic and common environmental contribution estimates at single data points for each tract.
| No. of data points | FA
|
AD
|
RD
|
|||||||
|---|---|---|---|---|---|---|---|---|---|---|
| a2, mean [range] | % of significant points of a2 | c2, mean [range] | a2, mean [range] | % of significant points of a2 | c2, mean [range] | a2, mean [range] | % of significant points of a2 | c2, mean [range] | ||
| Corpus callosum | ||||||||||
| rostrum, orbitofrontal | 95 | 0.24 [0–0.46] | 45.3 | 0.03 [0–0.19] | 0.07 [0–0.59] | 16.8 | 0.21 [0–0.39] | 0.32 [0–0.52] | 74.7 | 0.05 [0–0.27] |
| genu, prefrontal | 94 | 0.25 [0–0.58] | 66.0 | 0.07 [0–0.33] | 0.14 [0–0.50] | 38.3 | 0.22 [0–0.41] | 0.31 [0–0.54] | 79.8 | 0.09 [0–0.34] |
| body, premotor | 92 | 0.33 [0–0.71] | 73.9 | 0.02 [0–0.14] | 0.19 [0–0.57] | 39.1 | 0.21 [0–0.39] | 0.37 [0–0.69] | 81.5 | 0.08 [0–0.40] |
| body, motor | 87 | 0.35 [0–0.58] | 67.8 | 0.03 [0–0.21] | 0.14 [0–0.62] | 31.0 | 0.18 [0–0.36] | 0.33 [0–0.64] | 70.1 | 0.06 [0–0.28] |
| body, parietal | 128 | 0.28 [0–0.63] | 64.8 | 0.06 [0–0.24] | 0.10 [0–0.54] | 17.2 | 0.20 [0–0.37] | 0.30 [0–0.54] | 73.4 | 0.06 [0–0.33] |
| splenium, occipital | 152 | 0.39 [0–0.70] | 71.7 | 0.05 [0–0.24] | 0.10 [0–0.50] | 16.4 | 0.16 [0–0.31] | 0.31 [0–0.55] | 67.1 | 0.09 [0–0.36] |
| tapetum, temporal | 181 | 0.31 [0–0.54] | 66.3 | 0.05 [0–0.33] | 0.19 [0–0.64] | 29.8 | 0.18 [0–0.45] | 0.26 [0–0.64] | 50.8 | 0.10 [0–0.33] |
| Corticothalamic tract | ||||||||||
| prefrontal, left | 81 | 0.29 [0–0.52] | 63.0 | 0.02 [0. –0.26] | 0.13 [0–0.47] | 46.9 | 0.20 [0–0.27] | 0.18 [0–0.52] | 48.1 | 0.10 [0–0.28] |
| prefrontal, right | 79 | 0.23 [0–0.40] | 55.7 | 0.04 [0–0.31] | 0.14 [0–0.50] | 50.6 | 0.21 [0–0.45] | 0.15 [0–0.50] | 43.0 | 0.16 [0–0.31] |
| premotor, left | 79 | 0.25 [0–0.53] | 50.6 | 0.03 [0–0.26] | 0.10 [0–0.58] | 26.6 | 0.20 [0–0.41] | 0.23 [0–0.50] | 62.0 | 0.08 [0–0.22] |
| premotor, right | 80 | 0.23 [0–0.46] | 40.0 | 0.09 [0–0.33] | 0.13 [0–0.53] | 50.0 | 0.23 [0–0.43] | 0.22 [0–0.48] | 61.3 | 0.13 [0–0.29] |
| motor, left | 80 | 0.16 [0–0.44] | 28.8 | 0.11 [0–0.32] | 0.15 [0–0.59] | 53.8 | 0.17 [0–0.37] | 0.22 [0–0.52] | 57.5 | 0.09 [0–0.26] |
| motor, right | 82 | 0.23 [0–0.55] | 50.0 | 0.08 [0–0.29] | 0.14 [0–0.64] | 51.2 | 0.21 [0–0.46] | 0.24 [0–0.52] | 59.8 | 0.11 [0–0.27] |
| parietal, left | 68 | 0.23 [0–0.43] | 45.6 | 0.07 [0–0.26] | 0.07 [0–0.55] | 35.3 | 0.23 [0–0.41] | 0.18 [0–0.49] | 50.0 | 0.13 [0–0.28] |
| parietal, right | 64 | 0.31 [0–0.58] | 62.5 | 0.04 [0–0.23] | 0.13 [0–0.67] | 48.4 | 0.23 [0–0.46] | 0.24 [0–0.49] | 65.6 | 0.10 [0–0.25] |
| Corticofugal tract | ||||||||||
| prefrontal, left | 109 | 0.24 [0–0.41] | 54.1 | 0.04 [0–0.26] | 0.06 [0–0.40] | 27.5 | 0.25 [0–0.45] | 0.12 [0–0.42] | 36.7 | 0.15 [0–0.33] |
| prefrontal, right | 110 | 0.18 [0–0.36] | 32.7 | 0.07 [0–0.26] | 0.09 [0–0.48] | 35.5 | 0.22 [0–0.59] | 0.11 [0–0.44] | 35.5 | 0.17 [0–0.32] |
| premotor, left | 112 | 0.20 [0–0.52] | 40.2 | 0.07 [0–0.30] | 0.09 [0–0.58] | 28.6 | 0.24 [0–0.43] | 0.16 [0–0.50] | 49.1 | 0.13 [0–0.30] |
| premotor, right | 117 | 0.23 [0–0.46] | 39.3 | 0.06 [0–0.29] | 0.33 [0–0.61] | 53.0 | 0.08 [0–0.33] | 0.22 [0–0.48] | 59.0 | 0.09 [0–0.24] |
| motor, left | 121 | 0.21 [0–0.53] | 46.3 | 0.09 [0–0.34] | 0.12 [0–0.62] | 48.8 | 0.20 [0–0.42] | 0.18 [0–0.55] | 45.5 | 0.12 [0–0.27] |
| motor, right | 122 | 0.23 [0–0.61] | 45.9 | 0.08 [0–0.36] | 0.09 [0–0.56] | 31.1 | 0.23 [0–0.47] | 0.18 [0–0.54] | 41.0 | 0.11 [0–0.33] |
| parietal, left | 120 | 0.22 [0–0.54] | 48.3 | 0.07 [0–0.31] | 0.06 [0–0.34] | 27.5 | 0.21 [0–0.40] | 0.15 [0–0.44] | 41.7 | 0.10 [0–0.26] |
| parietal, right | 119 | 0.24 [0–0.72] | 40.3 | 0.07 [0–0.29] | 0.11 [0–0.58] | 39.5 | 0.19 [0–0.50] | 0.14 [0–0.53] | 29.4 | 0.11 [0–0.33] |
| Medial lemniscal pathway | ||||||||||
| Left | 42 | 0.14 [0–0.45] | 16.7 | 0.08 [0–0.27] | 0.12 [0–0.37] | 16.7 | 0.13 [0–0.33] | 0.14 [0–0.30] | 14.3 | 0.10 [0–0.28] |
| Right | 42 | 0.10 [0–0.36] | 9.5 | 0.08 [0–0.30] | 0.12 [0–0.43] | 0.0 | 0.14 [0–0.28] | 0.09 [0–0.43] | 0.0 | 0.18 [0–0.33] |
| Cingulum | ||||||||||
| cingulate gyrus, left | 86 | 0.20 [0–0.39] | 16.3 | 0.06 [0–0.25] | 0.12 [0–0.46] | 14.0 | 0.10 [0–0.40] | 0.15 [0–0.36] | 31.4 | 0.08 [0–0.26] |
| cingulate gyrus, right | 79 | 0.10 [0–0.32] | 0.0 | 0.09 [0–0.26] | 0.12 [0–0.41] | 19.0 | 0.13 [0–0.35] | 0.18 [0–0.42] | 35.4 | 0.08 [0–0.25] |
| hippocampal, left | 104 | 0.32 [0–0.60] | 42.3 | 0.06 [0–0.35] | 0.02 [0–0.32] | 2.9 | 0.21 [0–0.32] | 0.13 [0–0.53] | 31.7 | 0.16 [0–0.36] |
| hippocampal, right | 102 | 0.37 [0–0.59] | 61.8 | 0.05 [0–0.30] | 0.03 [0–0.31] | 2.9 | 0.17 [0–0.41] | 0.13 [0–0.49] | 25.5 | 0.14 [0–0.30] |
| Fornix | ||||||||||
| Left | 142 | 0.30 [0–0.52] | 62.0 | 0.08 [0–0.50] | 0.20 [0–0.61] | 37.3 | 0.18 [0–0.42] | 0.24 [0–0.62] | 47.9 | 0.14 [0–0.36] |
| Right | 146 | 0.37 [0–0.66] | 64.4 | 0.05 [0–0.37] | 0.42 [0–0.81] | 62.3 | 0.08 [0–0.38] | 0.46 [0–0.85] | 67.1 | 0.05 [0–0.34] |
| Arcuate fasciculus | ||||||||||
| fronto-parietal, left | 70 | 0.28 [0–0.51] | 51.4 | 0.03 [0–0.32] | 0.05 [0–0.43] | 7.1 | 0.21 [0–0.37] | 0.27 [0–0.44] | 74.3 | 0.11 [0–0.30] |
| fronto-parietal, right | 61 | 0.31 [0–0.48] | 59.0 | 0.03 [0–0.28] | 0.17 [0–0.54] | 36.1 | 0.17 [0–0.39] | 0.38 [0–0.53] | 91.8 | 0.06 [0–0.21] |
| fronto-temporal, left | 117 | 0.15 [0–0.46] | 23.9 | 0.14 [0–0.30] | 0.07 [0–0.32] | 4.3 | 0.17 [0–0.40] | 0.24 [0–0.47] | 59.8 | 0.08 [0–0.21] |
| fronto-temporal, right | 106 | 0.25 [0–0.54] | 39.6 | 0.05 [0–0.24] | 0.05 [0–0.48] | 11.3 | 0.24 [0–0.40] | 0.25 [0–0.50] | 70.8 | 0.13 [0–0.28] |
| temporo-parietal, left | 79 | 0.10 [0–0.38] | 8.9 | 0.10 [0–0.32] | 0.10 [0–0.48] | 12.7 | 0.13 [0–0.36] | 0.17 [0–0.49] | 45.6 | 0.10 [0–0.28] |
| temporo-parietal, right | 76 | 0.19 [0–0.40] | 36.8 | 0.06 [0–0.23] | 0.01 [0–0.41] | 2.6 | 0.25 [0–0.36] | 0.20 [0–0.37] | 2.6 | 0.12 [0–0.29] |
| Uncinate fasciculus | ||||||||||
| Left | 90 | 0.23 [0–0.46] | 55.6 | 0.05 [0–0.25] | 0.07 [0–0.43] | 20.0 | 0.24 [0–0.38] | 0.17 [0–0.45] | 51.1 | 0.11 [0–0.26] |
| Right | 87 | 0.20 [0–0.49] | 41.4 | 0.06 [0–0.25] | 0.07 [0–0.45] | 41.4 | 0.18 [0–0.32] | 0.13 [0–0.43] | 41.4 | 0.12 [0–0.28] |
| Sup. longitudinal fasciculus | ||||||||||
| Left | 75 | 0.21 [0–0.44] | 36.0 | 0.03 [0–0.26] | 0.02 [0–0.25] | 0.0 | 0.25 [0–0.43] | 0.23 [0–0.44] | 58.7 | 0.12 [0–0.31] |
| Right | 70 | 0.24 [0–0.46] | 38.6 | 0.02 [0–0.24] | 0.13 [0–0.52] | 25.7 | 0.15 [0–0.41] | 0.26 [0–0.51] | 62.9 | 0.11 [0–0.26] |
| Inf. longitudinal fasciculus | ||||||||||
| Left | 100 | 0.29 [0–0.50] | 57.0 | 0.05 [0–0.26] | 0.02 [0–0.31] | 0.0 | 0.24 [0–0.34] | 0.24 [0–0.48] | 62.0 | 0.09 [0–0.31] |
| Right | 100 | 0.23 [0–0.56] | 36.0 | 0.05 [0–0.22] | 0.05 [0–0.48] | 5.0 | 0.23 [0–0.41] | 0.22 [0–0.54] | 42.0 | 0.11 [0–0.28] |
| Inf. fronto-occipital fasciculus | ||||||||||
| Left | 158 | 0.27 [0–0.55] | 58.9 | 0.08 [0–0.34] | 0.11 [0–0.49] | 20.9 | 0.21 [0–0.41] | 0.25 [0–0.46] | 61.4 | 0.08 [0–0.29] |
| Right | 152 | 0.26 [0–0.49] | 54.6 | 0.07 [0–0.28] | 0.11 [0–0.64] | 22.4 | 0.23 [0–0.40] | 0.26 [0–0.50] | 69.1 | 0.10 [0–0.35] |
| Optic tract | ||||||||||
| Left | 70 | 0.20 [0–0.45] | 38.6 | 0.05 [0–0.38] | 0.13 [0–0.61] | 25.7 | 0.12 [0–0.40] | 0.13 [0–0.61] | 28.6 | 0.11 [0–0.40] |
| Right | 66 | 0.19 [0–0.44] | 10.6 | 0.09 [0–0.32] | 0.12 [0–0.65] | 19.7 | 0.14 [0–0.45] | 0.17 [0–0.70] | 25.8 | 0.10 [0–0.29] |
For FA, 40 % of all tract data points had significant genetic variance; the highest was the premotor portion of the corpus callosum (73.9%) and the lowest was the right cingulate of cingulum (0%). For AD, only 15.9% of all tract data points had significant genetic variance; the highest was right fornix (62.3%) and the lowest was right medial lemniscal pathway and left superior longitudinal fasciculus (0%). For RD, 53.0% of all tract data points had significant genetic variance; the highest was the right fronto-parietal portion of arcuate fasciculus (91.8%) and the lowest was the right medial lemniscal pathway (0%).
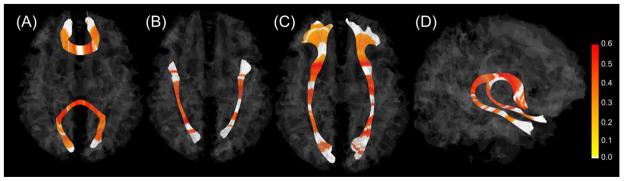
Fig. 2 and 3 show data points with statistically significant genetic variation along each tract (see Appendix C for all tracts). By highlighting genetically significant points along each tract, we were able to visualize which portions had significant genetic variance. For FA, substantial portions of all corpus callosum bundles showed significance, with no significance at each end of the tract. Corticothalamic and corticofugal tracts had significant regions mainly in the cortical portions of the tracts. Corticofugal tracts, in particular, had additional significant regions at the level of the internal capsule and cerebral peduncle (Fig. 4). The frontal part of the fronto-temporal branch in the arcuate fasciculus was significant while the remainder was not significant. The cingulate region of cingulum showed less significance while the hippocampal region of cingulum had significance. RD heritability along individual tracts demonstrated relatively similar patterns to those observed in FA heritability. Compared to FA and RD, AD along tracts demonstrated a pattern of more variable and smaller, more interrupted segments of significant heritability.
Fig. 2.

Actual heritability plot of FA (A) and simplified versions of FA (B), AD (C), and RD (D) along tracts. In the graph B, C, and D, data points (x-axis) which showed significant heritability of FA, AD, and RD are highlighted in red, blue, and pink, respectively, on the mean value of each diffusion parameter (y-axis) along the individual tract. For real values for AD and RD, values on the y-axis are multiplied by 10−2.
Fig. 3.
Statistically significant heritability estimates of FA along each tract for representative fibers. The genu and the splenium (A), the inferior longitudinal fasciculus (B), the inferior fronto-occipital fasciculus (C), and the fornix (D). The color bar shows heritability estimates of the FA. Heritability estimates with significance are highlighted; non-significant portions are white.
Fig. 4.

Statistically significant heritability estimates of the FA along the left prefrontal bundle of the corticofugal fibers at different anatomical levels of the tract. The color bar shows heritability estimates of the FA. ACR, anterior corona radiata; ALIC, anterior limb of internal capsule; PLIC, posterior limb of internal capsule; CP, cerebral peduncle.
3.4. Relationships between DTI parameters and their heritability
In the ZIP model including all data points of all tracts, count coefficients were significant for FA and AD, but not RD, which suggests that for increasing FA and AD, heritability increases. On the other hand, zero-inflation coefficients were significant for FA, AD, and RD, indicating that as FA, AD, and RD increase, chances of a point having zero heritability decrease. In general, larger DTI values correspond to larger mean of heritability for the Poisson part and to smaller probability of a2 = 0 (Table 4). We also provide histograms of DTI parameters and their heritability in Appendix B.
Table 4.
Zero-inflated Poisson regression model based on the DTI parameter and the discretized heritability value
| Count model (Poisson with log link)
|
Zero-inflation model (binomial with logit link)
|
|||||||
|---|---|---|---|---|---|---|---|---|
| Estimate | Std. error | z value | p | Estimate | Std. error | z value | p | |
| FA | 1.4 | 0.1 | 19.8 | <.0001 | −5.5 | 0.8 | −7.7 | <.0001 |
| AD | 156.9 | 27.8 | 5.6 | <.0001 | −2723.6 | 157.6 | −17.3 | <.0001 |
| RD | −36.7 | 29.9 | −1.2 | .22 | −5643.2 | 221.7 | −25.5 | <.0001 |
Individual tracts also show the similar pattern of the relationship between DTI parameters and their heritability. For example, the splenium had higher heritability in the tract-averaged FA analysis demonstrated higher FA, while the cingulate gyrus had lower heritability and lower FA in Fig. 5. However, results of correlation analyses for individual tracts were variable. Although positive correlations were found in the majority of fibers, about a dozen fibers showed no correlation and several fibers even showed negative correlations across DTI parameters. For FA and its heritability, most bundles within the corpus callosum showed high correlation coefficients. However, most bundles of the corticothalamic and corticofugal tracts showed no or negative correlations. For AD and its heritability, contrary to FA, all bundles of the corpus callosum except the parietal portion of body and tapetum had no or negative correlations while all of corticothalamic and corticofugal tracts except one showed positive correlations. For RD and its heritability, all corticothalamic and corticofugal tracts showed the highest correlations among all tracts across DTI parameters (Table 5). Most of the correlations still remained significant even if the alpha level was set at .001 (=.05/47) controlling for multiple comparisons.
Fig. 5.
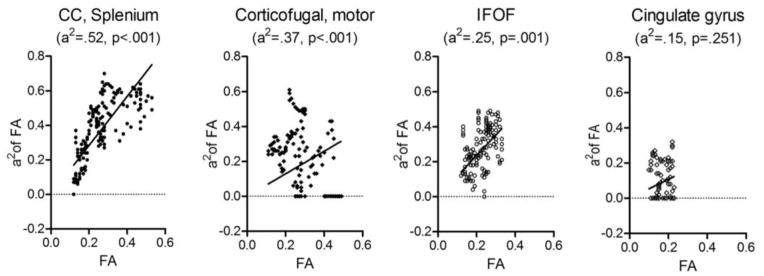
Correlation plots of FA, AD, and RD and their heritability estimates within single tracts. Heritability (a2) and p-value of the tract-averaged FA along the length of a given tract are indicated in the parenthesis under the name of the tract. As the heritability of the tract increases from cingulate bundle to splenium, their FA and a2 also tend to increase. The corticofugal bundle and the cingulate gyrus bundle are on the left and right side of the brain respectively. CC, corpus callosum; IFOF, inferior fronto-occipital fasciculus.
Table 5.
Correlation between tract-averaged diffusion parameters and their genetic contribution estimates
| FA vs a2FA
|
AD vs a2AD
|
RD vs a2RD
|
||||
|---|---|---|---|---|---|---|
| r | p | r | P | r | P | |
| Corpus callosum | ||||||
| rostrum, orbitofrontal | 0.68 | <.001 | −0.51 | <.001 | −0.58 | <.001 |
| genu, prefrontal | 0.53 | <.001 | −0.42 | <.001 | 0.05 | .63 |
| body, premotor | 0.71 | <.001 | −0.28 | .01 | 0.42 | <.001 |
| body, motor | 0.30 | .01 | −0.09 | .43 | 0.35 | <.005 |
| body, parietal | 0.74 | <.001 | 0.22 | .01 | 0.65 | <.001 |
| splenium, occipital | 0.78 | <.001 | 0.03 | .72 | −0.05 | .56 |
| tapetum, temporal | 0.43 | <.001 | 0.73 | <.001 | 0.51 | <.001 |
| Cortico-thalamic tract | ||||||
| prefrontal, left | 0.59 | <.001 | 0.73 | <.001 | 0.71 | <.001 |
| prefrontal, right | 0.33 | <.005 | 0.82 | <.001 | 0.75 | <.001 |
| premotor, left | 0.41 | <.001 | 0.44 | <.001 | 0.53 | <.001 |
| premotor, right | −0.03 | .82 | 0.37 | <.005 | 0.70 | <.001 |
| motor, left | 0.01 | .91 | 0.43 | <.001 | 0.66 | <.001 |
| motor, right | 0.30 | .01 | 0.35 | <.005 | 0.61 | <.001 |
| parietal, left | −0.25 | .04 | 0.60 | <.001 | 0.71 | <.001 |
| parietal, right | −0.03 | .81 | 0.43 | <.001 | 0.86 | <.001 |
| Corticofugal tract | ||||||
| prefrontal, left | 0.07 | .46 | 0.66 | <.001 | 0.68 | <.001 |
| prefrontal, right | 0.01 | .93 | 0.69 | <.001 | 0.72 | <.001 |
| premotor, left | 0.03 | .77 | 0.58 | <.001 | 0.65 | <.001 |
| premotor, right | −0.05 | .60 | 0.52 | <.001 | 0.73 | <.001 |
| motor, left | −0.13 | .15 | 0.20 | .03 | 0.55 | <.001 |
| motor, right | −0.35 | <.001 | 0.14 | .14 | 0.72 | <.001 |
| parietal, left | 0.09 | .31 | 0.38 | <.001 | 0.79 | <.001 |
| parietal, right | −0.33 | <.001 | 0.38 | <.001 | 0.89 | <.001 |
| Medial lemniscal | ||||||
| left | 0.69 | <.001 | 0.51 | <.005 | 0.63 | <.001 |
| right | 0.64 | <.001 | 0.31 | .05 | 0.44 | <.005 |
| Cingulum | ||||||
| cingulate gyrus, left | 0.54 | <.001 | 0.06 | .61 | 0.01 | .97 |
| cingulate gyrus, right | 0.12 | .29 | −0.43 | <.001 | 0.31 | .01 |
| hippocampal, left | 0.66 | <.001 | 0.02 | .81 | 0.75 | <.001 |
| hippocampal, right | 0.24 | .02 | −0.16 | .10 | 0.27 | .01 |
| Fornix | ||||||
| left | 0.38 | <.001 | 0.80 | <.001 | 0.72 | <.001 |
| right | 0.41 | <.001 | 0.59 | <.001 | −0.17 | .04 |
| Arcuate fasciculus | ||||||
| fronto-parietal, left | 0.64 | <.001 | 0.24 | .05 | −0.03 | .82 |
| fronto-parietal, right | 0.36 | <.005 | 0.22 | .09 | −0.07 | .59 |
| fronto-temporal, left | 0.56 | <.001 | 0.15 | .10 | −0.70 | .46 |
| fronto-temporal, right | 0.47 | <.001 | −0.58 | <.001 | −0.13 | .19 |
| temporo-parietal, left | 0.17 | .15 | −0.08 | .46 | −0.24 | .03 |
| temporo-parietal, right | −0.14 | .23 | −0.10 | .40 | 0.29 | .01 |
| Uncinate fasciculus | ||||||
| left | 0.45 | <.001 | 0.78 | <.001 | 0.76 | <.001 |
| right | 0.35 | <.005 | 0.55 | <.001 | 0.34 | <.005 |
| Sup. longitudinal fasciculus | ||||||
| left | 0.44 | <.001 | 0.16 | .17 | −0.05 | .68 |
| right | 0.28 | .02 | 0.22 | .07 | 0.11 | .36 |
| Inf. longitudinal fasciculus | ||||||
| left | 0.54 | <.001 | −0.30 | <.005 | −0.69 | <.001 |
| right | 0.66 | <.001 | 0.16 | .12 | −0.18 | .07 |
| Inf. fronto-occipital fasciculus | ||||||
| left | 0.60 | <.001 | 0.21 | .01 | 0.30 | <.001 |
| right | 0.32 | <.001 | 0.34 | <.001 | 0.31 | <.001 |
| Optic tract | ||||||
| left | −0.29 | .01 | 0.05 | .70 | 0.43 | <.001 |
| right | 0.13 | .31 | 0.24 | .06 | 0.57 | <.001 |
3.5. Relative contributions of heritability versus other factors on DTI metrics
The covariates of biological sex, gestational age, postmenstrual age, scanner type, and gradient direction explained 31% to 59% of total variance across DTI parameters in three selected fibers. Variances explained by gestational and postmenstrual age were slightly lower than variances by all five factors, suggesting that among five factors, age-related variables, especially postmenstrual age at scan have a dominant impact on DTI metrics variability (Table 6). Compared to the genetic variation from 0.15 to 0.46, age variation is similar or moderately larger. Note that age did not influence the genetic variation much, but influenced the common environment part more, when age was included in the model.
Table 6.
Variations explained by various factors
| Variation explained by five factors | Variation explained by age-related factors | Genetic variation | ||
|---|---|---|---|---|
| FA | Genu | 0.59 | 0.57 | 0.25 |
| Splenium | 0.35 | 0.33 | 0.52 | |
| Cingulum | 0.31 | 0.22 | 0.15 | |
| AD | Genu | 0.41 | 0.40 | 0.46 |
| Splenium | 0.39 | 0.36 | 0.34 | |
| Cingulum | 0.37 | 0.34 | 0.36 | |
| RD | Genu | 0.56 | 0.55 | 0.30 |
| Splenium | 0.53 | 0.50 | 0.38 | |
| Cingulum | 0.58 | 0.57 | 0.31 |
Five factors are gender, scanner type, gradient direction, gestational and postmenstrual age (two age-related factors)
4. Discussion
To the best of our knowledge, this is the first tract-based study of white matter microstructure heritability in neonates. We found significant genetic influence on variation in almost all tracts with similar mean genetic variances across three diffusion parameters. Commissural fibers tended to have highest heritabilities for AD, RD and FA, while association fibers tended to have the least. Whole tract estimates were reflected in the spatial distribution of points along each tract with significant heritability, with commissural fibers such as the corpus callosum having the greatest number of points with significant heritability.
4.1. Heritability of the tract-averaged values of DTI parameters
Previous reports of FA heritability at different ages (0.60 for whole brain at neonate, 0.55 for frontal lobe at age 25, 0.52 for whole brain at age 19 to 85, 0.49 for genu at age 75) (Geng et al., 2012b, Chiang et al., 2009; Kochunov et al., 2010; Pfeefferbaum et al., 2001, respectively) seem to support a general notion that genetic variation might decrease with development and aging because different environmental exposures could be a dominant force shaping white matter integrity after birth. One cross-sectional study comparing adolescents (age 12 or 16) and adults (mean age 23.7) also demonstrated this trend in FA heritability from 0.7–0.8 in the adolescents to 0.3–0.4 in the adults (Chiang et al., 2011b). However, developmental changes in heritability during childhood may be more complicated considering the complex interplay between genes and environment, as well as different developmental schedules of individual tract maturation. For example, a longitudinal study with children as age 9 did not find the decrease in heritability in their 3 year follow-up (Brouwer et al., 2012).
The mean (±SD) genetic variance in this study was 0.33 ± 0.10 for FA, 0.32 ± 0.14 for AD, and 0.30 ± 0.09 for RD. These estimates were somewhat lower, when compared to our earlier study of neonates (Geng et al., 2012b), reporting 0.60, 0.57, and 0.53 for FA, AD, and RD, respectively, over whole brain white matter ROIs. This discrepancy may be due to the methodological differences. Unlike ROI methods including literally ‘interesting’ regions possibly showing high heritability, quantitative tractography includes all the data along a tract and, thus, heritability estimates may be standardized downward (see the range of genetic estimates including maximum values in table 3). In fact, heritability estimates in this study were rather consistent with those around 0.3 in one study using the same method of quantitative tractography (Brouwer et al., 2010). Moreover, Eyler et al. (2012) argued that the degree of averaging or summation differs substantially from region to region, increasing with enlarging region size and heritability estimates should increase with increased region size for ROI-based calculations because of the inclusion of measurement error in the unique environmental variance component of the twin model.
4.2. Relationships between heritability estimates of three DTI parameters
We found that heritability was generally highest in commissural fibers such as the corpus callosum, followed by projection fibers such as corticothalamic and corticofugal bundles, with association fibers having the least heritability. This general pattern was found in previous studies though those reported using ROIs in neonates (Geng et al., 2012b) or tractography in a few tracts in 9 year olds (Brouwer et al., 2010). These findings suggest that, whether white matter fibers are well-developed (-myelinated) or not, some fibers like corpus callosum vary between people because of genetic factors. In other words, other fibers with less heritability of AD and RD, like association fibers, may be more substantially influenced by environmental influences or have more measurement error. In effect, association fibers with lower heritability, for example, the hippocampal portion of the cingulum, tended to show higher common environmental contribution estimates than commissural or projection fibers (see table 2). This observation is also in line with the general notion that projection fibers become myelinated before association fibers in the white matter maturation process (Kinney et al., 1988).
It is interesting that the right fornix had the highest heritability in all three parameters (see Fig. 1). This is consistent with the fact that the fornix and the cingulum are the most noticeable tracts in the fetal brain and their entire fiber paths are already developed at 19 gestational weeks (Huang et al., 2006). Regarding left-right asymmetry, a recent study showed no age-related development of structural laterality in the fornix (Song et al., 2014). However, there have not been any studies on functional (including heritability) asymmetry yet, although we do not generally see much genetic variance in differences between hemispheres (Eyler et al., 2014). Of note is that, contrary to cingulate portion of cingulum fiber, hippocampal portions of cinguli commonly showed the lowest heritability values of AD and RD among all tracts. Although it seems a continuous band of white matter, the cingulum bundle contains many short association fibers (Schmahmann and Panya, 2006) and is composed of distinct white matter clusters that are likely to play different functional roles (Jones et al., 2013). Here we add additional heritability data that supports a distinction between the cingulate and hippocampal subdivisions of cingulum.
4.3. Relationship between heritability and maturation status
The ZIP regression analyses of overall data points demonstrate that higher DTI parameters are associated with higher heritability and fewer points with zero heritability. Our previous ROI-based study for entire ROIs (Geng et al., 2012b) also found positive correlations between AD and RD and their genetic estimates (r = .05, p = .02 for AD; r = .17, p < .00001 for RD), though no significant relationship for FA. Our correlation analyses of individual tracts strongly support this general relationship because for most tracts, there is a positive correlation between AD, RD and FA and heritability. Although these findings may be theoretically influenced by changes in measurement error with development, it seems very unlikely that FA, RD, and AD would be influenced in opposite directions by this potential artifact.
The reason for this relationship is unclear. One potential explanation is related to tract maturation. A fiber that is actively being myelinated, a process likely driven by genetic factors may show high heritability in the twin model. Given that myelination is generally associated with increasing FA, FA and the heritability would be positively correlated. However, this would not explain the positive relationship with AD and RD which decrease with fiber maturation. Another potential explanation is related to the image analysis method. The positive association between DTI measures and their heritability may reflect the fact that higher values of FA may improve registration and fiber tracking resulting in less variability which would be reflected in higher heritability. Again, this would not explain the relationship for AD and RD.
Major changes in the white matter maturation are related to myelination after term (Dubois et al., 2014) and are especially evident for DTI parameters, with a marked increase in FA and decrease in AD as well as RD from neonates to 1-year (Gao et al., 2009a; Geng et al., 2012a). Around 40 weeks of the postmenstrual age, motor tract and the somatosensory radiations of the corticospinal tract begin to myelinate first at the level of the internal capsule (Berman et al., 2005) whereas association and limbic fibers are largely unmyelinated. Thus, mature fibers (e.g., projection fibers) have higher FA and lower RA and AD than inmature fibers (e.g., association fibers). Considering the general positive relationships between DTI parameters and their heritability in this study, mature fibers may have higher heritability in FA and lower heritability in RA and AD. However, since it has been shown that DTI parameters do not inevitably correspond to myelin (Beaulieu, 2002), the heritability of a given fiber may only partially reflect the level of myelination. In the present study, unmyelinated fibers such as the corpus callosum and the fornix with high FA as well as heritability are typical examples for this.
On the other hand, several studies have investigated gene variants and their relation to white matter integrity derived from DTI, such as FA, and identified that variation in oligodendrocyte/myelin (OM) genes (Voineskos et al., 2013), the neuregulin 1 tyrosine kinase receptor ErbB4 (NRG1-ErbB4) system (Zuliani et al., 2011), and neutrophin genes (Chiang et al., 2011a) is associated with white matter microstructures (Voineskos, 2014). Since all these genes are involved in oligodendrocyte, myelin, and axonal development and maintenance, these findings may support the relationship between DTI measures and their heritability as potential mechanisms which genes could influence DTI parameters. However, genes associated with FA have been studied only in adults and their role in the neonatal brain is largely unknown.
However, when it comes to this relationship in a single tract, the relationships between heritability and maturation seems to be more complex than those in the whole brain. In terms of heritability of DTI measures and their maturation, corpus callosum and association fibers showed more positive correlations in FA than in AD and RD whereas corticothalamic and corticofugal fibers showed more positive correlations in AD and RD than in FA. These findings suggested that commissural and association fibers may follow the general notion that maturation is associated with heritability – the higher FA, the higher heritability – while projection fibers may not follow this notion or have additional developmental rules to follow. One possible explanation is that projection fibers, relative to other fibers, showed disproportionate genetic influence of FA along the tract (described in the next section in detail). The significant genetic influence was exclusively found in the regions of the fiber located in the corona radiata irrespective of FA value. On the other hand, these located closer to the cortex in the projection fibers have high values of AD and RD, resulting in high positive correlations between these two parameters and their heritability (see Appendix C). We assume that dominant genetic influence in the regions between the internal capsule and the cortex leads to additional development of the corona radiata after birth, considering the low visibility of the peripheral regions of projection tracts (the corona radiata) in the fetal brain (Huang et al., 2006).
4.4. Genetic influences along the tract
Visualizing the heritability estimates of DTI parameters along the length of a fiber bundle provides evidence of differential genetic influences within a single tract. For example, the motor fibers of the left corticofugal bundle showed significant genetic influences in FA in a region of the tract located between the cortex and the internal capsule that constituted nearly half of the tract length as well as two small regions located ventrally along the tract length (see Appendix C). In particular, the first small segment (from 70 to 80 data points on x axis) exactly matched the level of the internal capsule and the second one (from 110 to 120 data points on x axis) matched the level of the cerebral peduncle. Interestingly, the bands of significance were arranged along the arc length in correspondence with known patterns of normal myelination visible on MRI. Specifically, regions of tracts with high significance values matched with anatomical sites known to exhibit high anisotropy at birth (Welker and Patton, 2012). We assumed that early myelination as well as coherent organization of axons may contribute to the higher heritability noted in these regions. This pattern was also observed in other bundles of corticofugal fibers and it is interesting that we did not find high heritability in same regions for AD and RD (see Appendix C). In fact, the internal capsule and the cerebral peduncle are well-developed in the early phase of development (Huang et al., 2006). These findings emphasize that genetic heritability of white matter integrity should be understood in the context of the maturations of the fibers, the structures that the tracts connect, as well as regions of crossing fibers that likely interfere with true heritability estimates. Futures studies with higher resolution and ability to detect crossing fibers will be improve assessment of true heritability.
A novel ratio of the length of fiber under genetic influence vs. the whole fiber length indicates to what extent a given fiber is genetically influenced. In general, about half of the tracts showed genetic influence on FA and RD values whereas only 16 % of the tracts did on AD values. In terms of FA and RD, substantial portions of the tract were already under genetic influences in neonates.
Compared to ROI-based analysis, quantitative tractography provides a reasonable representative value for a given tract as a whole. Atlas-based ROIs may contain different tracts in the ROI. Tract-based analysis also gives information about points along the length of the entire tract, allowing identification of different developmental trajectories at different regions within the same tract.
Several methodological considerations need to be discussed. First, there was heterogeneity of heritability along tracts, with region of high and low heritability adjacent to one another. Although the idea that a fiber would show the genetic influence sporadically may be a possible explanation, this pattern may be due to methodological limitations in our study: sample size, problems in DTI data preparation, tractography, and twin analysis model. In addition, zero heritability at certain data points seems unlikely on its own to account for the absence of genetic variation though this resulted from equal correlations in MZ and DZ twins. The developmental trajectories of these white matter regions/tracts may be relatively conserved and resistant to genetic variation, at least at this early stage of development. Second, we note that quantitatively tracked fibers may not actually correspond to anatomically specific fibers or fiber bundles. Although quantitative tractography may reflect the fiber shape, it is a statistical representation of the voxel-to-voxel coherence of MRI-detectible water diffusion in white matter. Third, we have to consider the possibility that genetic contributions could be underestimated due to measurement error, as measurement error can be attributed to unique environmental variance (Blokland et al., 2012; Neale and Cardon, 1992). In the same context, although we applied the same method across tracts, it is possible that some tracts may be well-tracked while others may not (inter-tract variability), or even within the same tract, some portions may be well-tracked while other portions may not (intra-tract variability) because of variable factors such as fiber profiles and anatomical structures. Test-retest measures within a subject would be useful to estimate the error of neonatal tractography measures. If these data were available, it would be possible to statistically correct for the effects of measurement error and obtain a more precise picture of genetic and environmental factors on development. Finally, although we controlled for gestational age at birth, which would account in part for premature birth, we could not meticulously control for every factor that might alter the development of white matter.
In conclusion, exhaustive quantitative tract-based white matter heritability study in 356 twin neonates demonstrated significant genetic influences in almost all tracts with similar mean genetic variances across three DTI parameters and positive relationships between three parameters and their heritability. More importantly, in a single tract analysis, relationships between parameters and their heritability as well as genetic influences along the length of the tract were highly variable. These findings suggest that genes may have influence on white matter microstructures simultaneously at multiple spots with various degrees along the tract. In future, studies focused on individual fibers along the tract and their interaction with neighboring structures will give us more insight on the intricate relationship between the white matter maturation and heritability.
Supplementary Material
Highlights.
We report comprehensive heritability data on white matter microstructure in neonates.
Most tracts showed significant and similar genetic influences across DTI parameters.
A single tract analysis showed highly variable genetic influences along the tract.
Acknowledgments
This work was supported by the National Institutes of Health grants MH 070890 (J.H. Gilmore), RR025747-01 (H. Zhu), and MH086633 (H. Zhu), as well as the National Science Foundation grants SES-1357666 (H. Zhu) and DMS-1407655 (H. Zhu).
Footnotes
Publisher's Disclaimer: This is a PDF file of an unedited manuscript that has been accepted for publication. As a service to our customers we are providing this early version of the manuscript. The manuscript will undergo copyediting, typesetting, and review of the resulting proof before it is published in its final citable form. Please note that during the production process errors may be discovered which could affect the content, and all legal disclaimers that apply to the journal pertain.
References
- Bale TL, Baram TZ, Brown AS, Goldstein JM, Insel TR, McCarthy MM, Nemeroff CB, Reyes TM, Simerly RB, Susser ES, Nestler EJ. Early life programming and neurodevelopmental disorders. Biol Psychiatry. 2010;68:314–319. doi: 10.1016/j.biopsych.2010.05.028. [DOI] [PMC free article] [PubMed] [Google Scholar]
- Beaulieu C. The basis of anisotropic water diffusion in the nervous system – a technical review. NMR Biomed. 2002;15:435–455. doi: 10.1002/nbm.782. [DOI] [PubMed] [Google Scholar]
- Berman JI, Glass HC, Miller SP, Mukherjee P, Ferriero DM, Barkovich AJ, Vigneron DB, Henry RG. Quantitative fiber tracking analysis of the optic radiation correlated with visual performance in premature newborns. Am J Neuroradiol. 2009;30:120–124. doi: 10.3174/ajnr.A1304. [DOI] [PMC free article] [PubMed] [Google Scholar]
- Blokland GA, de Zubicaray GI, McMahon KL, Wright MJ. Genetic and environmental influences on neuroimaging phenotypes: a meta-analytical perspective on twin imaging studies. Twin Res Hum Genet. 2012;15:351–371. doi: 10.1017/thg.2012.11. [DOI] [PMC free article] [PubMed] [Google Scholar]
- Brouwer RM, Mandl RC, Peper JS, van Baal GC, Kahn RS, Boomsma DI, Hulshoff Pol HE. Heritability of DTI and MTR in nine-year-old children. NeuroImage. 2010;53:1085–1092. doi: 10.1016/j.neuroimage.2010.03.017. [DOI] [PubMed] [Google Scholar]
- Brouwer RM, Mandl RC, Schnack HG, van Soelen IL, van Baal GC, Peper JS, Kahn RS, Boomsma DI, Hulshoff Pol HE. White matter development in early puberty: a longitudinal volumetric and diffusion tensor imaging twin study. PLoS One. 2012;7:e32316. doi: 10.1371/journal.pone.0032316. [DOI] [PMC free article] [PubMed] [Google Scholar]
- Chiang MC, Avedissian C, Barysheva M, Toga AW, McMahon KL, de Zubicaray GI, Wright MJ, Thompson PM. Extending genetic linkage analysis to diffusion tensor images to map single gene effects on brain fiber architecture. Med Image Comput Comput Assist Interv. 2009;12:506–513. doi: 10.1007/978-3-642-04271-3_62. [DOI] [PubMed] [Google Scholar]
- Chiang MC, Barysheva M, Toga AW, Medland SE, Hansell NK, James MR, McMahon KL, de Zubicaray GI, Martin NG, Wright MJ, Thompson PM. BDNF gene effects on brain circuitry replicated in 455 twins. Neuroimage. 2011a;55:448–454. doi: 10.1016/j.neuroimage.2010.12.053. [DOI] [PMC free article] [PubMed] [Google Scholar]
- Chiang MC, McMahon KL, de Zubicaray GI, Martin NG, Hickie I, Toga AW, Wright MJ, Thompson PM. Genetics of white matter development: a DTI study of 705 twins and their siblings aged 12 to 29. NeuroImage. 2011b;54:2308–2317. doi: 10.1016/j.neuroimage.2010.10.015. [DOI] [PMC free article] [PubMed] [Google Scholar]
- Dennis EL, Thompson PM. Typical and atypical brain development: a review of neuroimaging studies. Dialogues Clin Neurosci. 2013;15:359–384. doi: 10.31887/DCNS.2013.15.3/edennis. [DOI] [PMC free article] [PubMed] [Google Scholar]
- Dubois J, Dehaene-Lambertz G, Kulikova S, Poupon C, Hüppi PS, Hertz-Pannier L. The early development of brain white matter: a review of imaging studies in fetuses, newborns and infants. Neuroscience. 2014;12:48–71. doi: 10.1016/j.neuroscience.2013.12.044. [DOI] [PubMed] [Google Scholar]
- Dubois J, Dehaene-Lambertz G, Perrin M, Mangin JF, Cointepas Y, Duchesnay E, Le Bihan D, Hertz-Pannier L. Asynchrony of the early maturation of white matter bundles in healthy infants: quantitative landmarks revealed noninvasively by diffusion tensor imaging. Hum Brain Mapp. 2008;29:14–27. doi: 10.1002/hbm.20363. [DOI] [PMC free article] [PubMed] [Google Scholar]
- Dubois J, Hertz-Pannier L, Dehaene-Lambertz G, Cointepas Y, Le Bihan D. Assessment of the early organization and maturation of infants’ cerebral white matter fiber bundles: a feasibility study using quantitative diffusion tensor imaging and tractography. NeuroImage. 2006;30:1121–1132. doi: 10.1016/j.neuroimage.2005.11.022. [DOI] [PubMed] [Google Scholar]
- Eyler LT, Chen CH, Panizzon MS, Fennema-Notestine C, Neale MC, Jak A, Jernigan TL, Fischl B, Franz CE, Lyons MJ, Grant M, Prom-Wormley E, Seidman LJ, Tsuang MT, Fiecas MJ, Dale AM, Kremen WS. A comparison of heritability maps of cortical surface area and thickness and the influence of adjustment for whole brain measures: a magnetic resonance imaging twin study. Twin Res Hum Genet. 2012;15:304–314. doi: 10.1017/thg.2012.3. [DOI] [PMC free article] [PubMed] [Google Scholar]
- Eyler LT, Vuoksimaa E, Panizzon MS, Fennema-Notestine C, Neale MC, Chen CH, Jak A, Franz CE, Lyons MJ, Thompson WK, Spoon KM, Fischl B, Dale AM, Kremen WS. Conceptual and data-based investigation of genetic influences and brain asymmetry: a twin study of multiple structural phenotypes. J Cogn Neurosci. 2014;26:1100–1117. doi: 10.1162/jocn_a_00531. [DOI] [PMC free article] [PubMed] [Google Scholar]
- Fedorov A, Beichel R, Kalpathy-Cramer J, Finet J, Fillion-Robin J-C, Pujol S, Bauer C, Jennings D, Fennessy F, Sonka M, Buatti J, Aylward SR, Miller JV, Pieper S, Kikinis R. 3D Slicer as an image computing platform for the Quantitative Imaging Network. Magn Reson Imaging. 2012;30:1323–1341. doi: 10.1016/j.mri.2012.05.001. [DOI] [PMC free article] [PubMed] [Google Scholar]
- Gao W, Gilmore JH, Giovanello KS, Smith JK, Shen D, Zhu H, Lin W. Temporal and spatial evolution of brain network topology during the first two years of life. PLoS One. 2011;6:e25278. doi: 10.1371/journal.pone.0025278. [DOI] [PMC free article] [PubMed] [Google Scholar]
- Gao W, Gilmore JH, Shen D, Smith JK, Zhu H, Lin W. The synchronization within and interaction between the default and dorsal attention networks in early infancy. Cereb Cortex. 2013;23:594–603. doi: 10.1093/cercor/bhs043. [DOI] [PMC free article] [PubMed] [Google Scholar]
- Gao W, Lin W, Chen Y, Gerig G, Smith JK, Jewells V, Gilmore JH. Temporal and spatial development of axonal maturation and myelination of white matter in the developing brain. Am J Neuroradiol. 2009a;30:290–296. doi: 10.3174/ajnr.A1363. [DOI] [PMC free article] [PubMed] [Google Scholar]
- Gao W, Zhu H, Giovanello KS, Smith JK, Shen D, Gilmore JH, Lin W. Evidence on the emergence of the brain’s default network from 2-week-old to 2-year-old healthy pediatric subjects. Proc Natl Acad Sci USA. 2009b;106:6790–6795. doi: 10.1073/pnas.0811221106. [DOI] [PMC free article] [PubMed] [Google Scholar]
- Geng X, Gouttard S, Sharma A, Gu H, Styner M, Lin W, Gerig G, Gilmore JH. Quantitative tract-based white matter development from birth to age 2 years. NeuroImage. 2012a;61:542–557. doi: 10.1016/j.neuroimage.2012.03.057. [DOI] [PMC free article] [PubMed] [Google Scholar]
- Geng X, Prom-Wormley EC, Perez J, Kubarych T, Styner M, Lin W, Neale MC, Gilmore JH. White matter heritability using diffusion tensor imaging in neonatal brains. Twin Res Hum Genet. 2012b;15:336–350. doi: 10.1017/thg.2012.14. [DOI] [PMC free article] [PubMed] [Google Scholar]
- Gilmore JH, Lin W, Corouge I, Vetsa YS, Smith JK, Kang C, Gu H, Hamer RM, Lieberman JA, Gerig G. Early postnatal development of corpus callosum and corticospinal white matter assessed with quantitative tractography. Am J Neuroradiol. 2007;28:1789–1795. doi: 10.3174/ajnr.A0751. [DOI] [PMC free article] [PubMed] [Google Scholar]
- Gilmore JH, Schmitt JE, Knickmeyer RC, Smith JK, Lin W, Styner M, Gerig G, Neale MC. Genetic and environmental contributions to neonatal brain structure: A twin study. Hum Brain Mapp. 2010;31:1174–1182. doi: 10.1002/hbm.20926. [DOI] [PMC free article] [PubMed] [Google Scholar]
- Glahn DC, Curran JE, Winkler AM, Carless MA, Kent JW, Jr, Charlesworth JC, Johnson MP, Goring HH, Cole SA, Dyer TD, Moses EK, Olvera RL, Kochunov P, Duggirala R, Fox PT, Almasy L, Blangero J. High dimensional endophenotype ranking in the search for major depression risk genes. Biol Psychiatry. 2012;71:6–14. doi: 10.1016/j.biopsych.2011.08.022. [DOI] [PMC free article] [PubMed] [Google Scholar]
- Goodlett CB, Fletcher PT, Gilmore JH, Gerig G. Group analysis of DTI fiber tract statistics with application to neurodevelopment. NeuroImage. 2009;45:S133–142. doi: 10.1016/j.neuroimage.2008.10.060. [DOI] [PMC free article] [PubMed] [Google Scholar]
- Huang H, Zhang J, Wakana S, Zhang W, Ren T, Richards LJ, Yarowsky P, Donohue P, Graham E, van Zijl PC, Mori S. White and gray matter development in human fetal, newborn and pediatric brains. NeuroImage. 2006;33:27–38. doi: 10.1016/j.neuroimage.2006.06.009. [DOI] [PubMed] [Google Scholar]
- Insel TR. Rethinking schizophrenia. Nature. 2010;468:187–193. doi: 10.1038/nature09552. [DOI] [PubMed] [Google Scholar]
- Jones DK, Christiansen KF, Chapman RJ, Aggleton JP. Distinct subdivisions of the cingulum bundle revealed by diffusion MRI fibre tracking: implications for neuropsychological investigations. Neuropsychologia. 2013;51:67–78. doi: 10.1016/j.neuropsychologia.2012.11.018. [DOI] [PMC free article] [PubMed] [Google Scholar]
- Kinney HC, Brody BA, Kloman AS, Gilles FH. Sequence of central nervous system myelination in human infancy. II Patterns of myelination in autopsied infants. J Neuropathol Exp Neurol. 1988;47:217–234. doi: 10.1097/00005072-198805000-00003. [DOI] [PubMed] [Google Scholar]
- Knickmeyer RC, Kang C, Woolson S, Smith JK, Hamer RM, Lin W, Gerig G, Styner M, Gilmore JH. Twin-singleton differences in neonatal brain structure. Twin Res Hum Genet. 2011;14:268–276. doi: 10.1375/twin.14.3.268. [DOI] [PMC free article] [PubMed] [Google Scholar]
- Kochunov P, Glahn DC, Lancaster JL, Winkler AM, Smith S, Thompson PM, Almasy L, Duggirala R, Fox PT, Blangero J. Genetics of microstructure of cerebral white matter using diffusion tensor imaging. NeuroImage. 2010;53:1109–1116. doi: 10.1016/j.neuroimage.2010.01.078. [DOI] [PMC free article] [PubMed] [Google Scholar]
- Kochunov P, Jahanshad N, Sprooten E, Nichols TE, Mandl RC, Almasy L, Booth T, Brouwer RM, Curran JE, de Zubicaray GI, Dimitrova R, Duggirala R, Fox PT, Elliot Hong L, Landman BA, Lemaitre H, Lopez LM, Martin NG, McMahon KL, Mitchell BD, Olvera RL, Peterson CP, Starr JM, Sussmann JE, Toga AW, Wardlaw JM, Wright MJ, Wright SN, Bastin ME, McIntosh AM, Boomsma DI, Kahn RS, den Braber A, de Geus EJ, Deary IJ, Hulshoff Pol HE, Williamson DE, Blangero J, van’t Ent D, Thompson PM, Glahn DC. Multi-site study of additive genetic effects on fractional anisotropy of cerebral white matter: Comparing meta and megaanalytical approaches for data pooling. NeuroImage. 2014;95:136–150. doi: 10.1016/j.neuroimage.2014.03.033. [DOI] [PMC free article] [PubMed] [Google Scholar]
- Kuswanto CN, Teh I, Lee TS, Sim K. Diffusion tensor imaging findings of white matter changes in first episode schizophrenia: a systematic review. Clin Psychopharmacol Neurosci. 2012;10:13–24. doi: 10.9758/cpn.2012.10.1.13. [DOI] [PMC free article] [PubMed] [Google Scholar]
- Lin W, Zhu Q, Gao W, Chen Y, Toh CH, Styner M, Gerig G, Smith JK, Biswal B, Gilmore JH. Functional connectivity MR imaging reveals cortical functional connectivity in the developing brain. Am J Neuroradiol. 2008;29:1883–1889. doi: 10.3174/ajnr.A1256. [DOI] [PMC free article] [PubMed] [Google Scholar]
- Looney CB, Smith JK, Merck LH, Wolfe HM, Chescheir NC, Hamer RM, Gilmore JH. Intracranial hemorrhage in asymptomatic neonates: prevalence on MR images and relationship to obstetric and neonatal risk factors. Radiology. 2007;242:535–541. doi: 10.1148/radiol.2422060133. [DOI] [PubMed] [Google Scholar]
- Lyall AE, Shi F, Geng X, Woolson S, Li G, Wang L, Hamer RM, Shen D, Gilmore JH. Dynamic development of regional cortical thickness and surface area in early childhood. Cereb Cortex. 2014 doi: 10.1093/cercor/bhu027. [DOI] [PMC free article] [PubMed] [Google Scholar]
- Medland SE, Jahanshad N, Neale BM, Thompson PM. Whole-genome analyses of whole-brain data: working within an expanded search space. Nat Neurosci. 2014;17:791–800. doi: 10.1038/nn.3718. [DOI] [PMC free article] [PubMed] [Google Scholar]
- Mueller S, Keeser D, Reiser MF, Teipel S, Meindl T. Functional and structural MR imaging in neuropsychiatric disorders, Part 1: imaging techniques and their application in mild cognitive impairment and Alzheimer disease. Am J Neuroradiol. 2012;33:1845–1850. doi: 10.3174/ajnr.A2799. [DOI] [PMC free article] [PubMed] [Google Scholar]
- Neale MC, Cardon LR. Methodology for Genetic Studies of Twins and Families, NATO ASI Series. Kluwer Academic Press; Dordrecht, The Netherlands: 1992. [Google Scholar]
- NIMH Workgroup. Transformative neurodevelopmental research in mental illness. 2008 http://www.nimh.nih.gov/about/advisory-boards-and-groups/namhc/neurodevelopment_workgroup_report.pdf.
- Nortje G, Stein DJ, Radua J, Mataix-Cols D, Horn N. Systematic review and voxel-based meta-analysis of diffusion tensor imaging studies in bipolar disorder. J Affect Disord. 2013;150:192–200. doi: 10.1016/j.jad.2013.05.034. [DOI] [PubMed] [Google Scholar]
- Pfefferbaum A, Sullivan EV, Carmelli D. Genetic regulation of regional microstructure of the corpus callosum in late life. Neuroreport. 2001;12:1677–1681. doi: 10.1097/00001756-200106130-00032. [DOI] [PubMed] [Google Scholar]
- Oguz I, Farzinfar M, Matsui J, Budin F, Liu Z, Gerig G, Johnson HJ, Styner M. DTIPrep: quality control of diffusion-weighted images. Front Neuroinform. 2014;30:4. doi: 10.3389/fninf.2014.00004. [DOI] [PMC free article] [PubMed] [Google Scholar]
- Schmahmann JD, Pandya DN. Fiber pathways of the brain. Oxford University Press; New York: 2006. [Google Scholar]
- Smith SM. Fast and robust automated brain extraction. Hum Brain Mapp. 2002;17:143–155. doi: 10.1002/hbm.10062. [DOI] [PMC free article] [PubMed] [Google Scholar]
- Song JW, Mitchell PD, Kolasinski J, Ellen Grant P, Galaburda AM, Takahashi E. Asymmetry of white matter pathways in developing human brains. Cereb Cortex. 2014 doi: 10.1093/cercor/bhu084. [DOI] [PMC free article] [PubMed] [Google Scholar]
- Verde AR, Budin F, Berger JB, Gupta A, Farzinfar M, Kaiser A, Ahn M, Johnson H, Matsui J, Hazlett HC, Sharma A, Goodlett C, Shi Y, Gouttard S, Vachet C, Piven J, Zhu H, Gerig G, Styner M. UNC-Utah NA-MIC framework for DTI fiber tract analysis. Front Neuroinform. 2014;7:51. doi: 10.3389/fninf.2013.00051. [DOI] [PMC free article] [PubMed] [Google Scholar]
- Voineskos AN. Genetic underpinnings of white matter ‘connectivity’: Heritability, risk, and heterogeneity in schizophrenia. Schizophr Res. 2014 doi: 10.1016/j.schres.2014.03.034. [DOI] [PubMed] [Google Scholar]
- Voineskos AN, Felsky D, Kovacevic N, Tiwari AK, Zai C, Chakravarty MM, Lobaugh NJ, Shenton ME, Rajji TK, Miranda D, Pollock BG, Mulsant BH, McIntosh AR, Kennedy JL. Oligodendrocyte genes, white matter tract integrity, and cognition in schizophrenia. Cereb Cortex. 2013;23:2044–2057. doi: 10.1093/cercor/bhs188. [DOI] [PMC free article] [PubMed] [Google Scholar]
- Welker KM, Patton A. Assessment of normal myelination with magnetic resonance imaging. Semin Neurol. 2012;32:15–28. doi: 10.1055/s-0032-1306382. [DOI] [PubMed] [Google Scholar]
- Yuan Y, Gilmore JH, Geng XJ, Styner M, Chen KH, Wang JL, Zhu HT. FMEM: Functional mixed effects modeling for the analysis of longitudinal white matter Tract data. NeuroImage. 2014;84:753–764. doi: 10.1016/j.neuroimage.2013.09.020. [DOI] [PMC free article] [PubMed] [Google Scholar]
- Zhu HT, Kong L, Li R, Styner M, Gerig G, Lin W, Gilmore JH. FADTTS: Functional Analysis of Diffusion Tensor Tract Statistics. NeuroImage. 2011;56:1412–1425. doi: 10.1016/j.neuroimage.2011.01.075. [DOI] [PMC free article] [PubMed] [Google Scholar]
- Zuliani R, Moorhead TW, Bastin ME, Johnstone EC, Lawrie SM, Brambilla P, O’Donovan MC, Owen MJ, Hall J, McIntosh AM. Genetic variants in the ErbB4 gene are associated with white matter integrity. Psychiatry Res. 2011;191:133–137. doi: 10.1016/j.pscychresns.2010.11.001. [DOI] [PMC free article] [PubMed] [Google Scholar]
Associated Data
This section collects any data citations, data availability statements, or supplementary materials included in this article.