Abstract
Chronic hypertension alters cerebral vascular morphology, cerebral blood flow (CBF), cerebrovascular reactivity, increasing susceptibility to neurological disorders. This study evaluated: i) the lumen diameters of major cerebral and downstream arteries using magnetic resonance angiography, and ii) basal CBF, and iii) cerebrovascular reactivity to hypercapnia of multiple brain regions using arterial-spin-labeling technique in spontaneously hypertensive rats (SHR) at different stages. Comparisons were made with age-matched normotensive Wistar Kyoto (WKY) rats. In 10-week SHR, lumen diameter started to reduce, basal CBF, and hypercapnic CBF response were higher from elevated arterial blood pressure, but there was no evidence of stenosis, compared to age-matched WKY. In 20-week SHR, lumen diameter remained reduced, CBF returned toward normal from vasoconstriction, hypercapnic CBF response reversed and became smaller, but without apparent stenosis. In 40-week SHR, lumen diameter remained reduced and basal CBF further decreased, resulting in larger differences compared to WKY. There was significant stenosis in main supplying cerebral vessels. Hypercapnic CBF response further decreased, with some animals showing negative hypercapnic CBF responses in some brain regions, indicative of compromised cerebrovascular reserve. The territory with negative hypercapnia CBF responses corresponded with the severity of stenosis in arteries that supplied those territories. We also found enlargement of downstream vessels and formation of collateral vessels as compensatory responses to vasoconstriction upstream vessels. The middle cerebral and azygos arteries were amongst the most susceptible to hypertension-induced changes. Multimodal MRI provides clinically relevant data that might be useful to characterize disease pathogenesis, stage disease progression, and monitor treatment effects in hypertension.
Keywords: MRI, MRA, CBF, cerebral vascular resistance, cerebrovascular reserve, hypercapnia, spontaneous hypertensive rat, Wistar Kyoto rats
INTRODUCTION
Hypertension is a major health problem, afflicting a quarter of the general population and more than half of the elderly population in the United States (Pedelty and Gorelick, 2008). Chronic hypertension alters cerebral vascular morphology, cerebral blood flow (CBF) and vascular reactivity, which could lead to stenosis, chronic hypoperfusion and reduced cerebrovascular reserve, increasing susceptibility to brain disorders, such as ischemic stroke (Dahlof, 2007) and cognitive decline (Sierra et al., 2012), among others. Improved understanding of the effects of hypertension on cerebrovascular structure and function is important for proper characterization and staging of the disease, as well as design and evaluation of treatment options.
Spontaneous hypertensive rat (SHR) is an established animal model of hypertension. A plethora of studies have investigated changes in cerebral arterial lumen diameter, basal CBF and vascular reactivity using various in vivo and ex vitro techniques. Basal CBF has been reported to be similar (Wei et al., 1992; Zhou et al., 2009), lower (Grabowski et al., 1993; Lee et al., 2011) or higher (Heinert et al., 1998) than normotensive animals. CBF responses to hypercapnic (i.e., 5% CO2) challenge have also been found to increase (Kim et al., 2014), reduce (Leoni et al., 2011), or remain unchanged (Yamori and Horie, 1977) at similar stages of hypertension. The effects of hypertension on lumen diameters also varied substantially across different studies (Baumbach et al., 1988; Pires et al., 2011; Rigsby et al., 2011; Rigsby et al., 2007). These inconsistencies could arise from differences in the hypertensive stage, measurement techniques, brain regions analyzed, anesthetics, among others.
MRI offers the means to image multiple parameters of the cerebral circulations in a non-invasive and longitudinal fashion in a single setting. Magnetic resonance angiography (MRA) (Bradley, 1992), in which contrast is based on flowing water spins with or without any contrast agent, can be used to image vascular morphology and detect stenosis of all major arteries. Arterial spin labeling (ASL) (Detre et al., 1992), in which in-flowing blood water can be magnetically tagged without the need for an exogenous contrast agent, can be used to measure basal CBF and stimulus-evoked CBF changes. With a few exceptions (Danker and Duong, 2007; Kim et al., 2014; Leoni et al., 2011), multimodal MRI applications to study SHR animals are sparse.
The goal of this study was to utilize multimodal MRI to evaluate: i) the lumen diameters of major and downstream cerebral arteries using MRA, ii) basal CBF, and iii) CBF response to hypercapnia using the continuous ASL technique in an established rat model of hypertension (SHR) at different stages of the disease progression. Multiple cerebral arteries and their perfusion territories were analyzed. Comparisons were made with age-matched normotensive Wistar Kyoto (WKY) rats. Comparisons amongst MRA, CBF and cerebrovascular reactivity offered important insights into the effects of hypertension on cerebrovascular structure and function in specific perfusion territories. Our central hypotheses are: (I) Multi-parametric MRI can detect regional differences in vascular morphology, CBF, and cerebrovascular reactivity in spontaneous hypertensive rats at early stage of hypertension and these parameters progressively with duration of hypertension. (II) Abnormal negative hypercapnia-induced CBF responses are associated with stenosis of the upstream supplying arteries and enlargement of downstream vessels.
MATERIALS AND METHODS
All animal procedures were approved by the Institutional Animal Care and Use Committee of the University of Texas Health Science Center San Antonio and were consistent with the ARRIVE guidelines. Male SHR and WKY rats (Charles River) were studied with IACUC approval in six groups: i) 10-week (N=6, 8~10 weeks), ii) 20-week (N=6, 18~20 weeks), iii) 40-week (N=16, 38~40 weeks) old SHR rats, and the corresponding three age-matched controls: iv) 10 week (N=6, 8~10 weeks), v) 20-week (N=8, 18~20 weeks), vi) 40-week (N=10, 38–40 weeks) WKY rats. For convenience, the 10-, 20-, and 40-week SHR was denoted as early-, middle- and late-stage hypertension, respectively. This is a cross-sectional study where the three groups were of different animals.
Physiology
Body weight, heart rate and tail mean-arterial-blood pressure (MABP) were measured at least one week after arriving to our laboratory and 1–3 days before each MRI section. MABP and heart rate were measured in awake conditions via a tail cuff (CODA, Kent Scientific) after acclimating to the restraining device.
Animal preparation
Rats were inducted with 5% isoflurane and maintained with 1.2~1.5% isoflurane under spontaneous respiration during MRI. Animals were secured in a stereotaxic head frame by an ear- and bite-bar. Rectal temperature (37±1°C), arterial oxygen saturation (>90%), heart rate, and respiration rate were maintained within normal physiological ranges unless perturbed by hypercapnia. Hypercapnic challenge used 4 mins air, 3 mins 5% CO2 in air, and 3 mins air. Heart rate was stable throughout the MRI studies. Under identical preparations, end-tidal CO2, heart rate, and MABP have been previously shown to be very stable under isoflurane during MRI of similar duration (Sicard and Duong, 2005).
MR
MRI was performed on an 11.7-Tesla Bruker Biospec scanner with a surface coil for brain imaging and a neck coil (Duong et al., 2000) for arterial-spin labeling. T2-weighted MRI employed a fast spin-echo sequence with 3s repetition time (TR), 90ms effective echo time (TE), 4 echo-train length, 25.6×25.6mm2 field of view (FOV), 96×96 matrix, eight 1.5-mm slices, and 8 averages (Shen et al., 2003). 3D MRA employed 3D fast-low-angle-shot (FLASH) sequence with TE=2ms, TR=3s, 25.6×25.6×25.6mm3 FOV, 256×256×256 matrix. CBF employed continuous ASL (Shen et al., 2003) with four-shot, gradient-echo planar imaging with 25.6×25.6cm2 FOV, 96×96 matrix, eight 1.5-mm slices, TE=12ms, TR=3s per shot, and 60 repetitions. The labeling duration was 2.9 s, post labeling delay was 250 ms, and labeling efficiency was 85%.
Data analysis
Image analysis employed codes written in Matlab (MathWorks Inc). CBF in ml/100g/min and hypercapnia-induced CBF percent changes were calculated using a fixed T1 value of 1.6s (Duong et al., 2000). CBF % change maps were calculated by modeling the time course to the input hypercapnic paradigm using Stimulate Software.
MRA image was derived using maximum intensity projection. To quantitatively determine lumen diameter, the vessel was automatically detected using an edge-detection technique as previously described (Muir and Duong, 2011). Radial projections perpendicular to the vessel were obtained. The lumen diameter was taken as the full-width at half-height of the vessel profile for the internal carotid artery (ICA), proximal segment of anterior cerebral artery (ACA), middle cerebral artery (MCA), posterior cerebral artery (PCA), basilar artery (BA), azygos artery (AA) and the first pial branch of MCA. For incidence calculation, stenosis was scored as at least 50% narrowing of the artery in all 3 projections (Samuels et al., 2000) for the ICA, ACA, MCA, PCA, BA, and AA. Hypercapnia-induced CBF percent changes from different ROIs were tabulated. The hypercapnia-induced CBF percent changes from different territory of ACA, MCA and BA were tabulated different graded level stenosis from corresponding artery.
All analysis was done in a non-blinded manner. Two-way ANOVAs was used for comparison of variables among groups and followed by a post-hoc Bonferroni test. Pearson’s correlation coefficient was used for investigating the relationship between hypercapnia-induced CBF percent changes and degree of stenosis. P<0.05 was accepted as statistically significant. Statistical analysis was performed using SPSS statistical software (version 20.0; SPSS Inc., Chicago, IL, USA).
Results
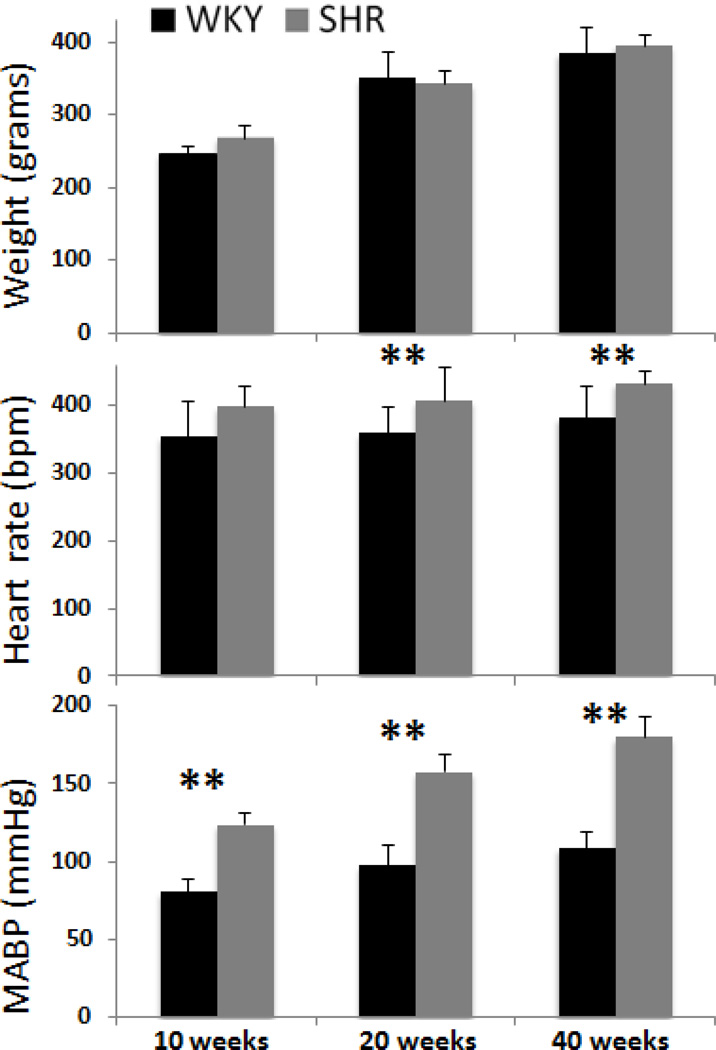
WKY body weight increased significantly with age, heart rate did not change with age, and MABP trended positively with age (Figure 1). Body weight was not statistically different between SHR and WKY at all stages (P > 0.05). Differences in heart rate and MABP between SHR and age-matched WKY were present at 10 weeks, and grew progressively larger with age.
Figure 1.
Body weights, heart rates in beat per min (bpm), MABP in mmHg of WKY and SHR. Error bars are ±SEM for N=6~16 for each group. *, $, ¥ p<.05, and **, $$ p<0.01.
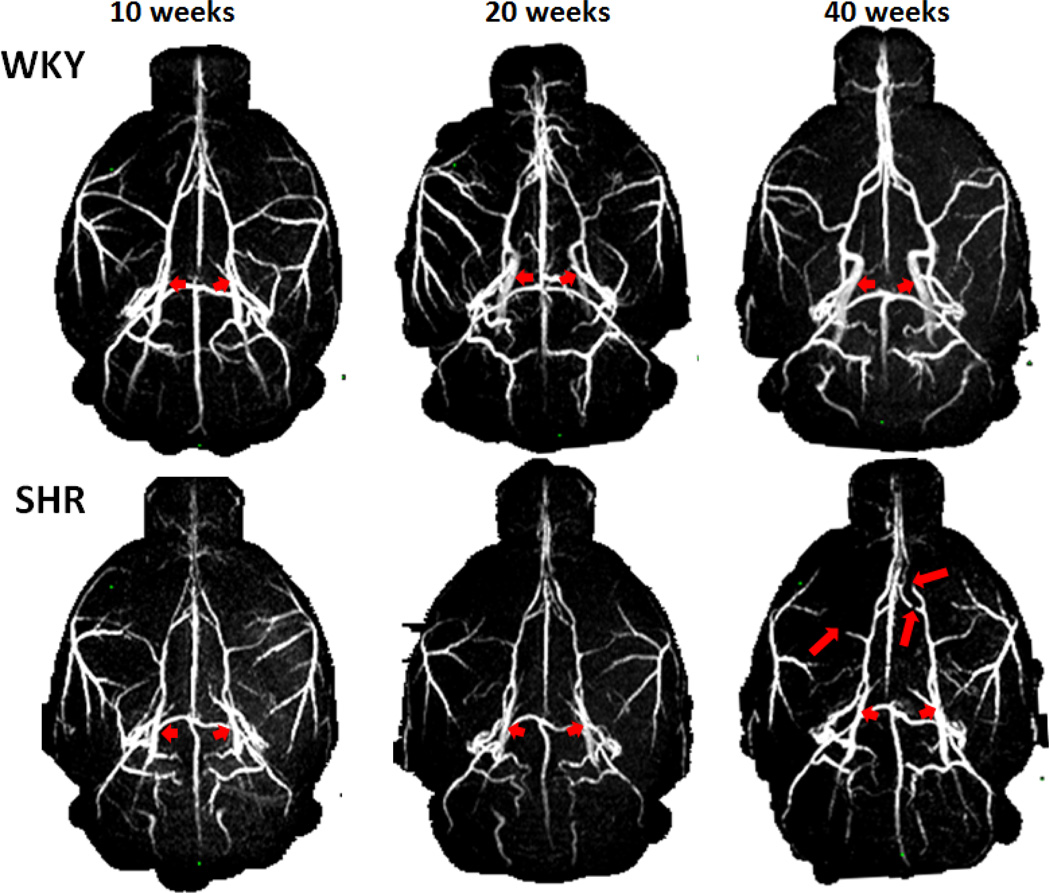
Figure 2 shows the representative MRA of the WKY and SHR animals at 10-, 20- and 40-week. In 10 and 20 weeks, WKY showed increased lumen diameter with age, whereas SHR showed no change with age, indicative of lumen diameter narrowing in the most of the main intracranial arteries in SHR. An example is the ICA (short arrows), which increased with age in WKY but not in SHR. At 40 weeks, some of SHR showed stenosis of the arteries (long arrows), in addition to the narrowed lumen diameter.
Figure 2.
MRA of WKY and SHR. Short arrows indicate the ICA, which increased with age in WKY but not in SHR. Long arrows indicate vessels with stenosis, most apparent at 40 weeks SHR.
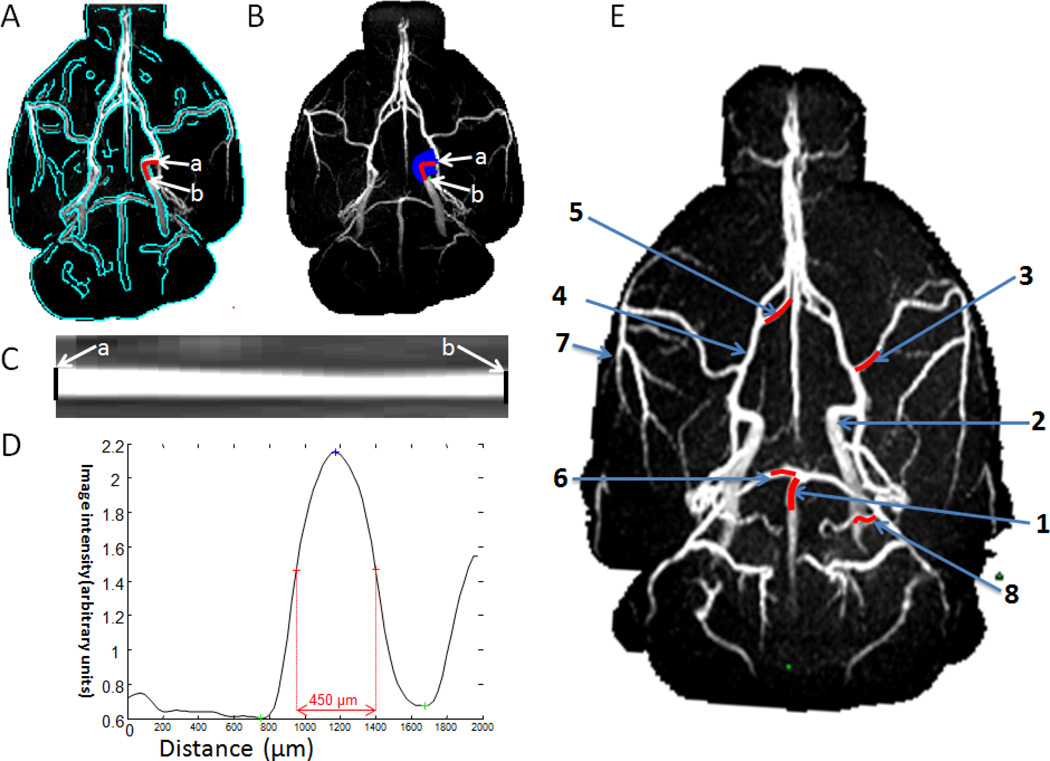
For quantitative analysis of the lumen diameters, projection profiles were obtained for vessels and the diameters were taken as the full width at half maximum of the vessel profiles (Figure 3). The 2 mm segments (red lines) along the artery indicated the lengths over which the diameter was measured for the 1: basilar artery (BA), 2: internal carotid artery (ICA), 3: middle cerebral artery (MCA), 4: anterior cerebral artery (ACA), 5: azygos artery, 6: posterior cerebral artery (PCA), 7: pial branch of MCA; 8: pial branch of PCA. These arteries were identified based on (Lee, 1995).
Figure 3.
Automated determination of MRA vessel lumen diameter. (A) The vessel was segmented by using edge-detection technique (green trace). (B) Radial projections perpendicular to the vessel boundary were obtained. The lumen diameter of the ICA (an example) was quantified from point a to point b. The vessel was displayed in (C) image and (D) intensity profile format were flattened. The lumen diameter was defined as the full-width at half-height. (E) The 2 mm segments (red lines) along the artery indicated the lengths over which the diameter was measured. 1: basilar artery (BA), 2: internal carotid artery (ICA), 3: middle cerebral artery (MCA), 4: anterior cerebral artery (ACA), 5: azygos artery, 6: posterior cerebral artery (PCA), 7: pial branch of MCA; 8: pial branch of PCA.
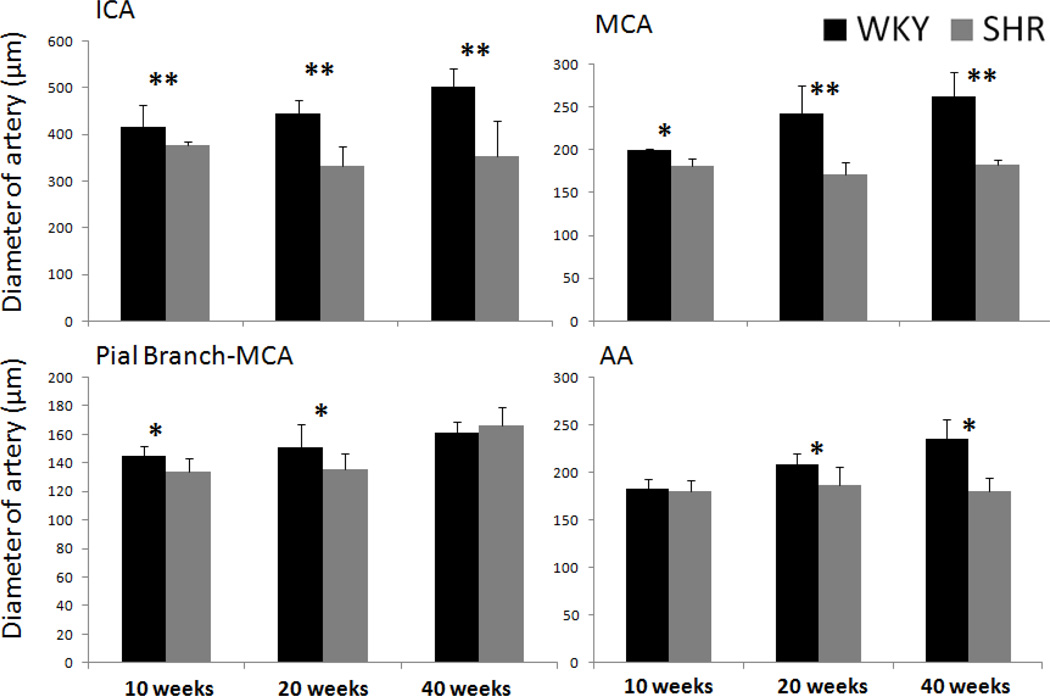
The group-averaged arterial lumen diameters of MCA, ICA, pial branch of MCA and AA of the WKY and SHR are shown in Figure 4. Lumen diameters already differed between SHR and WKY at 10 weeks. WKY lumen diameters increased with age, whereas SHR lumen diameter did not. The differences in lumen diameters between SHR and WKY grew significantly larger. BA and PCA exhibited similar changes (data not shown). Although 20-week rats were already mature, their weights still increased from 20 week to 40 weeks and thus it is conceivable that the arterial lumen diameters would increase slightly from 20 to 40 weeks, as observed.
Figure 4.
Group-averaged arterial diameters of the WKY and SHR animals of the whole brain, MCA, the first branch of MCA and azygos artery. Error bars are ±SEM for N=6~16 for each group. *, $, ¥ p<.05, and ** p<0.01.
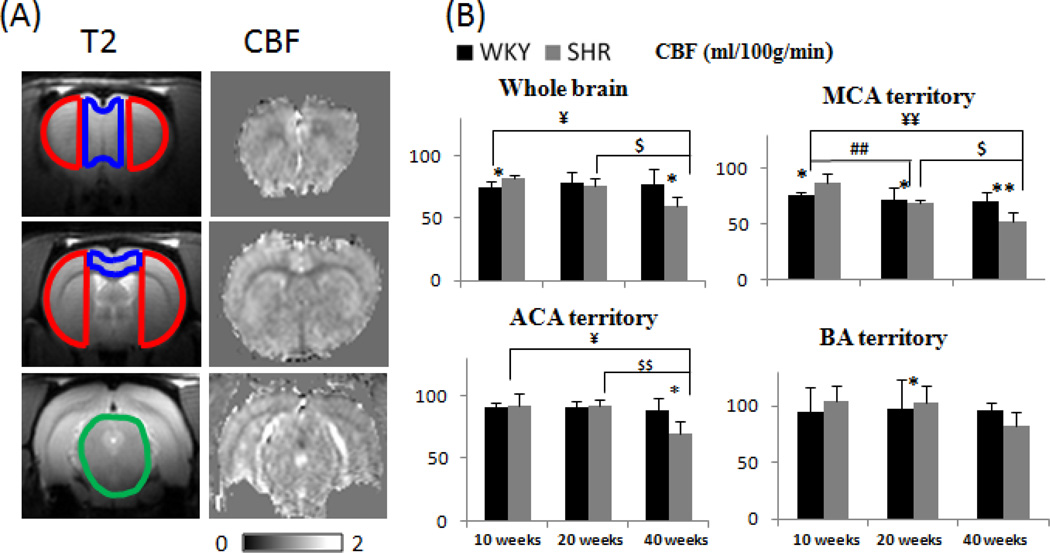
T2-weighted images along with three overlaid ROIs of the MCA, ACA and BA territories, and representative CBF images from a 40-week WKY animal are shown in Figure 5A. CBF images showed the heterogeneous contrasts. Figure 5B shows the group basal CBF values in the whole brain, MCA, ACA and BA territories. WKY CBF generally did not change significantly with age in the territories perfused by the MCA, ACA and BA. By contrast, SHR CBF started out higher than WKY CBF in early stage. In middle stage, the patterns started to reverse and, by late stage, SHR CBF was significantly lower than WKY CBF.
Figure 5.
(A) Anatomical images of a WKY rat with ROI overlaid of the BA territory (green), MCA territory (red), ACA territory (green) and basal CBF images for 3 image slices of the 40-week WKY. Scale bar: 0–200ml/100/min. (B) Group-averaged CBF of the whole brain, MCA, first branch of the MCA and AA in WKY and SHR animals at different time points. Error bars are ±SEM for N=6~16 for each group. *, $, ¥ p<.05, and **, $$ p<0.01.
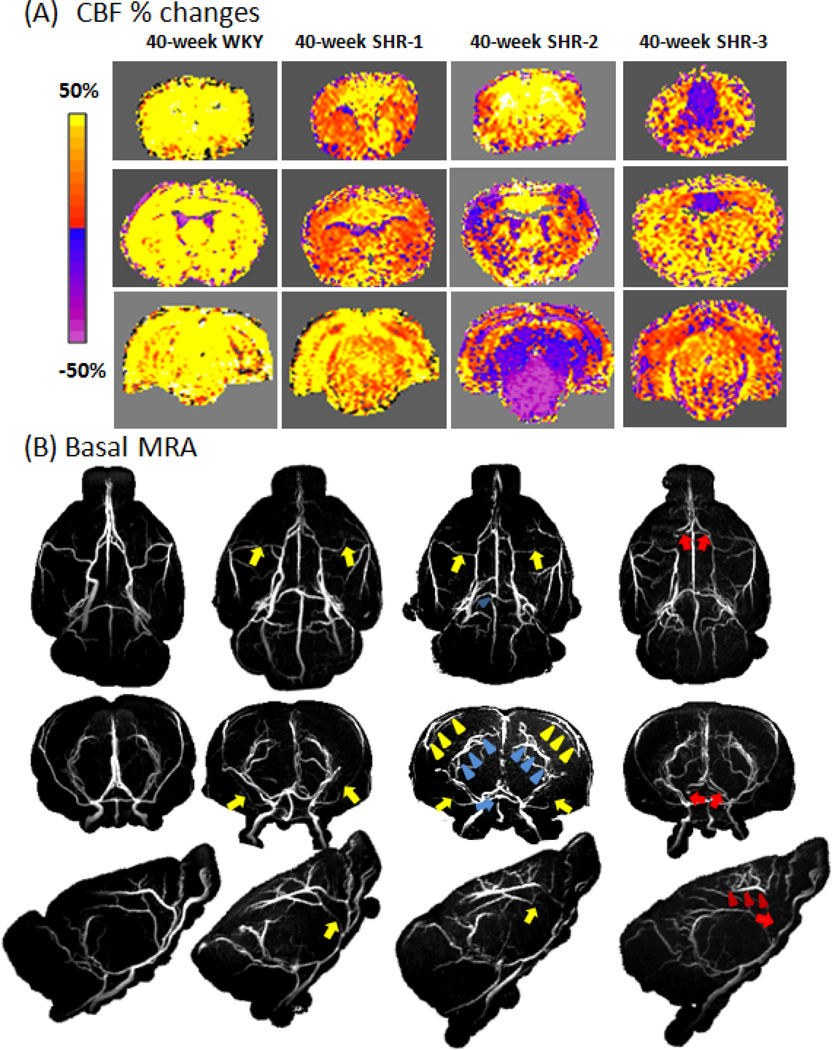
Representative hypercapnia-induced CBF change maps and the MRA for the corresponding animals at 40 weeks are shown in Figure 6. For WKY, all animals showed positive CBF percent changes and normal MRA. Representative data from one WKY animal are displayed. For SHR, CBF percent changes were variable and representative data from three different SHR rats are displayed. SHR-1 showed positive CBF % changes albeit lower compared to WKY and its MRA showed mild narrowing of major arteries and mild stenosis in the MCA (yellow arrows). SHR-2 showed positive CBF changes in the ACA territory, but negative CBF changes in the BA territory and part of the MCA territory. Its MRA showed marked stenosis in the BA (blue arrow), enlarged pial arterioles of PCA (blue arrowheads), partial stenosis in the MCA (yellow arrow), and enlarged pial arterioles of MCA (yellow arrowheads). SHR-3 showed positive CBF response in MCA and BA territory but negative CBF response at ACA territory. Its MRA showed marked stenosis in the ACA (red arrows) and enlarged pial arterioles of ACA (red arrowheads). These MRA data showed the upstream supplying arteries were abnormal, consistent of the patterns of negative hypercapnic CBF responses in those perfused territories.
Figure 6.
(A) CBF percent-change maps responding to 5% CO2 for a WKY and three different SHR all at 40 weeks. The overlaid ROIs are the BA territory (green), MCA territory (red), ACA territory (green). Scale bar: −80% to 80%. (B) The corresponding MRA from WKY and SHR. Stenosis was found in the ACA (red arrows), MCA (yellow arrows) and BA (blue arrows). Enhanced MRA signal in the pial arterioles of ACA (red arrowheads), MCA (yellow arrowheads) and PCA (blue arrowheads) was observed.
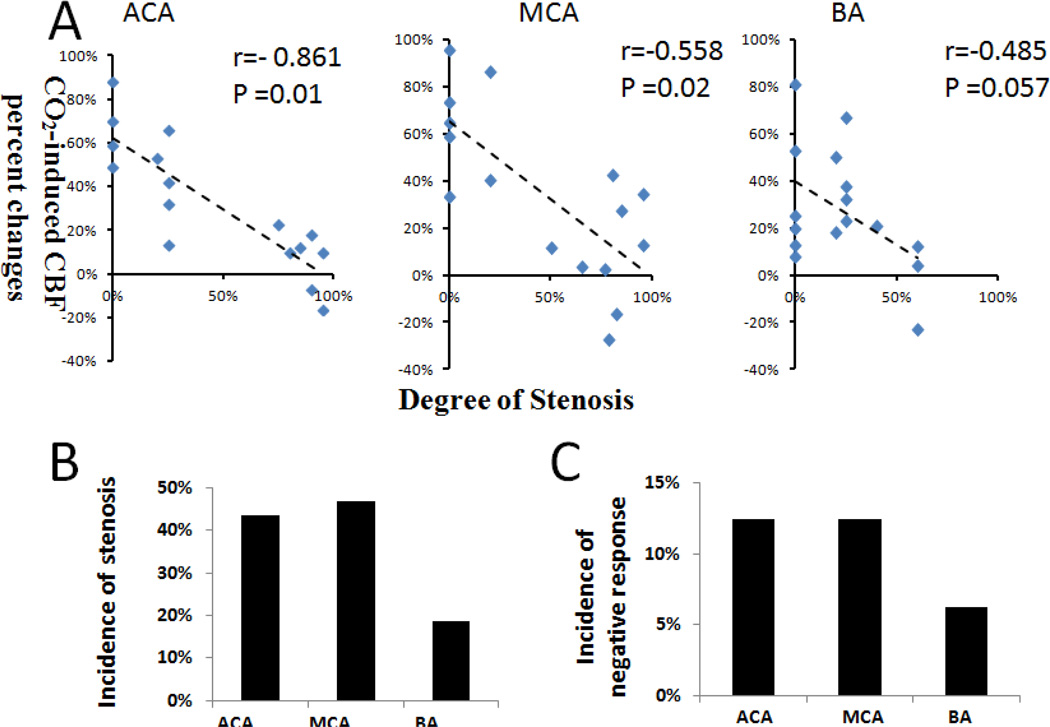
Figure 7A showed the quantitative correlation of the hypercapnic CBF responses and degree of stenosis for the in ACA, MCA BA, and their perfusion territories for the 40-week SHR rats. These data indicated that the “negative” hypercapnic CBF responses were correlated with the degree of stenosis. The incidences of negative hypercapnic CBF response in ACA, MCA and BA territory of the 40 weeks SHR were 12.5%, 12.5%, 6.25% (n=16), respectively (Figure 7B). The incidences of stenosis in the AA, MCA, and BA of 40-week SHR were 44%, 47%, and 19%, respectively. The incidences of negative CBF response were lower than but paralleled with those of stenosis. In addition, we also measured the incidences of stenosis in the of ACA, ICA, PCA to be 34.4%, 3.1%, and 6.25% (n=16), respectively.
Figure 7.
(A) Hypercapnic CBF responses versus degree of stenosis for the ACA, MCA BA for 40-week SHR (n = 16). The hypercapnic CBF responses were obtained from the corresponding perfusion territories of these vessels. The correlation coefficients were −0.718, −0.417 and −0.485 (p value = 0.02, 0.11, and 0.057), respectively. (B) The incidence of negative hypercapnic CBF response and the incidence of stenosis in the ACA, MCA and BA of 40-week SHR (n = 16).
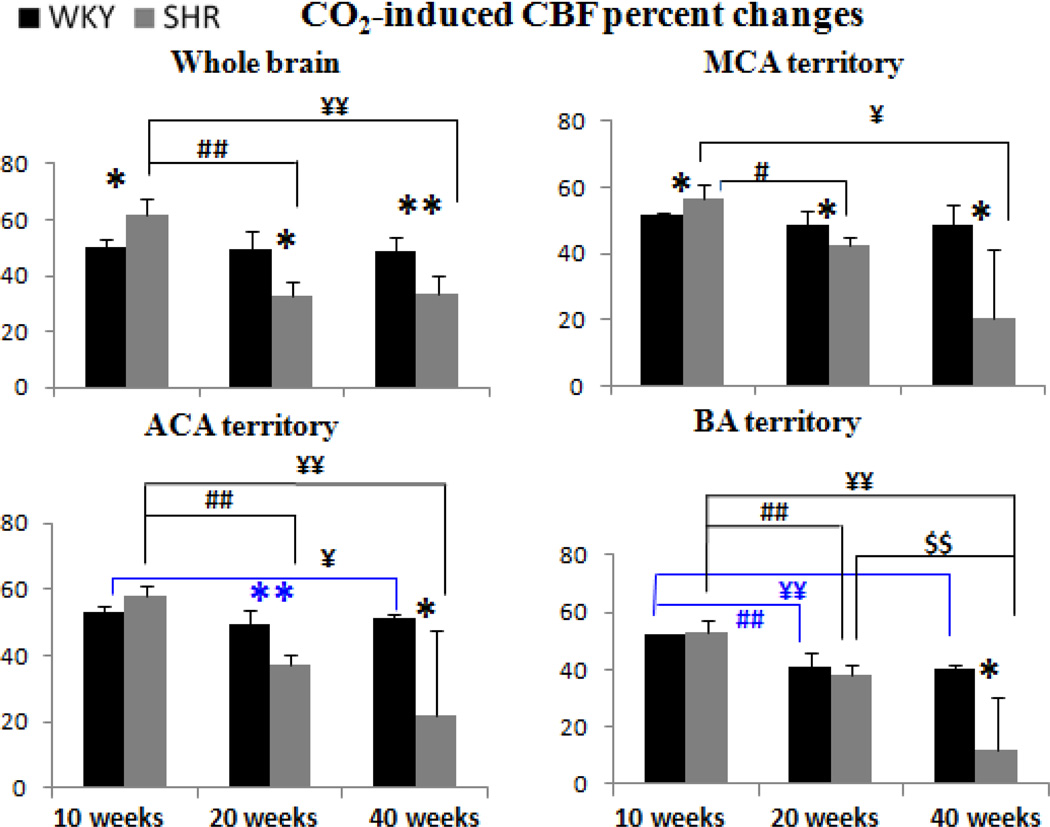
Figure 8 shows group CBF responses to hypercapnia. CBF responses of WKY did not change significantly in the whole brain and the MCA territory with age, but decreased slightly in the ACA and BA territory. By contrast, hypercapnic CBF responses of SHR started out higher than those of WKY and decreased progressively with age, ending lower than those of WKY.
Figure 8.
Group-averaged hypercapnia-induced CBF changes of the whole brain, MCA, first branch of the MCA and AA in WKY and SHR animals. Error bars are ±SEM for N=6~16 for each group. *, $, ¥ p<.05, and **, $$ p<0.01.
DISCUSSION
This study evaluated the lumen diameters of major cerebral arteries, basal CBF and cerebrovascular reactivity in SHR and age-matched WKY at multiple time points. The novel findings of this study are: (I) Multi-parametric MRI showed regional differences in vascular morphology, hemodynamics, and cerebrovascular reactivity in spontaneous hypertensive rats at early stage of hypertension and these parameters progressively with duration of hypertension. (II) Paradoxical negative hypercapnia-induced CBF responses, indicative of poor cerebrovascular reserve, were observed in some territories. (III) These regions of negative hypercapnia-induced CBF responses were associated with stenosis of the upstream supplying arteries and enlargement of downstream vessels in some animals at late stage hypertension. (IV) The middle cerebral artery and the azygos artery were most susceptible to hypertension-induced changes.
SHR developed mild hypertension in the early stage, moderate hypertension in the middle stage, and severe hypertension in the late stage, consistent with previous studies (Mulvany et al., 1980; Zicha and Kunes, 1999). Previous studies have shown that SHR blood pressure rose between 3 and 10 weeks and reach sustained hypertension at 20 weeks (Mulvany et al., 1980; Zicha and Kunes, 1999). Organ damage started around 40 weeks (Zicha and Kunes, 1999). There were no apparent cerebral ischemic and hemorrhagic lesions in any of the animals based on T2 and diffusion MRI (data not shown). Danker and Duong previously reported CBF of a number of known anatomical structures in SHR rats without considering the sources of supply arteries (i.e., MRA and arterial diameters and other measurements were not made) (Danker and Duong, 2007). This study focused the relation between supplying arteries and the brain regions that these supplying arteries feed. Thus, our ROIs for CBF analysis were chosen based on known sets of supply arteries for quantitative correlation. We did not analyze CBF of different brain structures to avoid distraction from the main points of the paper.
Effects of duration of hypertension
In early-stage (10 weeks) hypertension, lumen diameter started to reduce, basal CBF and hypercapnic CBF response were higher compared to age-matched WKY. Published reports varied significantly at this stage. At this stage, there are already adaptive myogenic response (Izzard et al., 1996) to protect downstream microvessels from increased blood pressure (Laurent et al., 2005). Such myogenic response has been demonstrated in isolated arteries where vessels constrict in a response to increased pressure and dilate in response to decreased pressure (Cipolla et al., 2009). Failure of this protective vasoconstriction could lead to blood-brain-barrier disruption, cerebral edema and cerebrovascular pathology (Laurent et al., 2005). Thus, a reduced lumen diameter in living condition at this stage is expected. Consistent with our study, some studies reported reduced lumen diameters in the MCA (Pires et al., 2011; Rigsby et al., 2007) and pial artery (Baumbach et al., 1988) at similar age group.
The slightly higher basal CBF and the higher hypercapnic CBF response are likely due to the increased blood pressure at this stage. Leoni et al. found that 10–12 weeks SHR had a higher basal CBF and lower hypercapnia-induced CBF response than WKY (under 2% isoflurane and graded (1.5–10%) CO2 stimulation for 5 mins 20s) using the ASL-MRI technique (Leoni et al., 2011), whereas Kim et al. found SHR had a lower CBF and higher hypercapnia-induced CBF response compared than WKY at 12–16 weeks SHR (under 1% isoflurane and 4% CO2 stimulation for 30 s) using the same technique (Kim et al., 2014). Our results agreed with some aspects and disagreed with some aspects of both of these studies, which could be attributed in part to different isoflurane or CO2 inhalation duration. Our data were acquired under 1.2–1.5% isoflurane and 3 mins CO2 stimulation. Isoflurane concentration, being a strong vasodilator, could have effects on cerebrovascular reactivity. The duration and concentration of CO2 stimulation could also have the different vasodilation effects.
Abnormal lumen diameters suggest remodeling of vessel (Bakker et al., 2002). There were however no stenosis at this stage. It has been suggested that appropriate antihypertensive treatment applied during this period would not only prevent the MABP increase but also abolish development of vascular remodeling (Harrap et al., 1990).
In middle-stage (20 weeks) hypertension, lumen diameter reduced further, CBF returned toward normal as a result of adaptive response, hypercapnia-induced CBF response reversed and became smaller, but without apparent stenosis. Reduced lumen diameter of the MCA has been reported in 18-week SHR (Rigsby et al., 2011; Zanchi et al., 1997). Consistent with our study, Wei et al. found 24–28 weeks SHR had the similar basal CBF as WKY using PET (Wei et al., 1992), and Yamori at al. found 20-week SHR had the similar basal CBF and hypercapnia-induced CBF response as WKY using hydrogen-clearance method (Yamori and Horie, 1977). Our results contradicted those of Heinert at al. who reported that CBF in 24-week SHR was higher than in WKY rats (Heinert et al., 1998), and hypercapnia-induced CBF response was not different using hydrogen-clearance method (Hom et al., 2007). In human, the average numbers of stems and branches of the arteries in young, but not old, hypertensive patients have been reported to be significantly less than those of age-match healthy subjects (Kang et al., 2009). Although our study and this study measured different aspects of hypertension, our finding is consistent in some aspects (i.e., CBF and lumen diameter) of this study.
Hypertrophy remodeling, in which smooth muscle cells grow inward encroaching into the lumen of the artery (van Gorp et al., 2000), has been suggested to occur at this stage. Hypertrophy, an adaptive response to reduce stress on the vessel wall, has negative consequences because it reduces the vessel lumen and increases vascular resistance, resulting in a greater propensity for vascular insufficiency. Moreover, hypertrophy also makes vessels more resistant to dilatation. If hypertension continues to develop, it will continue the vicious circle of increasing lumen pressure and progressive hypertrophy, which is bounded to result in eventual imbalance. It has been suggested that antihypertensive therapy at this stage can only lower BP, but has no effect on the regressing structural abnormalities of arteries (Gohlke et al., 1992).
In late-stage (40 weeks) hypertension, lumen diameter reduced further, and CBF and hypercapnia-induced CBF response further decreased, some of them with paradoxically negative hypercapnia-induced CBF response detected in some brain regions and there was significant stenosis. Narrowing of major cerebral arteries (i.e., MCA) in the early stage chronic hypertension was to protect downstream vessels from the elevated pressure (Laurent et al., 2005), but that unfortunately led to eventual stenosis of the arteries, resulting in decreased downstream blood supply. To compensate for the reduced blood supplies, collaterals were developed in the downstream arterioles (i.e., enhanced MRA signals in pial surface arterioles of MCA and PCA the 40-week SHR-2, Figure 6B, yellow arrowheads).
It is worth noting that the diameter of the 40-week SHR was similar to 40-week WKY for the pial branch-MCA (Figure 4), whereas this was not the case for the MCA, ACA and AA. This is because the stenosis of the main supply vessels MCA, ACA and AA in hypertension caused the downstream branch-MCA to enlarge at 40-week SHR, as indicated by the relatively large lumen diameter of the brain-MCA of the 40-week SHR compared to other main arteries (Figure 4). Stenosis of the main supplying arteries also caused enlargement of downstream pial vessels as indicated by yellow arrowheads in Figure 6B. We believe this is one of the compensatory responses.
Upon hypercapnic challenges, the stenosis vessels and new collaterals however could not dilate as readily as normal vessels, resulting in either reduced or negative hypercapnic CBF responses, depending on the severity of stenosis and possibly the maturity of these new collaterals. The imbalance brought about by hypercapnic perturbation resulted in an apparent “vascular steal” phenomenon (Sobczyk et al., 2014). For example, reduced hypercapnic CBF responses were observed in the MCA territory of the SHR-1, corresponding to the mild narrowing of the MCA (Figure 6B). By contrast, negative hypercapnic CBF responses were observed in MCA of SHR-2, corresponding to more severe stenosis of the MCA. SHR-2 also showed enhanced MRA signals in pial surface arterioles of MCA. Quantitative correlation of the hypercapnic CBF responses and degree of stenosis indicated that the “negative” hypercapnic CBF responses were correlated with the degree of stenosis (Figure 7A). Note that the incidences of negative hypercapnic CBF response in ACA, MCA and BA territory were lower than the incidences of stenosis (Figure 7B), indicating that not all stenosis led to negative hypercapnic CBF responses. It is interesting to note that only some animals showed vessel stenosis with negative CVR response. This likely arose from variability of the disease model at this stage of the disease. We predict that with more severe hypertension, all animals will likely develop more severe stenosis and with increased likelihood of exhibiting negative CVR response.
The published data on basal CBF at late stage are generally congruent. SHR CBF was reduced as measured by ASL-MRI at 40 weeks (Leoni et al., 2011), dynamic-susceptibility-contrast MRI at 56–60 weeks (Lee et al., 2011), and hydrogen-clearance method at 40 weeks (Yamori and Horie, 1977). SHR hypercapnia-induced CBF response was reduced at 40 weeks using ASL-MRI (Leoni et al., 2011). However, to our knowledge, the finding of the paradoxically negative hypercapnia-induced CBF responses in some brain regions, with confirmation of the affected perfusion territories by abnormal MRA, is novel. Negative hypercapnia-induced CBF response is a sign of compromised cerebrovascular reserved and is clinically relevant as it is associated increased risk of stroke (Kuroda et al., 2001) and dementia (Marshall and Lazar, 2011).
Regional differences in susceptibility
Amongst the major cerebral arteries studied, the MCA was affected first and had the highest frequency stenosis, consistent with the high frequency of ischemic stroke in patients occurring in the MCA territory (Ng et al., 2007). The MCA territory includes the hippocampus, which could partly contribute the observed vascular dementia in SHR (Sabbatini et al., 2002). AA was the second most susceptible to hypertensive effects with the second highest incidence of stenosis. AA is the recurrent branch of ACA and had the second frequency negative hypercapnia-induced CBF response. AA supplies the anteriomedial region of brain. The "recurrent branch" has reduced distal CBF, which could make the anteriomedial region more susceptible to disease. Indeed, it has been reported that the anteriomedial region has relatively high frequency cerebral infarction in hypertensive stroke prone rats (Yamori et al., 1976).
CONCLUSIONS
We showed that multi-parametric MRI could provide non-invasive and clinically relevant information regarding cerebral vascular anatomy, physiology and function in chronic hypertension. These parameters were altered in early stage of chronic hypertension and worsen with disease progression, ultimately resulting in stenosis, hypoperfusion and compromised cerebrovascular reserve, which could increase susceptibility to brain disorders, such as stroke and dementia. The abnormal hypercapnia-induced CBF responses in some brain regions were confirmed by abnormal MRA showing the affected perfusion territories. The MCA and AA territories are most susceptible to hypertension-induced changes. Future studies will investigate hypertensive treatments on cerebrovascular anatomy and function with MRI being used to guide specific therapeutic targets for optimal treatment time windows. MRI has the potential to be used to identify brain regions susceptible to cerebrovascular compromise, improve understanding of disease pathogenesis as well as guide and monitor treatments in hypertension.
Highlights.
Hypertensive rats show abnormal cerebral MRA, blood flow, and vascular reactivity
There are regional differences in poor cerebrovascular reserve
Regions with negative hypercapnia-induced CBF response are correlated with stenosis
These parameters change progressively worse with age
Acknowledgement
This work was supported in part by the NIH (NS45879) the American Heart Association (EIA 0940104N), a Pilot Award, Translational Technology Research Award from the Clinical Translational Science Award (CTSA, parent grant UL1 TR001120), a predoctoral training grant TL1 (CTSA Parent grant TL1TR001119) and faculty training grant KL2 (CTSA parent grant KL2 TR001118). YL was supported in part by the national science foundation of china (No.81200971).
Footnotes
Publisher's Disclaimer: This is a PDF file of an unedited manuscript that has been accepted for publication. As a service to our customers we are providing this early version of the manuscript. The manuscript will undergo copyediting, typesetting, and review of the resulting proof before it is published in its final citable form. Please note that during the production process errors may be discovered which could affect the content, and all legal disclaimers that apply to the journal pertain.
DISCLOSURE/CONFLICT OF INTEREST
The authors declare no conflict of interest.
Reference
- Bakker EN, van der Meulen ET, van den Berg BM, Everts V, Spaan JA, VanBavel E. Inward remodeling follows chronic vasoconstriction in isolated resistance arteries. J Vasc Res. 2002;39:12–20. doi: 10.1159/000048989. [DOI] [PubMed] [Google Scholar]
- Baumbach GL, Dobrin PB, Hart MN, Heistad DD. Mechanics of cerebral arterioles in hypertensive rats. Circ Res. 1988;62:56–64. doi: 10.1161/01.res.62.1.56. [DOI] [PubMed] [Google Scholar]
- Bradley WG. Recent advances in magnetic resonance angiography of the brain. Curr Opin Neurol Neurosurg. 1992;5:859–862. [PubMed] [Google Scholar]
- Cipolla MJ, Smith J, Kohlmeyer MM, Godfrey JA. SKCa and IKCa Channels, myogenic tone, and vasodilator responses in middle cerebral arteries and parenchymal arterioles: effect of ischemia and reperfusion. Stroke. 2009;40:1451–1457. doi: 10.1161/STROKEAHA.108.535435. [DOI] [PMC free article] [PubMed] [Google Scholar]
- Dahlof B. Prevention of stroke in patients with hypertension. Am J Cardiol. 2007;100:17J–24J. doi: 10.1016/j.amjcard.2007.05.010. [DOI] [PubMed] [Google Scholar]
- Danker JF, Duong TQ. Quantitative regional cerebral blood flow MRI of animal model of attention-deficit/hyperactivity disorder. Brain Res. 2007;1150:217–224. doi: 10.1016/j.brainres.2007.02.082. [DOI] [PMC free article] [PubMed] [Google Scholar]
- Detre JA, Leigh JS, Williams DS, Koretsky AP. Perfusion imaging. Magn Reson Med. 1992;23:37–45. doi: 10.1002/mrm.1910230106. [DOI] [PubMed] [Google Scholar]
- Duong TQ, Kim DS, Ugurbil K, Kim SG. Spatiotemporal dynamics of the BOLD fMRI signals: toward mapping submillimeter cortical columns using the early negative response. Magn Reson Med. 2000;44:231–242. doi: 10.1002/1522-2594(200008)44:2<231::aid-mrm10>3.0.co;2-t. [DOI] [PubMed] [Google Scholar]
- Gohlke P, Stoll M, Lamberty V, Mattfeld T, Mall G, van Even P, Martorana P, Unger T. Cardiac and vascular effects of chronic angiotensin converting enzyme inhibition at subantihypertensive doses. J Hypertens Suppl. 1992;10:S141–S144. [PubMed] [Google Scholar]
- Grabowski M, Mattsson B, Nordborg C, Johansson BB. Brain capillary density and cerebral blood flow after occlusion of the middle cerebral artery in normotensive Wistar-Kyoto rats and spontaneously hypertensive rats. J Hypertens. 1993;11:1363–1368. doi: 10.1097/00004872-199312000-00007. [DOI] [PubMed] [Google Scholar]
- Harrap SB, Van der Merwe WM, Griffin SA, Macpherson F, Lever AF. Brief angiotensin converting enzyme inhibitor treatment in young spontaneously hypertensive rats reduces blood pressure long-term. Hypertension. 1990;16:603–614. doi: 10.1161/01.hyp.16.6.603. [DOI] [PubMed] [Google Scholar]
- Heinert G, Casadei B, Paterson DJ. Hypercapnic cerebral blood flow in spontaneously hypertensive rats. J Hypertens. 1998;16:1491–1498. doi: 10.1097/00004872-199816100-00014. [DOI] [PubMed] [Google Scholar]
- Hom S, Fleegal MA, Egleton RD, Campos CR, Hawkins BT, Davis TP. Comparative changes in the blood-brain barrier and cerebral infarction of SHR and WKY rats. Am J Physiol Regul Integr Comp Physiol. 2007;292:R1881–R1892. doi: 10.1152/ajpregu.00761.2005. [DOI] [PubMed] [Google Scholar]
- Izzard AS, Bund SJ, Heagerty AM. Myogenic tone in mesenteric arteries from spontaneously hypertensive rats. Am J Physiol. 1996;270:H1–H6. doi: 10.1152/ajpheart.1996.270.1.H1. [DOI] [PubMed] [Google Scholar]
- Kang CK, Park CA, Lee H, Kim SH, Park CW, Kim YB, Cho ZH. Hypertension correlates with lenticulostriate arteries visualized by 7T magnetic resonance angiography. Hypertension. 2009;54:1050–1056. doi: 10.1161/HYPERTENSIONAHA.109.140350. [DOI] [PubMed] [Google Scholar]
- Kim T, Richard Jennings J, Kim SG. Regional cerebral blood flow and arterial blood volume and their reactivity to hypercapnia in hypertensive and normotensive rats. J Cereb Blood Flow Metab. 2014;34:408–414. doi: 10.1038/jcbfm.2013.197. [DOI] [PMC free article] [PubMed] [Google Scholar]
- Kuroda S, Houkin K, Kamiyama H, Mitsumori K, Iwasaki Y, Abe H. Long-term prognosis of medically treated patients with internal carotid or middle cerebral artery occlusion: can acetazolamide test predict it? Stroke. 2001;32:2110–2116. doi: 10.1161/hs0901.095692. [DOI] [PubMed] [Google Scholar]
- Laurent S, Boutouyrie P, Lacolley P. Structural and genetic bases of arterial stiffness. Hypertension. 2005;45:1050–1055. doi: 10.1161/01.HYP.0000164580.39991.3d. [DOI] [PubMed] [Google Scholar]
- Lee RM. Morphology of cerebral arteries. Pharmacol Ther. 1995;66:149–173. doi: 10.1016/0163-7258(94)00071-a. [DOI] [PubMed] [Google Scholar]
- Lee TH, Liu HL, Yang ST, Yang JT, Yeh MY, Lin JR. Effects of aging and hypertension on cerebral ischemic susceptibility: evidenced by MR diffusion-perfusion study in rat. Exp Neurol. 2011;227:314–321. doi: 10.1016/j.expneurol.2010.12.003. [DOI] [PubMed] [Google Scholar]
- Leoni RF, Paiva FF, Henning EC, Nascimento GC, Tannus A, de Araujo DB, Silva AC. Magnetic resonance imaging quantification of regional cerebral blood flow and cerebrovascular reactivity to carbon dioxide in normotensive and hypertensive rats. Neuroimage. 2011;58:75–81. doi: 10.1016/j.neuroimage.2011.06.030. [DOI] [PMC free article] [PubMed] [Google Scholar]
- Marshall RS, Lazar RM. Pumps, aqueducts, and drought management: vascular physiology in vascular cognitive impairment. Stroke. 2011;42:221–226. doi: 10.1161/STROKEAHA.110.595645. [DOI] [PMC free article] [PubMed] [Google Scholar]
- Muir ER, Duong TQ. Layer-specific functional and anatomical MRI of the retina with passband balanced SSFP. Magn Reson Med. 2011;66:1416–1421. doi: 10.1002/mrm.22935. [DOI] [PMC free article] [PubMed] [Google Scholar]
- Mulvany MJ, Aalkjaer C, Christensen J. Changes in noradrenaline sensitivity and morphology of arterial resistance vessels during development of high blood pressure in spontaneously hypertensive rats. Hypertension. 1980;2:664–671. doi: 10.1161/01.hyp.2.5.664. [DOI] [PubMed] [Google Scholar]
- Ng YS, Stein J, Ning M, Black-Schaffer RM. Comparison of clinical characteristics and functional outcomes of ischemic stroke in different vascular territories. Stroke. 2007;38:2309–2314. doi: 10.1161/STROKEAHA.106.475483. [DOI] [PubMed] [Google Scholar]
- Pedelty L, Gorelick PB. Management of hypertension and cerebrovascular disease in the elderly. Am J Med. 2008;121:S23–S31. doi: 10.1016/j.amjmed.2008.05.019. [DOI] [PubMed] [Google Scholar]
- Pires PW, Rogers CT, McClain JL, Garver HS, Fink GD, Dorrance AM. Doxycycline, a matrix metalloprotease inhibitor, reduces vascular remodeling and damage after cerebral ischemia in stroke-prone spontaneously hypertensive rats. Am J Physiol Heart Circ Physiol. 2011;301:H87–H97. doi: 10.1152/ajpheart.01206.2010. [DOI] [PMC free article] [PubMed] [Google Scholar]
- Rigsby CS, Ergul A, Portik Dobos V, Pollock DM, Dorrance AM. Effects of spironolactone on cerebral vessel structure in rats with sustained hypertension. Am J Hypertens. 2011;24:708–715. doi: 10.1038/ajh.2011.20. [DOI] [PMC free article] [PubMed] [Google Scholar]
- Rigsby CS, Pollock DM, Dorrance AM. Spironolactone improves structure and increases tone in the cerebral vasculature of male spontaneously hypertensive stroke-prone rats. Microvasc Res. 2007;73:198–205. doi: 10.1016/j.mvr.2006.12.001. [DOI] [PMC free article] [PubMed] [Google Scholar]
- Sabbatini M, Catalani A, Consoli C, Marletta N, Tomassoni D, Avola R. The hippocampus in spontaneously hypertensive rats: an animal model of vascular dementia? Mech Ageing Dev. 2002;123:547–559. doi: 10.1016/s0047-6374(01)00362-1. [DOI] [PubMed] [Google Scholar]
- Samuels OB, Joseph GJ, Lynn MJ, Smith HA, Chimowitz MI. A standardized method for measuring intracranial arterial stenosis. AJNR Am J Neuroradiol. 2000;21:643–646. [PMC free article] [PubMed] [Google Scholar]
- Shen Q, Meng X, Fisher M, Sotak CH, Duong TQ. Pixel-by-pixel spatiotemporal progression of focal ischemia derived using quantitative perfusion and diffusion imaging. J Cereb Blood Flow Metab. 2003;23:1479–1488. doi: 10.1097/01.WCB.0000100064.36077.03. [DOI] [PMC free article] [PubMed] [Google Scholar]
- Sicard KM, Duong TQ. Effects of Hypoxia, Hyperoxia and Hypercapnia on Baseline and Stimulus-Evoked BOLD, CBF and CMRO2 in Spontaneously Breathing Animals. Neuroimage. 2005;25:850–858. doi: 10.1016/j.neuroimage.2004.12.010. [DOI] [PMC free article] [PubMed] [Google Scholar]
- Sierra C, Domenech M, Camafort M, Coca A. Hypertension and mild cognitive impairment. Curr Hypertens Rep. 2012;14:548–555. doi: 10.1007/s11906-012-0315-2. [DOI] [PubMed] [Google Scholar]
- Sobczyk O, Battisti-Charbonney A, Fierstra J, Mandell DM, Poublanc J, Crawley AP, Mikulis DJ, Duffin J, Fisher JA. A conceptual model for CO(2)-induced redistribution of cerebral blood flow with experimental confirmation using BOLD MRI. Neuroimage. 2014;92:56–68. doi: 10.1016/j.neuroimage.2014.01.051. [DOI] [PubMed] [Google Scholar]
- van Gorp AW, Schenau DS, Hoeks AP, Boudier HA, de Mey JG, Reneman RS. In spontaneously hypertensive rats alterations in aortic wall properties precede development of hypertension. Am J Physiol Heart Circ Physiol. 2000;278:H1241–H1247. doi: 10.1152/ajpheart.2000.278.4.H1241. [DOI] [PubMed] [Google Scholar]
- Wei L, Lin SZ, Tajima A, Nakata H, Acuff V, Patlak C, Pettigrew K, Fenstermacher J. Cerebral glucose utilization and blood flow in adult spontaneously hypertensive rats. Hypertension. 1992;20:501–510. doi: 10.1161/01.hyp.20.4.501. [DOI] [PubMed] [Google Scholar]
- Yamori Y, Horie R. Developmental course of hypertension and regional cerebral blood flow in stroke-prone spontaneously hypertensive rats. Stroke. 1977;8:456–461. doi: 10.1161/01.str.8.4.456. [DOI] [PubMed] [Google Scholar]
- Yamori Y, Horie R, Handa H, Sato M, Fukase M. Pathogenetic similarity of strokes in stroke-prone spontaneously hypertensive rats and humans. Stroke. 1976;7:46–53. doi: 10.1161/01.str.7.1.46. [DOI] [PubMed] [Google Scholar]
- Zanchi A, Brunner HR, Hayoz D. Age-related changes of the mechanical properties of the carotid artery in spontaneously hypertensive rats. J Hypertens. 1997;15:1415–1422. doi: 10.1097/00004872-199715120-00008. [DOI] [PubMed] [Google Scholar]
- Zhou Q, Dong Y, Huang L, Yang S, Chen W. Study of cerebrovascular reserve capacity by magnetic resonance perfusion weighted imaging and photoacoustic imaging. Magn Reson Imaging. 2009;27:155–162. doi: 10.1016/j.mri.2008.07.002. [DOI] [PubMed] [Google Scholar]
- Zicha J, Kunes J. Ontogenetic aspects of hypertension development: analysis in the rat. Physiol Rev. 1999;79:1227–1282. doi: 10.1152/physrev.1999.79.4.1227. [DOI] [PubMed] [Google Scholar]


