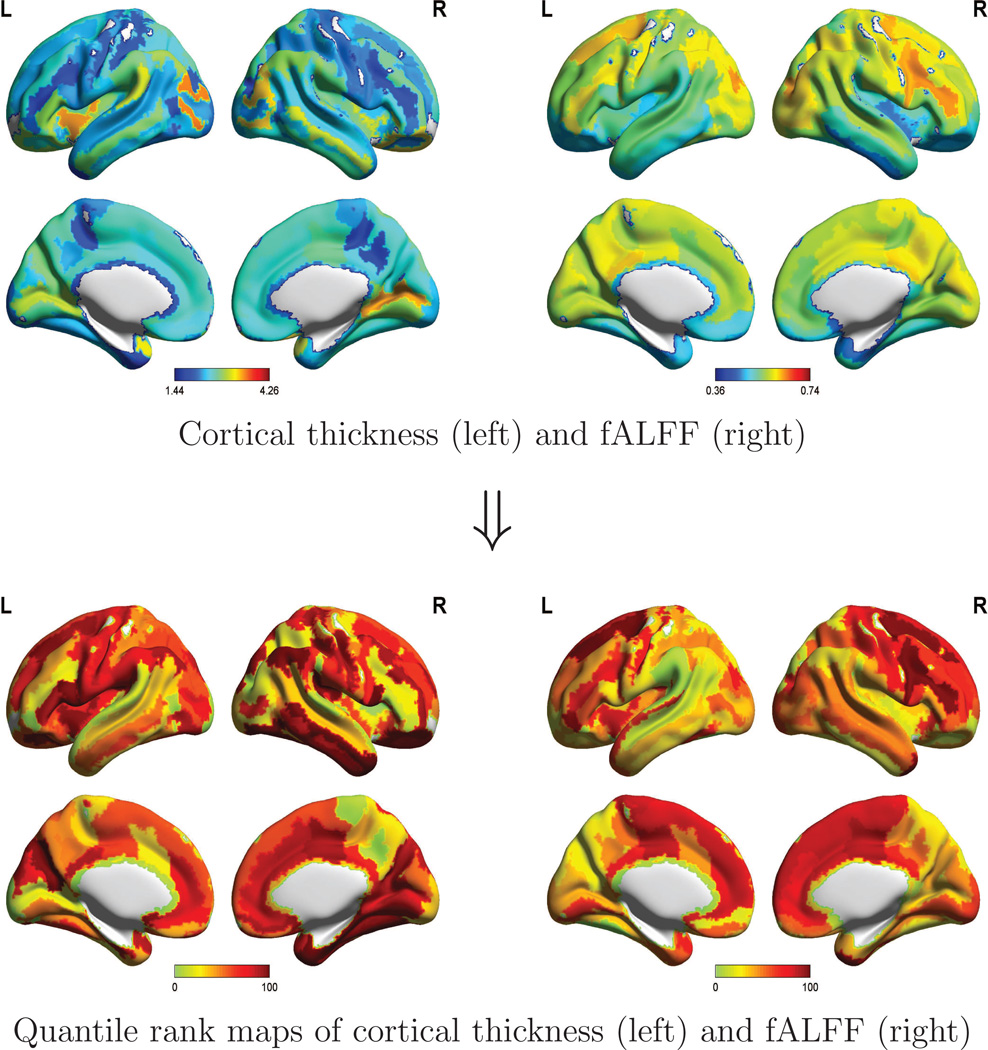
Figure 2.
Maps of cortical thickness and fALFF for a randomly selected participant in the NKI Rockland pilot sample. Raw values of these measures are displayed above for 146 ROIs; inserting these values (y) into formula (5) yields the quantile ranks τ̂ = F̂t(y) that are mapped below.

