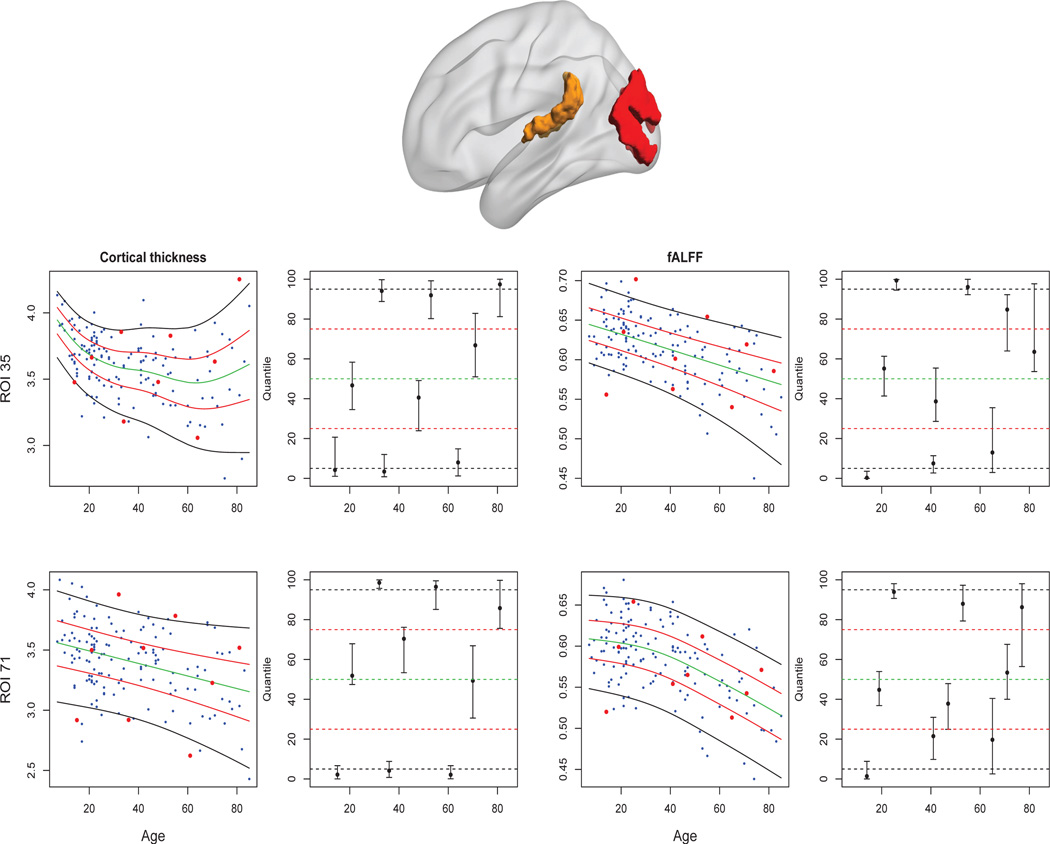
Figure 3.
Top: ROI 35 (left middle occipital gyrus of the visual area) is shown in red, and ROI 71 (left polar plane of the superior temporal gyrus of the auditory area) is shown in yellow. Bottom panels: cortical thickness (left columns); fALFF (right columns). The first and third columns display the raw data and estimated 5%, 25%, 50%, 75%, 95% quantile curves together with the data used to estimate the distributions. For the nine individuals represented by red dots, quantile rank estimates with 95% confidence intervals are shown in the second and fourth columns.

