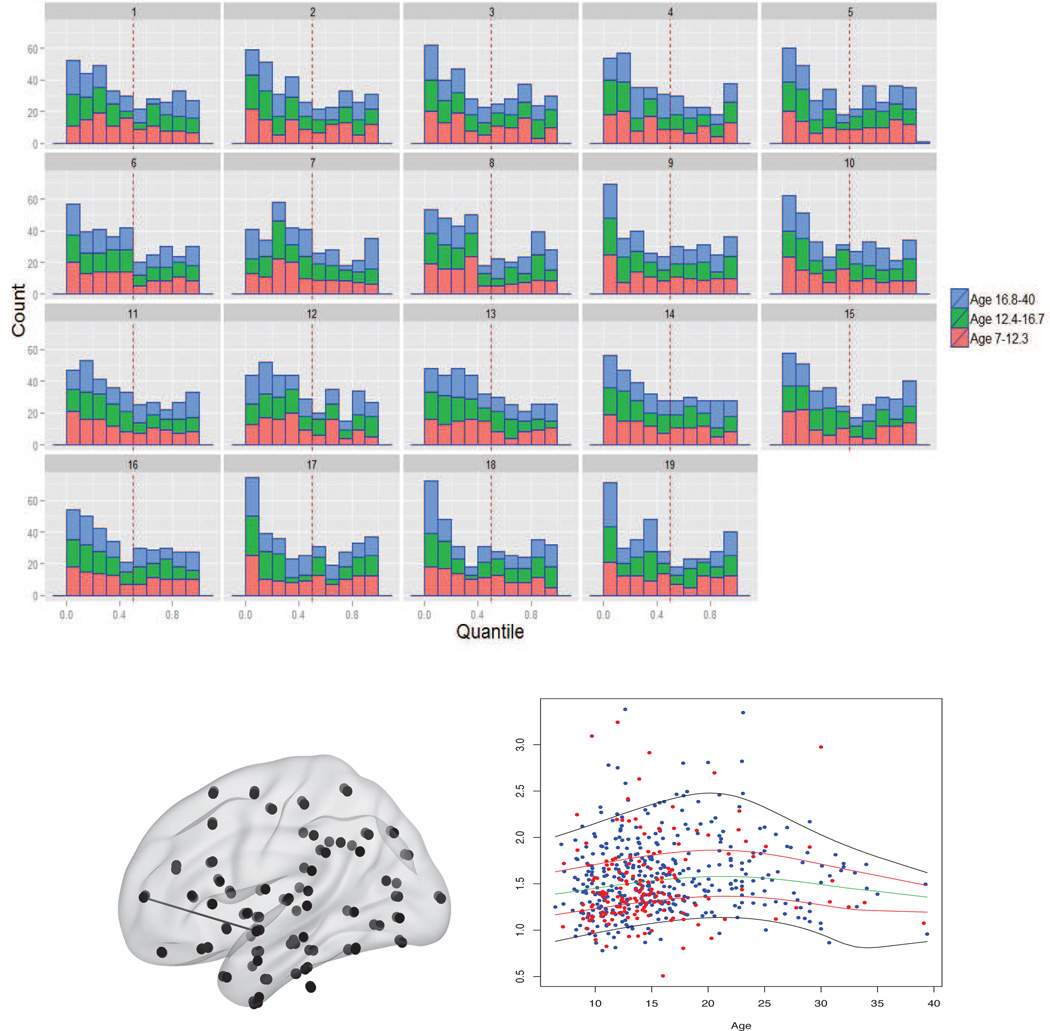
Figure 6.
Top panels: Histogram of the quantile ranks of the ASD subjects at the 19 edges declared significant by the recalibrated K-S test but not by Wald tests. Each bar displays counts within the lower (red), middle (green), and upper (blue) thirds of the age distribution. Bottom panels: (Left) Location of the first of the 19 edges: left frontal pole–left superior temporal gyrus, anterior division. (Right) Raw data for this edge (with control and ASD individuals represented by blue and red dots, respectively), and estimated 5%, 25%, 50%, 75%, 95% quantile curves for the control group.

